2021 Annual Survey of Nurses
Survey Data Tables
Analysis of the survey responses are presented in tables and charts below:
Survey Respondents & Response Rates
Demographic Characteristics of Survey Respondents
| Demographics | RN = 33,958 | LPN = 4,284 | ||
|---|---|---|---|---|
| n | Estimate | n | Estimate | |
| Age | ||||
| <25 years | 382 | 1.1% | 44 | 1.0% |
| 25 to 34 years | 4,205 | 12.4% | 457 | 10.7% |
| 35 to 44 years | 5,904 | 17.4% | 864 | 20.2% |
| 45 to 54 years | 6,215 | 18.3% | 842 | 19.7% |
| 55 to 64 years | 7,616 | 22.4% | 902 | 21.1% |
| 65 to 74 years | 5,831 | 17.2% | 637 | 14.9% |
| 75+ years | 898 | 2.6% | 65 | 1.5% |
| Unknown | 2,907 | 8.6% | 473 | 11.0% |
| Gender | ||||
| Female | 29,365 | 86.5% | 3,699 | 86.3% |
| Male | 2,858 | 8.4% | 261 | 6.1% |
| Unknown | 1,735 | 5.1% | 324 | 7.6% |
| Race | ||||
| White | 28,589 | 84.2% | 2,760 | 64.4% |
| Black | 1,984 | 5.8% | 1,016 | 23.7% |
| American Indian | 427 | 1.3% | 94 | 2.2% |
| Asian/ Pacific Islander | 1,039 | 3.1% | 90 | 2.1% |
| Other | 814 | 2.4% | 148 | 3.5% |
| Unknown | 1,933 | 5.7% | 346 | 8.1% |
| Hispanic or Latino | ||||
| Yes | 646 | 1.9% | 106 | 2.5% |
| No | 31,373 | 92.4% | 3,824 | 89.3% |
| Unknown | 1,939 | 5.7% | 354 | 8.3% |
| Arabic or Chaldean | ||||
| Yes | 442 | 1.3% | 27 | 0.6% |
| No | 31,539 | 92.9% | 3,896 | 90.9% |
| Unknown | 1,977 | 5.8% | 361 | 8.4% |
| Region | ||||
| Upper Peninsula | 832 | 2.5% | 208 | 4.9% |
| Northwest LP | 1,211 | 3.6% | 122 | 2.8% |
| Northeast LP | 515 | 1.5% | 108 | 2.5% |
| West/West Central | 4,629 | 13.6% | 630 | 14.7% |
| East Central | 1,451 | 4.3% | 207 | 4.8% |
| East | 2,290 | 6.7% | 343 | 8.0% |
| South Central | 1,209 | 3.6% | 118 | 2.8% |
| Southwest | 1,953 | 5.8% | 250 | 5.8% |
| Southeast | 3,270 | 9.6% | 322 | 7.5% |
| Detroit Metro | 9,710 | 28.6% | 1,238 | 28.9% |
| MI, Unknown Region | 3,797 | 11.2% | 258 | 6.0% |
| Outside MI | 1,624 | 4.8% | 183 | 4.3% |
| Unknown | 3,510 | 10.3% | 627 | 14.6% |
Demographics of APRNs who Completed National AP Certification & LARA-Certified APRNs
| Demographics | Completed National AP Certification | LARA-Certified APRNs |
|---|---|---|
| n = 33,958 | n = 3,273 | |
| Age | ||
| <25 years | 0.0% | * |
| 25 to 34 years | 8.3% | 93.1% |
| 35 to 44 years | 12.0% | 93.3% |
| 45 to 54 years | 9.6% | 92.9% |
| 55 to 64 years | 7.6% | 90.6% |
| 65+ years | 6.5% | 86.4% |
| Gender | ||
| Female | 8.3% | 91.5% |
| Male | 12.6% | 95.1% |
| Race | ||
| White | 8.7% | 92.1% |
| Black | 8.0% | 91.2% |
| American Indian | 5.6% | 99.9% |
| Asian/ Pacific Islander | 9.3% | 90.4% |
| Other Race | 8.9% | 91.0% |
| Hispanic or Latino | ||
| Yes | 7.0% | 93.2% |
| No | 8.7% | 91.9% |
| Arabic or Chaldean | ||
| Yes | 13.4% | 92.9% |
| No | 8.6% | 91.9% |
| Region of Residence | ||
| Upper Peninsula | 7.3% | 93.3% |
| Northwest LP | 8.5% | 90.2% |
| Northeast LP | 7.4% | 91.6% |
| West/West Central | 6.9% | 91.8% |
| East Central | 7.5% | 95.4% |
| East | 6.2% | 92.7% |
| South Central | 9.3% | 92.0% |
| Southwest | 9.1% | 94.8% |
| Southeast | 9.9% | 94.9% |
| Detroit Metro | 10.0% | 93.5% |
| Unknown MI Region | 9.1% | 92.8% |
| Outside MI | 8.7% | 80.8% |
| Region of Employment | ||
| Upper Peninsula | 7.5% | 95.7% |
| Northwest LP | 9.4% | 88.0% |
| Northeast LP | 8.7% | 96.1% |
| West/West Central | 7.4% | 92.4% |
| East Central | 9.7% | 96.4% |
| East | 9.2% | 95.1% |
| South Central | 11.1% | 94.4% |
| Southwest | 10.8% | 96.2% |
| Southeast | 11.4% | 95.0% |
| Detroit Metro | 10.8% | 95.0% |
| Unknown MI Region | 7.0% | 91.7% |
| Outside MI | 10.1% | 78.4% |
* Data are suppressed if count is less than 10 or sample population was less than 20.
Comparison of Survey Respondents to All Nurses Licensed in Michigan
| Characteristics | RNs | LPNs | ||||||
|---|---|---|---|---|---|---|---|---|
| Nurse Population | Survey Participants | Nurse Population | Survey Participants | |||||
| # | % | # | % | # | % | # | % | |
| Total | 164,077 | – | 33,958 | – | 23,655 | – | 4,284 | – |
| Age | ||||||||
| <25 years | 4,494 | 2.7% | 382 | 1.1% | 487 | 2.1% | 44 | 1.0% |
| 25 to 34 years | 33,228 | 20.3% | 4,205 | 12.4% | 4,236 | 17.9% | 457 | 10.7% |
| 35 to 44 years | 34,327 | 20.9% | 5,904 | 17.4% | 5,190 | 21.9% | 864 | 20.2% |
| 45 to 54 years | 33,641 | 20.5% | 6,215 | 18.3% | 4,835 | 20.4% | 842 | 19.7% |
| 55 to 64 years | 35,531 | 21.7% | 7,616 | 22.4% | 5,142 | 21.7% | 902 | 21.1% |
| 65 to 74 years | 19,422 | 11.8% | 5,831 | 17.2% | 2,933 | 12.4% | 637 | 14.9% |
| 75+ years | 2,778 | 1.7% | 898 | 2.6% | 379 | 1.6% | 65 | 1.5% |
| Unknown | 656 | 0.4% | 2,907 | 8.6% | 453 | 1.9% | 473 | 11.0% |
| Region | ||||||||
| Eastern/Central/Western UP | 4,288 | 2.6% | 832 | 2.5% | 1,512 | 6.4% | 208 | 4.9% |
| Northwest LP | 5,142 | 3.1% | 1,211 | 3.6% | 593 | 2.5% | 122 | 2.8% |
| Northeast LP | 2,602 | 1.6% | 515 | 1.5% | 698 | 3.0% | 108 | 2.5% |
| West/West Central | 20,962 | 12.8% | 4,629 | 13.6% | 3,461 | 14.6% | 630 | 14.7% |
| East Central | 8,080 | 4.9% | 1,451 | 4.3% | 1,491 | 6.3% | 207 | 4.8% |
| East | 12,802 | 7.8% | 2,290 | 6.7% | 2,142 | 9.1% | 343 | 8.0% |
| South Central | 5,792 | 3.5% | 1,209 | 3.6% | 712 | 3.0% | 118 | 2.8% |
| Southwest | 10,053 | 6.1% | 1,953 | 5.8% | 1,603 | 6.8% | 250 | 5.8% |
| Southeast | 16,210 | 9.9% | 3,270 | 9.6% | 2,116 | 8.9% | 322 | 7.5% |
| Detroit Metro | 54,057 | 32.9% | 9,710 | 28.6% | 7,879 | 33.3% | 1,238 | 28.9% |
| MI, Unknown Region | 31 | 0.0% | 1,624 | 4.8% | 2 | 0.0% | 183 | 4.3% |
| Non-Michigan | 24,058 | 14.7% | 3,797 | 11.2% | 1,446 | 6.1% | 258 | 6.0% |
| Unknown Region | – | – | 1,467 | 4.3% | – | – | 297 | 6.9% |
| LARA-certified APRN (Advanced Practitioner Registered Nurse) | ||||||||
| Nurse Practitioner | 10,687 | 6.5% | 2,213 | 6.5% | – | – | – | – |
| Anesthetist | 2,981 | 1.8% | 498 | 1.5% | – | – | – | – |
| Midwife | 487 | 0.3% | 126 | 0.4% | – | – | – | – |
| Clinical Specialist | 246 | 0.1% | 146 | 0.4% | – | – | – | – |
Education
Highest Level of Nursing-Related Education
| Education Level | RN = 33,792 | LPN = 4,276 | ||
|---|---|---|---|---|
| Estimate | 95% CI | Estimate | 95% CI | |
| LPN diploma/certificate | 0.0% | (0.0%, 0.0%) | 93.8% | (93.0%, 94.5%) |
| RN diploma in nursing | 5.3% | (5.1%, 5.5%) | 0.5% | (0.3%, 0.8%) |
| Associate degree in nursing | 30.9% | (30.4%, 31.4%) | 4.6% | (4.0%, 5.3%) |
| Bachelor’s degree in nursing | 48.6% | (48.1%, 49.1%) | 0.9% | (0.7%, 1.2%) |
| Master’s degree in nursing | 13.1% | (12.7%, 13.5%) | 0.1% | (0.0%, 0.2%) |
| Doctorate in Nursing Practice (DNP) | 1.4% | (1.3%, 1.5%) | 0.0% | (0.0%, 0.1%) |
| Doctor of Nurse Anesthesia (DNAP) | 0.1% | (0.1%, 0.1%) | 0.0% | (0.0%, 0.1%) |
| Doctor of Philosophy in Nursing (PhD) | 0.5% | (0.4%, 0.6%) | 0.0% | (0.0%, 0.1%) |
| Other doctoral degree in nursing | 0.1% | (0.1%, 0.1%) | 0.0% | (0.0%, 0.1%) |
Highest Level of Non-Nursing Education
| Education Level | RN = 33,561 | LPN = 4,207 | ||
|---|---|---|---|---|
| Estimate | 95% CI | Estimate | 95% CI | |
| Non-nursing associate degree | 14.5% | (14.1%, 14.9%) | 25.0% | (23.7%, 26.3%) |
| Non-nursing bachelor’s degree | 15.9% | (15.5%, 16.3%) | 7.0% | (6.3%, 7.8%) |
| Non-nursing master’s degree | 5.7% | (5.5%, 6.0%) | 1.8% | (1.4%, 2.2%) |
| Non-nursing doctoral degree | 0.7% | (0.6%, 0.8%) | 0.4% | (0.2%, 0.6%) |
| Not applicable | 63.2% | (62.7%, 63.7%) | 65.8% | (64.4%, 67.2%) |
Educational Background that Qualified for First Nursing License
| Education Level | RN = 33,926 | |
|---|---|---|
| Estimate | 95% CI | |
| LPN diploma/certificate | 5.4% | (5.2%, 5.6%) |
| RN diploma in nursing | 8.4% | (8.1%, 8.7%) |
| Associate degree in nursing | 38.0% | (37.5%, 38.5%) |
| Bachelor’s degree in nursing | 44.5% | (44.0%, 45.0%) |
| Master’s degree in nursing | 3.7% | (3.5%, 3.9%) |
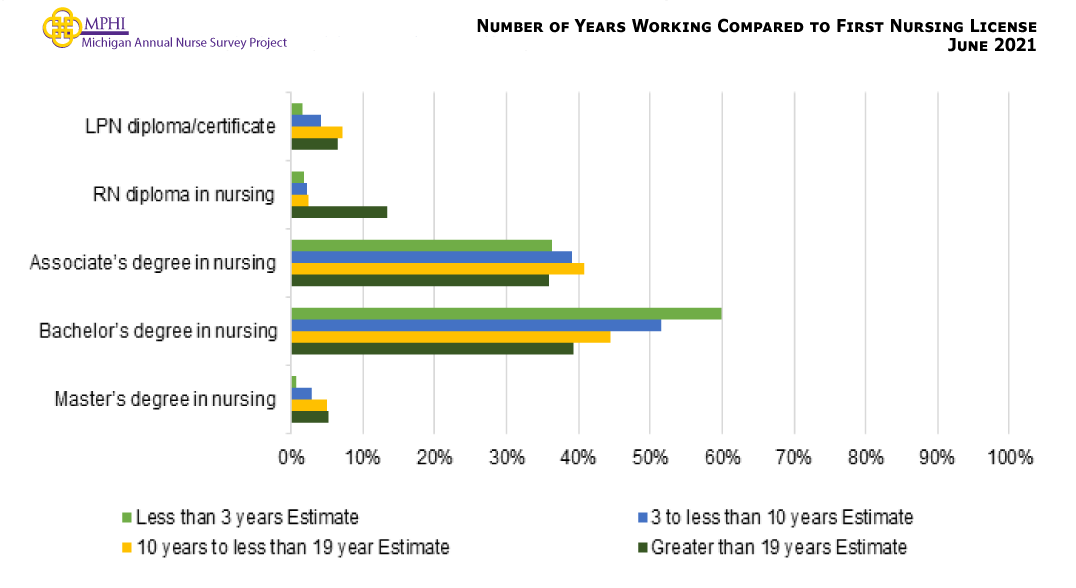
Number of Years Working Compared to First Nursing License
Current Enrollment in Nursing Educational Programs
| Degree | RN = 3,040 | LPN = 791 | ||
|---|---|---|---|---|
| Estimate | 95% CI | Estimate | 95% CI | |
| Associate’s Degree in Nursing (ADN) | * | * | 87.8% | (85.3%, 89.9%) |
| Bachelor of Science in Nursing (BSN) | 0.6% | (0.4%, 0.9%) | 13.9% | (11.7%, 16.5%) |
| Master of Science in Nursing (MSN) | 49.3% | (47.5%, 51.1%) | 0.4% | (0.1%, 1.1%) |
| Doctor of Nursing Practice (DNP) | 36.5% | (34.8%, 38.2%) | 0.2% | (0.0%, 0.8%) |
| Doctor of Nurse Anesthesia (DNAP) | 12.6% | (11.5%, 13.8%) | 0.0% | (0.0%, 0.5%) |
| Doctor of Philosophy in Nursing (PhD) | 1.9% | (1.5%, 2.4%) | 0.0% | (0.0%, 0.5%) |
* Data are suppressed if count is less than 10 or sample population was less than 20.
Current Enrollment in Educational Programs Associated with AP National Nursing Specialty Certification Exams
| Certification | RN = 1,351 | |
|---|---|---|
| Estimate | 95% CI | |
| Nurse Practitioner | 59.3% | (56.7%, 61.9%) |
| Nurse Midwife | 3.2% | (2.4%, 4.3%) |
| Nurse Anesthetist | 6.0% | (4.9%, 7.4%) |
| Clinical Nurse Specialist | 4.5% | (3.5%, 5.7%) |
| Other | 27.0% | (24.7%, 29.4%) |
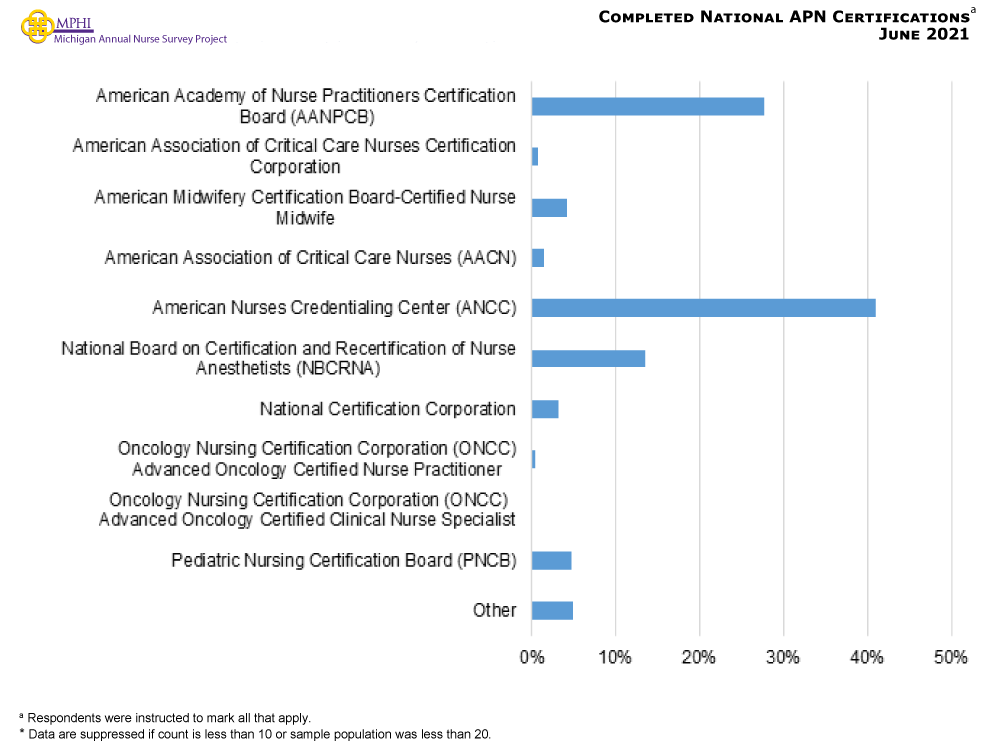
Completed National AP Certifications
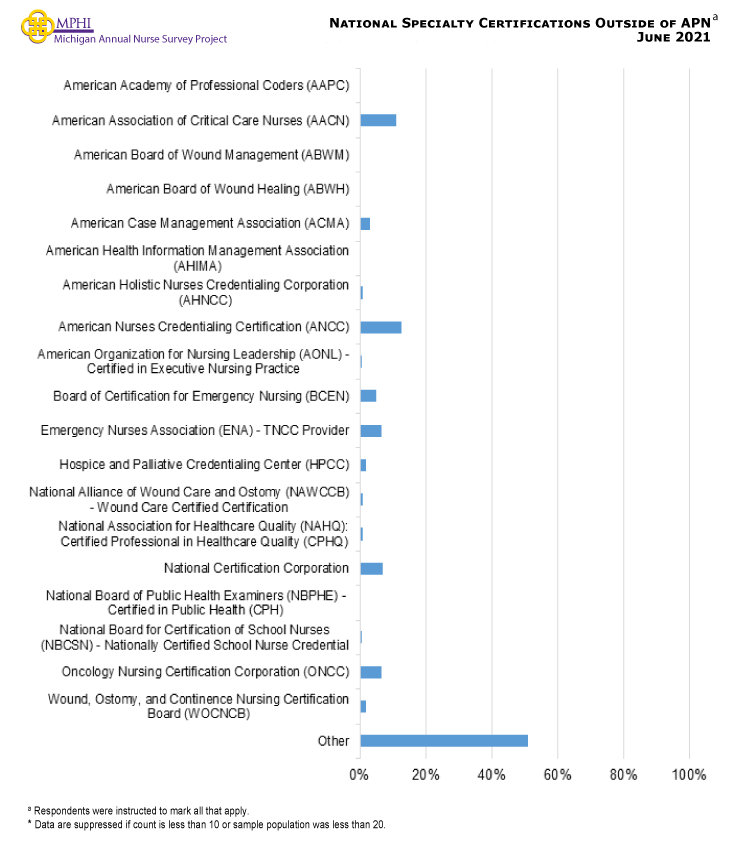
National Specialty Certifications Outside of AP
Employment
Current Employment Status
| Employment | RN = 33,958 | LPN = 4,284 | ||
|---|---|---|---|---|
| Estimate | 95% CI | Estimate | 95% CI | |
| Actively employed in nursing or in a position that requires a nurse license full-time | 63.5% | (63.0%, 64.0%) | 58.5% | (57.0%, 60.0%) |
| Actively employed in nursing or in a position that requires a nurse license part-time | 10.8% | (10.5%, 11.1%) | 9.7% | (8.8%, 10.6%) |
| Actively employed in nursing or in a position that requires a nurse license on a per-diem basis | 5.0% | (4.8%, 5.2%) | 4.7% | (4.1%, 5.4%) |
| On temporary medical leave from a position that requires a nurse license | 1.1% | (1.0%, 1.2%) | 1.9% | (1.5%, 2.4%) |
| On temporary non- medical leave from a position that requires a nurse license | 0.3% | (0.2%, 0.4%) | 0.7% | (0.5%, 1.0%) |
| Actively employed in a field other than nursing | 2.6% | (2.4%, 2.8%) | 4.8% | (4.2%, 5.5%) |
| Unemployed, volunteer status only | 1.2% | (1.1%, 1.3%) | 1.4% | (1.1%, 1.8%) |
| Unemployed, seeking work as a nurse | 2.0% | (1.9%, 2.2%) | 5.0% | (4.4%, 5.7%) |
| Unemployed, not seeking work as a nurse | 3.2% | (3.0%, 3.4%) | 3.8% | (3.3%, 4.4%) |
| Retired | 10.3% | (10.0%, 10.6%) | 9.7% | (8.8%, 10.6%) |
Percentage of Nurses Who are Employed in Nursing by Demographic Characteristics
| Demographics | RN | LPN | ||||
|---|---|---|---|---|---|---|
| n | Estimate | 95% CI | n | Estimate | 95% CI | |
| Total | 33,958 | 79.3% | (78.9%, 79.7%) | 4,284 | 72.8% | (71.4%, 74.1%) |
| Age | ||||||
| <25 years | 382 | 96.1% | (93.7%, 97.6%) | 44 | 81.8% | (68.0%, 90.5%) |
| 25 to 34 years | 4,205 | 91.2% | (90.3%, 92.0%) | 457 | 86.2% | (82.7%, 89.1%) |
| 35 to 44 years | 5,904 | 89.5% | (88.7%, 90.3%) | 864 | 82.8% | (80.1%, 85.2%) |
| 45 to 54 years | 6,215 | 90.0% | (89.2%, 90.7%) | 842 | 81.1% | (78.3%, 83.6%) |
| 55 to 64 years | 7,616 | 75.4% | (74.4%, 76.4%) | 902 | 69.8% | (66.7%, 72.7%) |
| 65+ years | 6,729 | 32.4% | (31.3%, 33.5%) | 702 | 31.0% | (27.7%, 34.5%) |
| Gender | ||||||
| Female | 29,365 | 78.8% | (78.3%, 79.3%) | 3,699 | 72.4% | (70.9%, 73.8%) |
| Male | 2,858 | 84.2% | (82.8%, 85.5%) | 261 | 75.8% | (70.3%, 80.6%) |
| Race & Ethnicity | ||||||
| White | 28,589 | 78.8% | (78.3%, 79.3%) | 2,760 | 69.3% | (67.6%, 71.0%) |
| Black | 1,984 | 83.1% | (81.4%, 84.7%) | 1,016 | 80.8% | (78.3%, 83.1%) |
| Hispanic or Latino | 646 | 86.9% | (84.1%, 89.3%) | 106 | 83.7% | (75.5%, 89.5%) |
| Arabic or Chaldean | 442 | 80.2% | (76.2%, 83.6%) | 27 | 68.9% | (50.0%, 83.1%) |
| Other* | 2,222 | 81.7% | (80.0%, 83.3%) | 321 | 75.3% | (70.3%, 79.7%) |
| Residence | ||||||
| Upper Peninsula | 832 | 77.3% | (74.3%, 80.0%) | 208 | 72.6% | (66.2%, 78.2%) |
| Northwest LP | 1,211 | 75.5% | (73.0%, 77.8%) | 122 | 58.5% | (49.6%, 66.9%) |
| Northeast LP | 515 | 70.0% | (65.9%, 73.8%) | 108 | 65.9% | (56.6%, 74.2%) |
| West/West Central | 4,629 | 80.5% | (79.3%, 81.6%) | 630 | 69.8% | (66.1%, 73.3%) |
| East Central | 1,451 | 79.7% | (77.6%, 81.7%) | 207 | 73.2% | (66.8%, 78.8%) |
| East | 2,290 | 80.4% | (78.7%, 82.0%) | 343 | 71.1% | (66.1%, 75.6%) |
| South Central | 1,209 | 80.0% | (77.7%, 82.2%) | 118 | 69.6% | (60.8%, 77.2%) |
| Southwest | 1,953 | 81.1% | (79.3%, 82.8%) | 250 | 72.4% | (66.6%, 77.6%) |
| Southeast | 3,270 | 78.9% | (77.5%, 80.3%) | 322 | 79.7% | (75.0%, 83.7%) |
| Detroit Metro | 9,710 | 80.0% | (79.2%, 80.8%) | 1,238 | 75.6% | (73.1%, 77.9%) |
| Michigan Residence** | 1,624 | 84.6% | (82.8%, 86.3%) | 183 | 77.4% | (70.8%, 82.9%) |
| Non-Michigan Residence | 3,797 | 75.4% | (74.0%, 76.7%) | 258 | 67.3% | (61.4%, 72.7%) |
* Includes individuals who indicated they were American Indian, Asian/PI, or Other race.
**Includes individuals who indicated they live in Michigan but did not provide a zip code.
Demographic Characteristics of Employed Nurses in the Nursing Field
| Demographics | RN = 25,472 | LPN = 3,032 | ||
|---|---|---|---|---|
| Estimate | 95% CI | Estimate | 95% CI | |
| Age | ||||
| <25 years | 3.3% | (3.1%, 3.5%) | 2.4% | (1.9%, 3.0%) |
| 25 to 34 years | 23.4% | (22.9%, 23.9%) | 21.6% | (20.2%, 23.1%) |
| 35 to 44 years | 23.7% | (23.2%, 24.2%) | 25.4% | (23.9%, 27.0%) |
| 45 to 54 years | 23.4% | (22.9%, 23.9%) | 23.2% | (21.7%, 24.7%) |
| 55 to 64 years | 20.7% | (20.2%, 21.2%) | 21.3% | (19.9%, 22.8%) |
| 65+ years | 5.6% | (5.3%, 5.9%) | 6.1% | (5.3%, 7.0%) |
| Gender | ||||
| Female | 90.3% | (89.9%, 90.7%) | 92.9% | (91.9%, 93.8%) |
| Male | 9.7% | (9.3%, 10.1%) | 7.1% | (6.2%, 8.1%) |
| Race | ||||
| White | 88.1% | (87.7%, 88.5%) | 64.4% | (62.7%, 66.1%) |
| Black | 6.3% | (6.0%, 6.6%) | 29.7% | (28.1%, 31.4%) |
| Other | 7.3% | (7.0%, 7.6%) | 8.0% | (7.1%, 9.0%) |
| Hispanic or Latino | ||||
| Yes | 2.4% | (2.2%, 2.6%) | 3.3% | (2.7%, 4.0%) |
| No | 97.6% | (97.4%, 97.8%) | 96.7% | (96.0%, 97.3%) |
| Arabic or Chaldean | ||||
| Yes | 1.6% | (1.5%, 1.8%) | 0.7% | (0.5%, 1.1%) |
| No | 98.4% | (98.2%, 98.5%) | 99.3% | (98.9%, 99.5%) |
Region of Residency & Employment among Michigan Nurses
| Region | RNs | LPNs | ||||||
|---|---|---|---|---|---|---|---|---|
| Place of Residency | Place of Employment | Place of Residency | Place of Employment | |||||
| Estimate | 95% CI | Estimate | 95% CI | Estimate | 95% CI | Estimate | 95% CI | |
| Upper Peninsula | 2.6% | (2.4%, 2.8%) | 2.5% | (2.3%, 2.7%) | 5.4% | (4.6%, 6.3%) | 5.3% | (4.5%, 6.2%) |
| Northwest LP | 3.5% | (3.3%, 3.7%) | 3.4% | (3.2%, 3.6%) | 2.4% | (1.9%, 3.0%) | 2.3% | (1.8%, 2.9%) |
| Northeast LP | 1.3% | (1.2%, 1.5%) | 1.3% | (1.2%, 1.4%) | 2.5% | (2.0%, 3.1%) | 2.3% | (1.8%, 2.9%) |
| West/West Central | 15.6% | (15.1%, 16.1%) | 14.9% | (14.5%, 15.3%) | 15.1% | (13.8%, 16.5%) | 14.3% | (13.1%, 15.6%) |
| East Central | 4.6% | (4.3%, 4.9%) | 4.6% | (4.3%, 4.9%) | 5.2% | (4.4%, 6.1%) | 5.3% | (4.5%, 6.2%) |
| East | 7.4% | (7.1%, 7.7%) | 5.9% | (5.6%, 6.2%) | 8.4% | (7.4%, 9.5%) | 6.2% | (5.4%, 7.1%) |
| South Central | 3.8% | (3.6%, 4.0%) | 3.8% | (3.6%, 4.0%) | 2.9% | (2.3%, 3.6%) | 2.9% | (2.3%, 3.6%) |
| Southwest | 6.3% | (6.0%, 6.6%) | 6.3% | (6.0%, 6.6%) | 6.3% | (5.5%, 7.3%) | 5.8% | (5.0%, 6.7%) |
| Southeast | 10.3% | (9.9%, 10.7%) | 11.4% | (11.0%, 11.8%) | 9.2% | (8.2%, 10.3%) | 9.2% | (8.2%, 10.3%) |
| Detroit Metro | 30.8% | (30.2%, 31.4%) | 28.8% | (28.2%, 29.4%) | 33.7% | (32.0%, 35.5%) | 32.8% | (31.1%, 34.5%) |
| Outside MI | 3.3% | (3.1%, 3.5%) | 6.5% | (6.2%, 6.8%) | 3.2% | (2.6%, 3.9%) | 7.9% | (7.0%, 8.9%) |
Reason Primary Place of Employment is Outside of Michigan
| Reason | RN = 2,848 | LPN = 175 | ||
|---|---|---|---|---|
| Estimate | 95% CI | Estimate | 95% CI | |
| Living out of state | 57.5% | (55.7%, 59.3%) | 60.5% | (53.1%, 67.4%) |
| Semi-retired | 1.2% | (0.9%, 1.7%) | 0.0% | (0.0%, 2.1%) |
| Taking care of home and family | 2.6% | (2.1%, 3.3%) | 10.4% | (6.7%, 15.8%) |
| School | 0.9% | (0.6%, 1.3%) | 5.2% | (2.8%, 9.6%) |
| Difficulty finding a nursing position | 2.9% | (2.3%, 3.6%) | 3.3% | (1.5%, 7.1%) |
| Scope of practice regulation is more favorable outside of Michigan | 2.7% | (2.2%, 3.4%) | 2.3% | (0.9%, 5.7%) |
| Travel nurse | 14.3% | (13.1%, 15.6%) | 19.8% | (14.6%, 26.3%) |
| Provide telehealth/call center | 11.8% | (10.7%, 13.0%) | 5.0% | (2.6%, 9.3%) |
| Employer is in another state | 21.0% | (19.5%, 22.5%) | 20.2% | (14.9%, 26.8%) |
| Military | 2.0% | (1.5%, 2.6%) | 1.4% | (0.4%, 4.5%) |
| Other (please specify) | 8.2% | (7.2%, 9.3%) | 9.7% | (6.1%, 15.0%) |
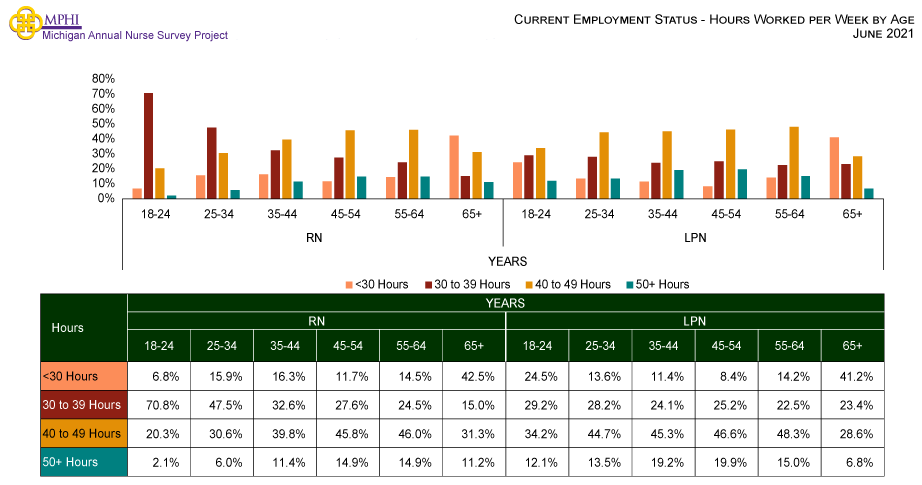
Hours Worked per Week by Age
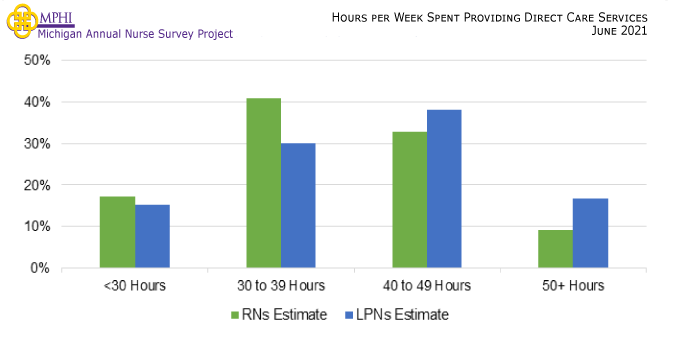
Hours Worked per Week by Direct Care Nurses
Number of Currently Employed Nursing Positions
| Number of Positions | RN = 25,375 | LPN = 3,004 | ||
|---|---|---|---|---|
| Estimate | 95% CI | Estimate | 95% CI | |
| 1 Position | 85.5% | (85.1%, 85.9%) | 85.1% | (83.8%, 86.3%) |
| 2 Position | 12.4% | (12.0%, 12.8%) | 12.7% | (11.6%, 13.9%) |
| 3+ Positions | 2.2% | (2.0%, 2.4%) | 2.3% | (1.8%, 2.9%) |
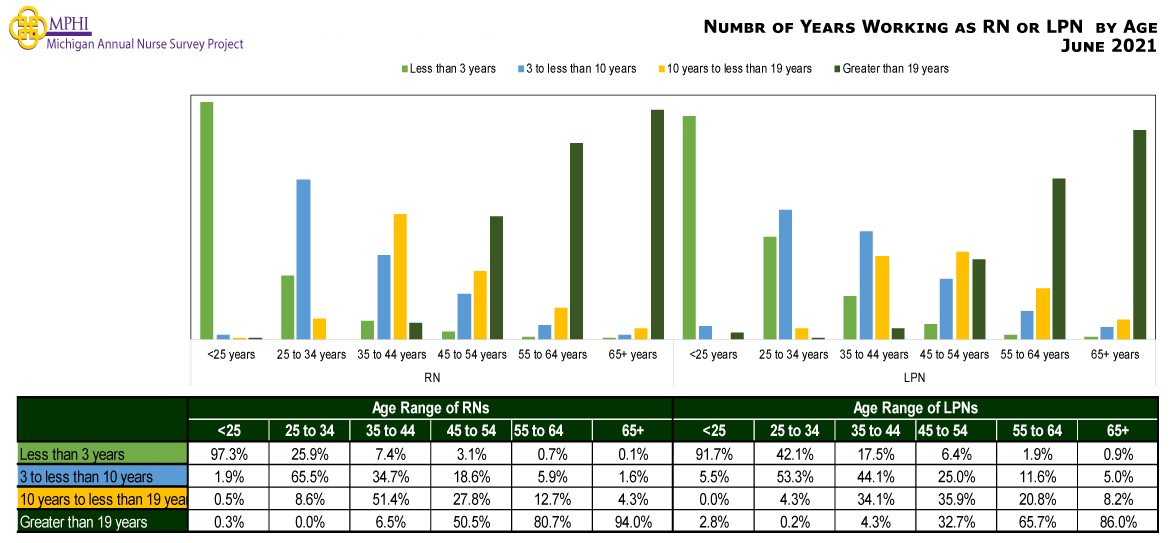
Number of Years Working as a Nurse (RN and LPN)
| Years | RN = 24,781 | LPN = 2,895 | ||
|---|---|---|---|---|
| Estimate | 95% CI | Estimate | 95% CI | |
| Less than 3 years | 11.9% | (11.5%, 12.3%) | 17.8% | (16.4%, 19.2%) |
| 3 to less than 10 years | 29.2% | (28.6%, 29.8%) | 31.4% | (29.7%, 33.1%) |
| 10 to less than 20 years | 23.6% | (23.1%, 24.1%) | 22.8% | (21.3%, 24.4%) |
| 20 or more years | 35.3% | (34.7%, 35.9%) | 28.0% | (26.4%, 29.7%) |
Number of Years Working as a Nurse Compared to Age (RN and LPN)
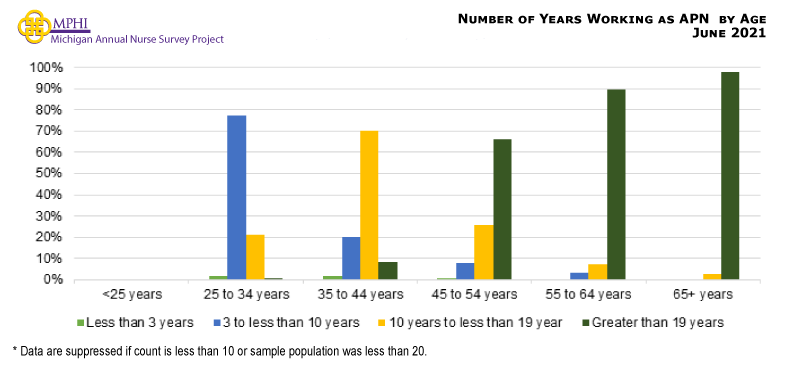
Number of Years Working as a Nurse (Completed National AP Certification only)
| Years | APRN = 2,758 | |
|---|---|---|
| Estimate | 95% CI | |
| Less than 3 years | 1.0% | (0.7%, 1.4%) |
| 3 to less than 10 years | 24.4% | (22.8%, 26.0%) |
| 10 to less than 20 years | 33.6% | (31.8%, 35.3%) |
| 20 or more years | 41.1% | (39.3%, 42.9%) |
Number of Years Working as a Nurse Compared to Age (Completed National AP Certification only)
New Nurse Experience
Preparedness for Entering Nursing Workforce
| Level of Preparedness | RN = 2,104 | LPN = 422 | ||
|---|---|---|---|---|
| Estimate | 95% CI | Estimate | 95% CI | |
| Adequately prepared | 50.5% | (48.4%, 52.6%) | 61.3% | (56.6%, 65.8%) |
| Not enough classroom time | 2.0% | (1.5%, 2.7%) | 3.6% | (2.2%, 5.8%) |
| Not enough clinical time | 33.5% | (31.5%, 35.5%) | 28.7% | (24.6%, 33.2%) |
| Not enough skills lab/simulation time | 18.1% | (16.5%, 19.8%) | 18.1% | (14.7%, 22.1%) |
| Not enough critical thinking/ prioritization practice | 21.0% | (19.3%, 22.8%) | 9.4% | (7.0%, 12.6%) |
| Other | 2.2% | (1.7%, 2.9%) | 1.0% | (0.4%, 2.5%) |
Adequate Preparedness for Entering Nursing Workforce by Region
| Region | RNs | LPNs | ||||
|---|---|---|---|---|---|---|
| N | % | 95% CI | N | % | 95% CI | |
| Upper Peninsula | 45 | 46.0% | (32.3%, 60.3%) | 11 | 26.6% | (15.9%, 41.0%) |
| Northwest LP | 83 | 61.8% | (51.0%, 71.5%) | * | * | * |
| Northeast LP | * | * | * | * | * | * |
| West/West Central | 336 | 51.4% | (46.1%, 56.7%) | 36 | 58.1% | (52.8%, 63.3%) |
| East Central | 85 | 49.0% | (38.6%, 59.4%) | * | * | * |
| East | 107 | 56.9% | (47.4%, 65.9%) | * | * | * |
| South Central | 67 | 46.8% | (35.4%, 58.6%) | * | * | * |
| Southwest | 124 | 41.5% | (33.2%, 50.3%) | 21 | 52.6% | (43.9%, 61.2%) |
| Southeast | 213 | 51.2% | (44.5%, 57.8%) | 36 | 69.2% | (62.7%, 75.0%) |
| Detroit Metro | 687 | 50.9% | (47.2%, 54.6%) | 175 | 63.7% | (60.0%, 67.2%) |
* Data are suppressed if count is less than 10 or sample population was less than 20.
Finding Employment for Nurses Entering Workforce
| RN = 2,107 | LPN = 424 | |||
|---|---|---|---|---|
| Estimate | 95% CI | Estimate | 95% CI | |
| Difficulty Finding a Nursing Position | ||||
| Very difficult | 1.5% | (1.1%, 2.1%) | 0.0% | (0.0%, 0.9%) |
| Difficult | 9.9% | (8.7%, 11.2%) | 2.5% | (1.4%, 4.5%) |
| Neutral | 27.3% | (25.4%, 29.2%) | 19.5% | (16.0%, 23.5%) |
| Easy | 34.8% | (32.8%, 36.9%) | 29.9% | (25.7%, 34.4%) |
| Very easy | 26.5% | (24.7%, 28.4%) | 48.2% | (43.5%, 53.0%) |
| Difficulty Finding a Nursing Position in Preferred Practice Area | ||||
| Very difficult | 10.2% | (9.0%, 11.6%) | 4.9% | (3.2%, 7.4%) |
| Difficult | 23.1% | (21.4%, 24.9%) | 11.9% | (9.2%, 15.3%) |
| Neutral | 30.6% | (28.7%, 32.6%) | 25.5% | (21.6%, 29.9%) |
| Easy | 24.1% | (22.3%, 26.0%) | 25.6% | (21.7%, 30.0%) |
| Very easy | 12.0% | (10.7%, 13.5%) | 32.0% | (27.7%, 36.6%) |
| Had a Residency Placement as Part of Nursing Program | ||||
| Yes | 36.6% | (34.6%, 38.7%) | 11.9% | (9.2%, 15.3%) |
| No | 63.4% | (61.3%, 65.4%) | 88.1% | (84.7%, 90.8%) |
| Satisfaction with Orientation at Place of Employment | ||||
| Very dissatisfied | 3.4% | (2.7%, 4.3%) | 8.7% | (6.4%, 11.8%) |
| Dissatisfied | 10.0% | (8.8%, 11.4%) | 13.1% | (10.2%, 16.6%) |
| Neutral | 20.8% | (19.1%, 22.6%) | 31.6% | (27.4%, 36.2%) |
| Satisfied | 48.6% | (46.5%, 50.7%) | 30.7% | (26.5%, 35.2%) |
| Very satisfied | 17.3% | (15.7%, 19.0%) | 15.8% | (12.6%, 19.6%) |
Plans to Leave Nursing
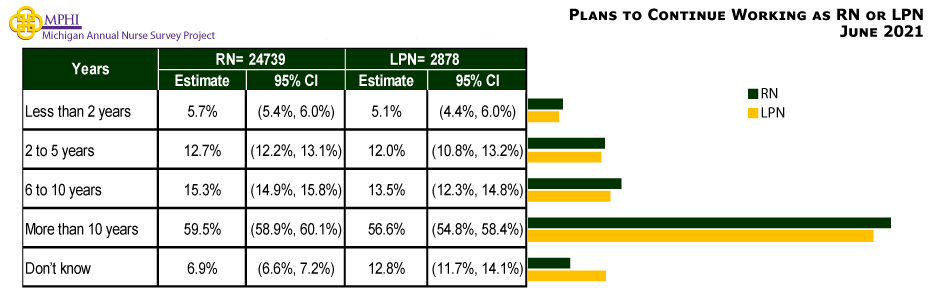
Plans to Continue Working as a Nurse (RN and LPN)
| Years | RN = 24,739 | LPN = 2,878 | ||
|---|---|---|---|---|
| Estimate | 95% CI | Estimate | 95% CI | |
| Less than 2 years | 5.7% | (5.4%, 6.0%) | 5.1% | (4.4%, 6.0%) |
| 2 to 5 years | 12.7% | (12.2%, 13.1%) | 12.0% | (10.8%, 13.2%) |
| 6 to 10 years | 15.3% | (14.9%, 15.8%) | 13.5% | (12.3%, 14.8%) |
| More than 10 years | 59.5% | (58.9%, 60.1%) | 56.6% | (54.8%, 58.4%) |
| Don’t know | 6.9% | (6.6%, 7.2%) | 12.8% | (11.7%, 14.1%) |
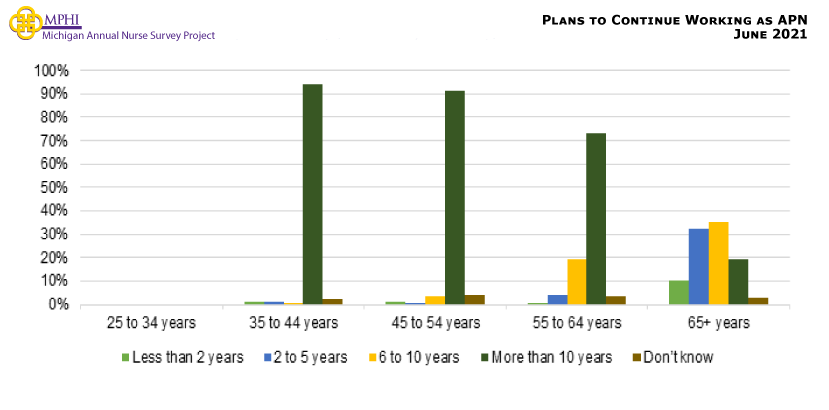
Plans to Continue to Practice Nursing (in years) by Age (RN and LPN)
Plans to Continue Working as a Nurse (Completed National AP Certification only)
| Years | APRN = 2,756 | |
|---|---|---|
| Estimate | 95% CI | |
| Less than 2 years | 4.7% | (4.0%, 5.6%) |
| 2 to 5 years | 9.9% | (8.8%, 11.1%) |
| 6 to 10 years | 13.0% | (11.8%, 14.3%) |
| More than 10 years | 68.8% | (67.0%, 70.5%) |
| Don’t know | 3.6% | (3.0%, 4.4%) |
Plans to Continue to Practice Nursing (in years) by Age (Completed National AP Certification only)
Plans to Work 5 Years or Less by Region
| Region | RNs | LPNs | ||||
|---|---|---|---|---|---|---|
| N | % | 95% CI | N | % | 95% CI | |
| Upper Peninsula | 560 | 17.6% | (14.7%, 21.0%) | 138 | 26.8% | (20.1%, 34.7%) |
| Northwest LP | 763 | 24.3% | (21.4%, 27.5%) | 67 | 35.7% | (25.3%, 47.7%) |
| Northeast LP | 295 | 19.5% | (15.4%, 24.4%) | 54 | 20.8% | (12.1%, 33.4%) |
| West/West Central | 3,153 | 17.3% | (16.0%, 18.7%) | 365 | 22.3% | (18.3%, 26.8%) |
| East Central | 1,033 | 17.6% | (15.4%, 20.0%) | 131 | 24.4% | (17.8%, 32.4%) |
| East | 1,306 | 16.8% | (14.9%, 18.9%) | 158 | 27.0% | (20.7%, 34.4%) |
| South Central | 852 | 21.3% | (18.7%, 24.2%) | 72 | 14.7% | (8.3%, 24.7%) |
| Southwest | 1,401 | 19.9% | (17.9%, 22.1%) | 139 | 18.9% | (13.3%, 26.2%) |
| Southeast | 2,523 | 19.4% | (17.9%, 21.0%) | 226 | 18.2% | (13.7%, 23.7%) |
| Detroit Metro | 6,352 | 20.9% | (19.9%, 21.9%) | 758 | 14.5% | (12.2%, 17.2%) |
| Lives in Michigan | 2,079 | 20.6% | (18.9%, 22.4%) | 234 | 21.3% | (16.5%, 27.0%) |
| Lives Outside of Michigan | 2,649 | 20.1% | (18.6%, 21.7%) | 156 | 16.3% | (11.3%, 22.9%) |
Reasons for Leaving Nursing for those Leaving Nursing in Less than 5 Years
| Reason | RN = 5,686 | LPN = 560 | ||
|---|---|---|---|---|
| Estimate | 95% CI | Estimate | 95% CI | |
| Retiring | 80.5% | (79.4%, 81.5%) | 80.0% | (76.5%, 83.1%) |
| Care for home or family | 5.3% | (4.7%, 5.9%) | 4.0% | (2.7%, 6.0%) |
| Enrolled in education program | 4.6% | (4.1%, 5.2%) | 5.1% | (3.5%, 7.2%) |
| Difficulty finding a nursing position | 0.6% | (0.5%, 0.9%) | 0.4% | (0.1%, 1.4%) |
| Too stressful/Workload | 21.9% | (20.8%, 23.0%) | 22.1% | (18.8%, 25.7%) |
| Difficulties with EMR/new technology | 1.3% | (1.1%, 1.7%) | 0.7% | (0.2%, 1.7%) |
| Violence/safety issues | 4.2% | (3.7%, 4.7%) | 3.7% | (2.4%, 5.6%) |
| Relocating/moving to another area | 3.2% | (2.8%, 3.7%) | 3.5% | (2.2%, 5.3%) |
| Other (please specify) * | 2.1% | (1.8%, 2.5%) | 1.4% | (0.7%, 2.8%) |
Employment Setting
Change in Employment Setting
| Change in Employment Setting | RN = 24,474 | LPN = 2,846 | ||
|---|---|---|---|---|
| Estimate | 95% CI | Estimate | 95% CI | |
| Did not make a change | 61.5% | (60.9%, 62.1%) | 61.2% | (59.4%, 63.0%) |
| Made a change | 38.5% | (37.9%, 39.1%) | 38.8% | (37.0%, 40.6%) |
| Of those who made a change: | ||||
| An inpatient setting to a community-based setting? | 12.9% | (12.2%, 13.6%) | 10.1% | (8.4%, 12.0%) |
| A community-based setting to an inpatient setting? | 4.2% | (3.8%, 4.6%) | 4.5% | (3.4%, 5.9%) |
| A primary care setting (e.g., family practice, general medicine) to a specialty care setting? | 4.4% | (4.0%, 4.8%) | 5.9% | (4.6%, 7.5%) |
| A specialty care setting to a primary care setting? | 2.9% | (2.6%, 3.3%) | 3.9% | (2.9%, 5.2%) |
| A sub-acute care setting to an acute care setting? | 3.5% | (3.1%, 3.9%) | 3.1% | (2.2%, 4.3%) |
| An acute care setting to a sub-acute care setting? | 3.7% | (3.3%, 4.1%) | 2.8% | (2.0%, 4.0%) |
| A direct patient care setting to a non-direct patient care setting? | 12.2% | (11.5%, 12.9%) | 8.1% | (6.6%, 9.9%) |
| A non-direct patient care setting to a direct patient care setting? | 4.1% | (3.7%, 4.5%) | 5.6% | (4.4%, 7.1%) |
| I changed locations but stayed in the same care setting. | 28.3% | (27.4%, 29.2%) | 32.1% | (29.4%, 34.9%) |
| Some other type of change in employment. | 33.3% | (32.3%, 34.3%) | 34.8% | (32.0%, 37.7%) |
Practice Setting
| Setting | RN = 25,173 | LPN = 2,975 | ||
|---|---|---|---|---|
| Estimate | 95% CI | Estimate | 95% CI | |
| Acute Care | 52.9% | (52.3%, 53.5%) | 9.7% | (8.7%, 10.8%) |
| Ambulatory Care | 14.5% | (14.1%, 14.9%) | 13.6% | (12.4%, 14.9%) |
| Ambulatory Surgery Center | 4.6% | (4.3%, 4.9%) | 1.0% | (0.7%, 1.4%) |
| Diagnostic/Testing Center | 0.5% | (0.4%, 0.6%) | 1.0% | (0.7%, 1.4%) |
| Emergent /Urgent Care Center | 3.2% | (3.0%, 3.4%) | 0.7% | (0.5%, 1.1%) |
| Nursing Home/Extended Care | 6.5% | (6.2%, 6.8%) | 50.9% | (49.1%, 52.7%) |
| Assisted Living Facility | 1.0% | (0.9%, 1.1%) | 11.0% | (9.9%, 12.2%) |
| Home Health | 5.3% | (5.0%, 5.6%) | 14.9% | (13.7%, 16.2%) |
| Hospice | 3.1% | (2.9%, 3.3%) | 4.3% | (3.6%, 5.1%) |
| Correctional Facility | 0.8% | (0.7%, 0.9%) | 3.1% | (2.5%, 3.8%) |
| Mobile Care Unit | 0.2% | (0.2%, 0.3%) | 0.2% | (0.1%, 0.4%) |
| School of Nursing | 4.0% | (3.8%, 4.2%) | 1.5% | (1.1%, 2.0%) |
| Public Health | 2.7% | (2.5%, 2.9%) | 1.9% | (1.5%, 2.5%) |
| Dialysis Center | 1.5% | (1.4%, 1.7%) | 0.6% | (0.4%, 0.9%) |
| Community Health | 2.4% | (2.2%, 2.6%) | 3.6% | (3.0%, 4.3%) |
| School Health Services K-12 | 1.2% | (1.1%, 1.3%) | 1.6% | (1.2%, 2.1%) |
| Occupational Health | 1.1% | (1.0%, 1.2%) | 1.4% | (1.0%, 1.9%) |
| Insurance Claims/Benefits | 3.1% | (2.9%, 3.3%) | 1.3% | (1.0%, 1.8%) |
| Policy/ Planning/ Regulatory/ Licensing Agency | 0.3% | (0.2%, 0.4%) | 0.2% | (0.1%, 0.4%) |
| Other Community-based Healthcare Settings | 1.7% | (1.5%, 1.9%) | 2.4% | (1.9%, 3.0%) |
| Other Community-based Service Organizations | 0.6% | (0.5%, 0.7%) | 0.5% | (0.3%, 0.8%) |
| Other Community Settings not providing direct care or social services | 1.9% | (1.7%, 2.1%) | 1.4% | (1.0%, 1.9%) |
| Other | 6.1% | (5.8%, 6.4%) | 4.1% | (3.4%, 4.9%) |
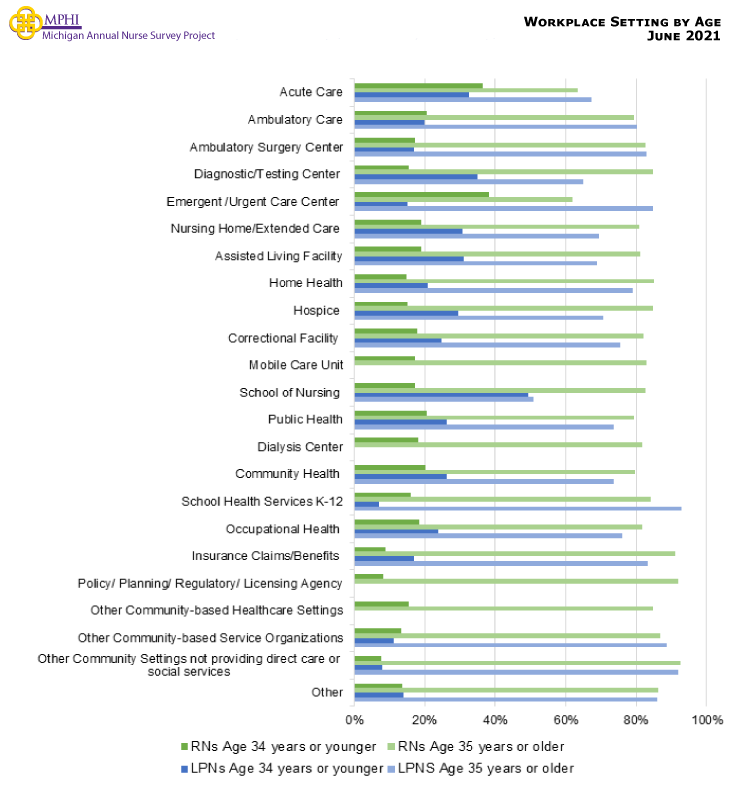
Nurses Within Settings by Age
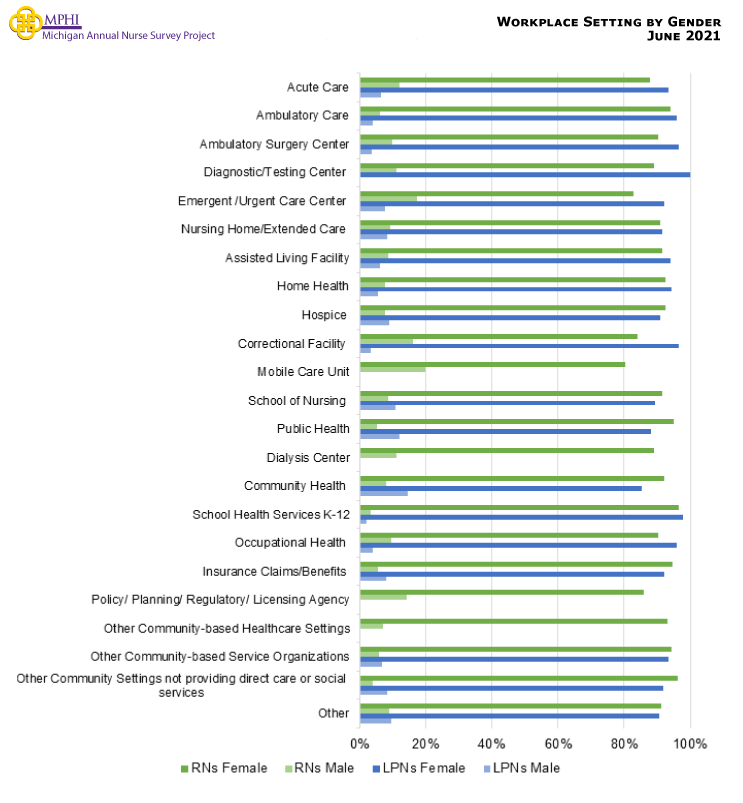
Male and Female Nurses Within Settings
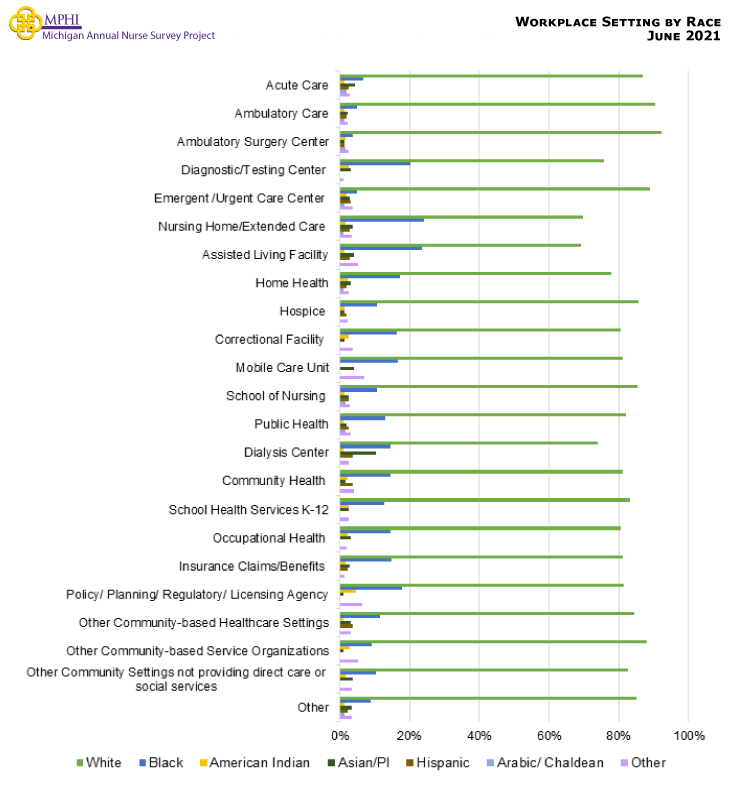
Race and Ethnicity Within Settings for All Nurses
Plans to Work 5 Years or Less by Setting
| Setting | RNs | LPNs | ||||
|---|---|---|---|---|---|---|
| N | % | 95% CI | N | % | 95% CI | |
| Acute Care | 11,371 | 15.6% | (14.9%, 16.3%) | 237 | 21.9% | (17.1%, 27.6%) |
| Ambulatory Care | 3,489 | 20.7% | (19.4%, 22.1%) | 372 | 26.6% | (22.4%, 31.3%) |
| Ambulatory Surgery Center | 1,141 | 22.7% | (20.4%, 25.2%) | 28 | 36.0% | (20.9%, 54.4%) |
| Diagnostic/Testing Center | 116 | 22.6% | (15.9%, 31.0%) | * | * | * |
| Emergent /Urgent Care Center | 683 | 10.3% | (8.2%, 12.8%) | * | * | * |
| Nursing Home/Extended Care | 1,482 | 15.9% | (14.1%, 17.8%) | 1,201 | 14.9% | (13.0%, 17.0%) |
| Assisted Living Facility | 240 | 22.5% | (17.7%, 28.2%) | 268 | 17.7% | (13.6%, 22.7%) |
| Home Health | 1,297 | 19.6% | (17.5%, 21.8%) | 366 | 19.6% | (15.9%, 24.0%) |
| Hospice | 748 | 19.5% | (16.8%, 22.5%) | 104 | 14.1% | (8.7%, 22.1%) |
| Correctional Facility | 189 | 17.3% | (12.6%, 23.3%) | 79 | 13.9% | (7.9%, 23.2%) |
| Mobile Care Unit | * | * | * | * | * | * |
| School of Nursing | 1,002 | 24.0% | (21.5%, 26.7%) | * | * | * |
| Public Health | 668 | 27.6% | (24.3%, 31.1%) | * | * | * |
| Dialysis Center | 337 | 12.0% | (9.0%, 15.9%) | * | * | * |
| Community Health | 602 | 24.8% | (21.5%, 28.4%) | 92 | 17.5% | (11.1%, 26.5%) |
| School Health Services K-12 | 288 | 22.1% | (17.7%, 27.2%) | * | * | * |
| Occupational Health | 293 | 24.3% | (19.7%, 29.5%) | * | * | * |
| Insurance Claims/Benefits | 795 | 23.9% | (21.1%, 27.0%) | * | * | * |
| Policy/ Planning/ Regulatory/ Licensing Agency | 81 | 29.1% | (20.3%, 39.8%) | * | * | * |
| Other Community-based Healthcare Settings | 419 | 24.1% | (20.3%, 28.4%) | 61 | 28.9% | (19.0%, 41.3%) |
| Other Community-based Service Organizations | 168 | 34.4% | (27.6%, 41.9%) | * | * | * |
| Other Community Settings not providing direct care or social services | 466 | 24.1% | (20.4%, 28.2%) | * | * | * |
| Other | 1,526 | 28.0% | (25.8%, 30.3%) | 107 | 30.2% | (22.3%, 39.5%) |
* Data are suppressed if count is less than 10 or sample population was less than 20.
Position and Role
| Position | RN = 21,669 | LPN = 2,584 | ||
|---|---|---|---|---|
| Estimate | 95% CI | Estimate | 95% CI | |
| Staff Nurse | 63.3% | (62.7%, 63.9%) | 75.7% | (74.1%, 77.2%) |
| Nurse Manager/Supervisor | 8.4% | (8.1%, 8.7%) | 14.4% | (13.2%, 15.7%) |
| Nurse Executive/Administrator | 4.5% | (4.3%, 4.8%) | 2.8% | (2.3%, 3.5%) |
| Nurse Consultant | 2.2% | (2.0%, 2.4%) | 1.0% | (0.7%, 1.4%) |
| Nurse Secondary Educator | 0.7% | (0.6%, 0.8%) | 0.4% | (0.2%, 0.7%) |
| Nurse Post-Secondary Educator | 3.0% | (2.8%, 3.2%) | 0.3% | (0.2%, 0.6%) |
| Professional Nurse Training | 1.8% | (1.6%, 2.0%) | 0.8% | (0.5%, 1.2%) |
| Patient Educator | 3.2% | (3.0%, 3.4%) | 3.2% | (2.6%, 3.9%) |
| School Health Nurse K-12 | 1.0% | (0.9%, 1.1%) | 1.7% | (1.3%, 2.2%) |
| Advanced Practice Registered Nurse | 8.3% | (8.0%, 8.6%) | 0.0% | (0.0%, 0.1%) |
| Faith-based Nurse | 0.3% | (0.2%, 0.4%) | 0.7% | (0.5%, 1.1%) |
| Case Manager/Coordinator/Navigator | 10.6% | (10.2%, 11.0%) | 4.5% | (3.8%, 5.3%) |
| Nurse Researcher | 0.7% | (0.6%, 0.8%) | 0.0% | (0.0%, 0.1%) |
| Reserve and Active Military | 0.2% | (0.2%, 0.3%) | 0.0% | (0.0%, 0.1%) |
| Non-military, work in Military setting | 0.2% | (0.2%, 0.3%) | 0.6% | (0.4%, 0.9%) |
| Telehealth | 3.0% | (2.8%, 3.2%) | 2.2% | (1.7%, 2.8%) |
| Other Health Related | 4.1% | (3.9%, 4.4%) | 6.5% | (5.7%, 7.4%) |
| Other Health Non-related | 0.2% | (0.2%, 0.3%) | 0.3% | (0.2%, 0.6%) |
| Other | 2.3% | (2.1%, 2.5%) | 2.8% | (2.3%, 3.5%) |
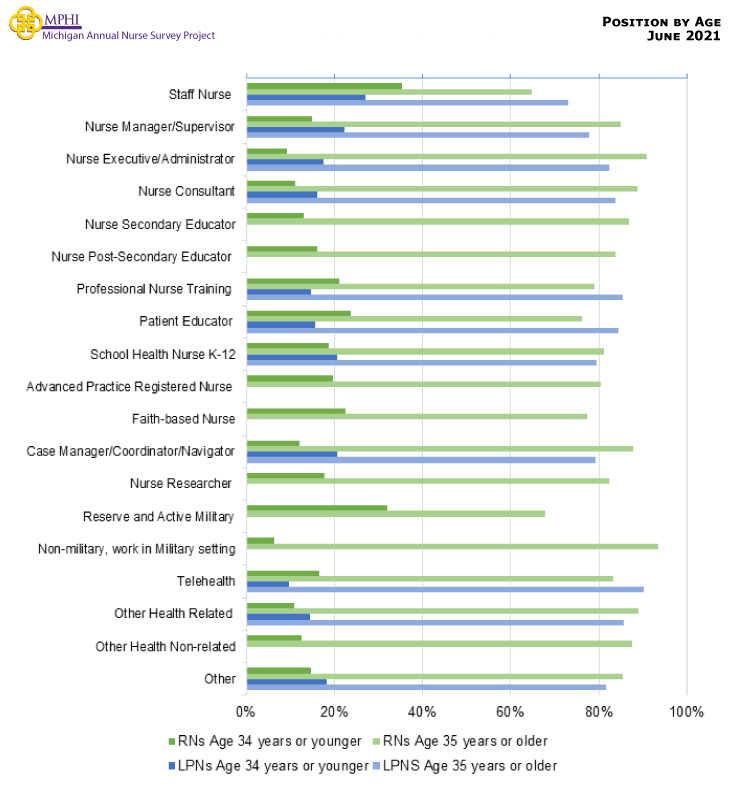
Nurses Within Positions by Age
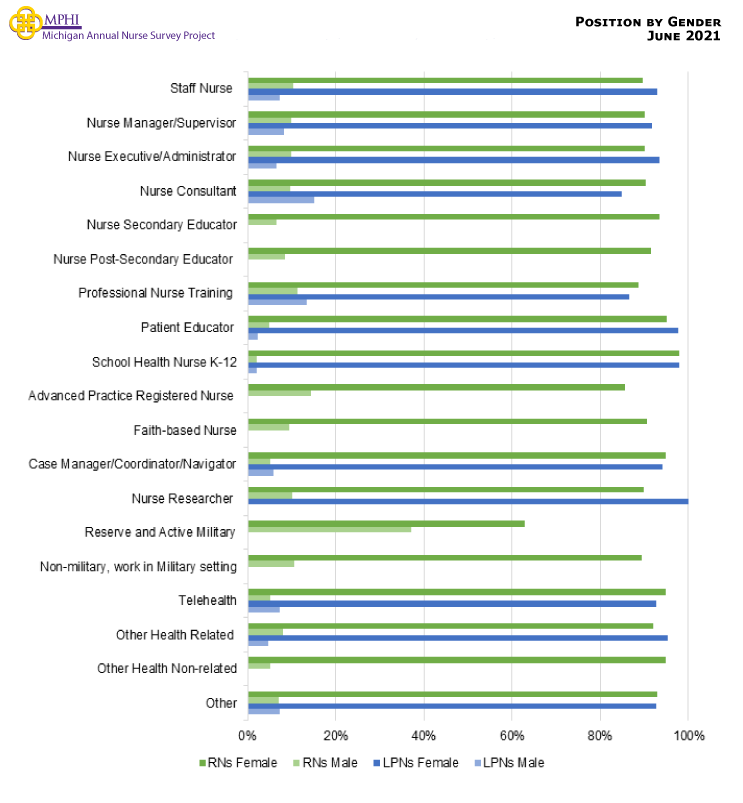
Male and Female Nurses Within Positions
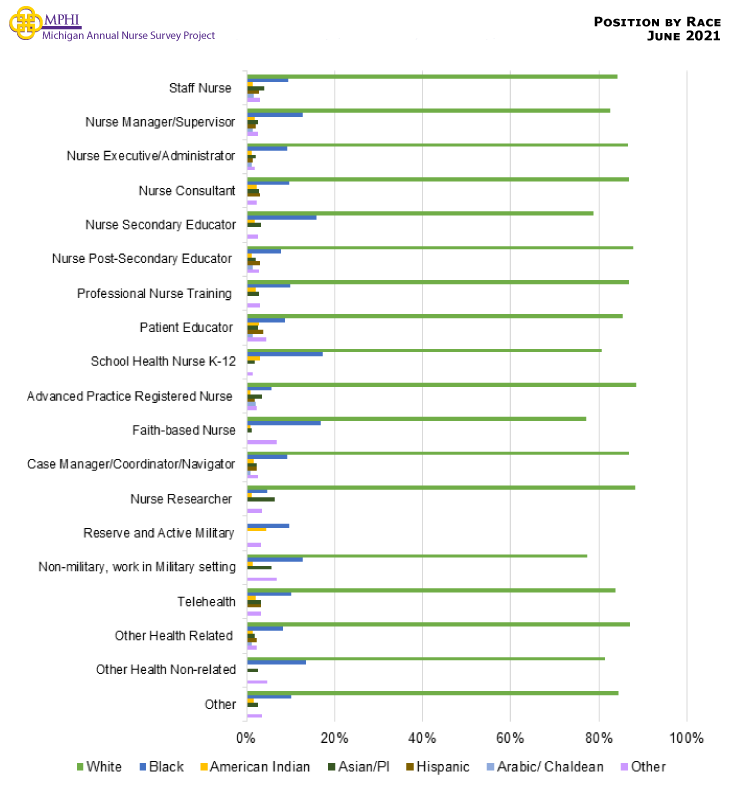
Race and Ethnicity Within Positions for All Nurses
Plans to Work 5 Years or Less by Position
| Position | RNs | LPNs | ||||
|---|---|---|---|---|---|---|
| N | % | 95% CI | N | % | 95% CI | |
| Staff Nurse | 13,576 | 17.0% | (16.4%, 17.6%) | 1,847 | 17.9% | (16.2%, 19.7%) |
| Nurse Manager/Supervisor | 1,979 | 17.6% | (16.0%, 19.3%) | 365 | 13.9% | (10.7%, 17.8%) |
| Nurse Executive/Administrator | 1,154 | 23.7% | (21.3%, 26.2%) | 73 | 22.6% | (14.5%, 33.4%) |
| Nurse Consultant | 588 | 26.6% | (23.2%, 30.3%) | * | * | * |
| Nurse Secondary Educator | 176 | 24.9% | (19.1%, 31.8%) | * | * | * |
| Nurse Post-Secondary Educator | 783 | 25.3% | (22.4%, 28.5%) | * | * | * |
| Professional Nurse Training | 424 | 20.5% | (16.9%, 24.6%) | * | * | * |
| Patient Educator | 744 | 21.2% | (18.4%, 24.3%) | 82 | 15.7% | (9.4%, 25.1%) |
| School Health Nurse K-12 | 230 | 22.1% | (17.2%, 27.9%) | 46 | 19.2% | (10.4%, 32.8%) |
| Advanced Practice Registered Nurse | 2,236 | 14.6% | (13.2%, 16.1%) | * | * | * |
| Faith-based Nurse | 74 | 39.1% | (28.8%, 50.5%) | * | * | * |
| Case Manager/Coordinator/Navigator | 2,588 | 21.8% | (20.3%, 23.4%) | 109 | 20.5% | (14.0%, 29.0%) |
| Nurse Researcher | 176 | 26.8% | (20.8%, 33.8%) | * | * | * |
| Reserve and Active Military | * | * | * | * | * | * |
| Non-military, work in Military setting | 58 | 18.6% | (10.7%, 30.4%) | * | * | * |
| Telehealth | 730 | 21.5% | (18.7%, 24.6%) | 65 | 22.9% | (14.4%, 34.5%) |
| Other Health Related | 1,037 | 34.0% | (31.2%, 36.9%) | 173 | 33.2% | (26.6%, 40.5%) |
| Other Health Non-related | 59 | 25.7% | (16.3%, 38.1%) | * | * | * |
| Other | 575 | 24.4% | (21.1%, 28.1%) | 74 | 28.4% | (19.4%, 39.5%) |
* Data are suppressed if count is less than 10 or sample population was less than 20.
Faith-Based Nurses
| RN = 93 | LPN = 20 | |||
|---|---|---|---|---|
| Estimate | 95% CI | Estimate | 95% CI | |
| Paid Faith-Based Position | ||||
| Yes | 45.1% | (35.4%, 55.2%) | 56.2% | (35.3%, 75.1%) |
| Please identify any of the following activities you perform as part of your faith-based nurse role (Mark ALL that apply). | ||||
| Home visits | 21.1% | (14.0%, 30.5%) | 26.4% | (12.1%, 48.3%) |
| One-on-one teaching | 44.9% | (35.2%, 55.0%) | 48.8% | (28.9%, 69.1%) |
| Offering community health professional guest speakers, health education or support groups | 46.4% | (36.6%, 56.5%) | 13.2% | (4.3%, 34.0%) |
| Discharge planning or care transition follow-up | 25.1% | (17.4%, 34.8%) | 14.0% | (4.7%, 34.9%) |
| Provision of health screenings | 34.3% | (25.4%, 44.4%) | 9.0% | (2.4%, 28.9%) |
| Work at a faith-based setting | 51.7% | (41.7%, 61.6%) | 50.4% | (30.3%, 70.4%) |
| Working on the phone or computer out of your home | 36.1% | (27.1%, 46.2%) | 20.5% | (8.4%, 42.1%) |
| Coordination of health fairs or large screening events provided by other professionals | 27.4% | (19.4%, 37.2%) | 14.0% | (4.7%, 34.9%) |
| Other | 20.1% | (13.2%, 29.4%) | 25.4% | (11.4%, 47.3%) |
School-Based Nurses
| RN = 264 | LPN = 60 | |||
|---|---|---|---|---|
| Estimate | 95% CI | Estimate | 95% CI | |
| Do you work in any of these settings in your role as a school health nurse K-12? | ||||
| General education | 72.6% | (66.9%, 77.6%) | 65.3% | (52.7%, 76.1%) |
| Special education | 65.9% | (60.0%, 71.4%) | 45.6% | (33.6%, 58.1%) |
| None of these | 7.5% | (4.9%, 11.3%) | 16.0% | (8.8%, 27.3%) |
| Do you have a Michigan Department of Education (MDE) school nurse certification? | ||||
| Yes | 22.6% | (18.0%, 28.0%) | 9.5% | (4.3%, 19.5%) |
| No | 71.0% | (65.3%, 76.1%) | 75.6% | (63.4%, 84.7%) |
| Unsure | 6.4% | (4.0%, 10.0%) | 14.9% | (8.0%, 26.0%) |
Specialties
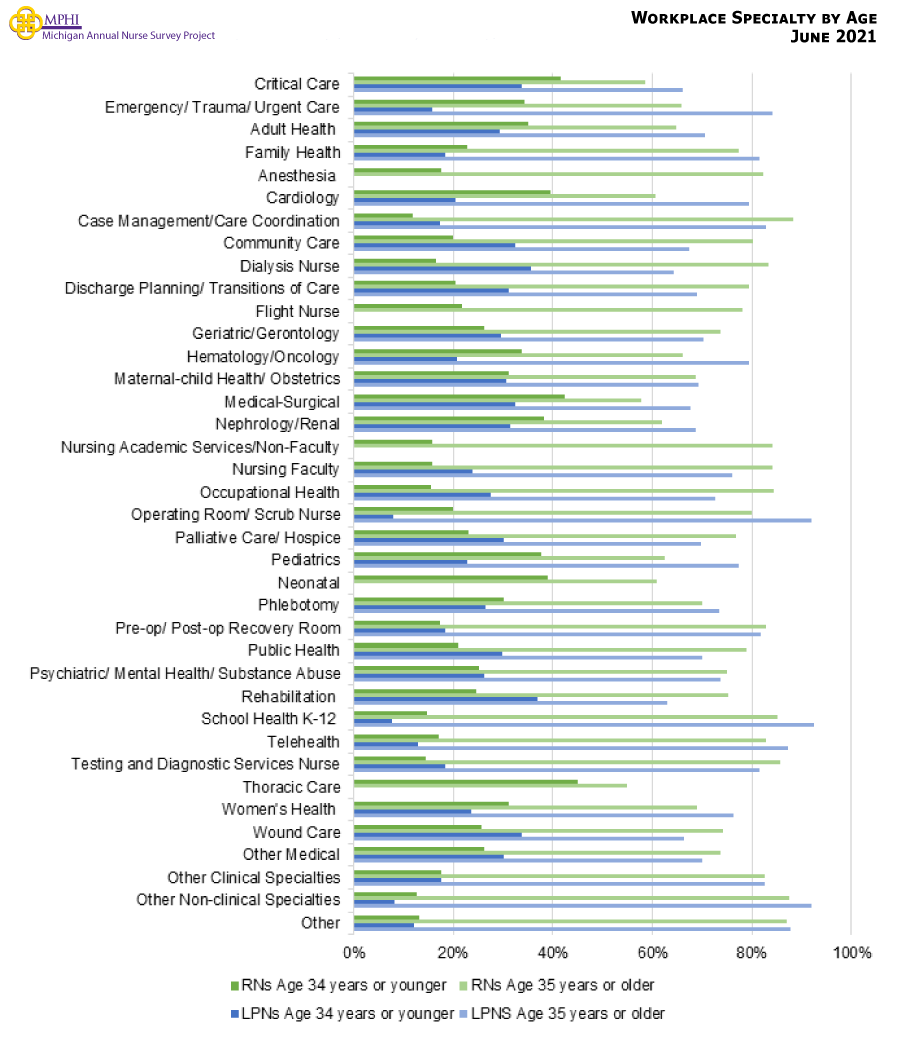
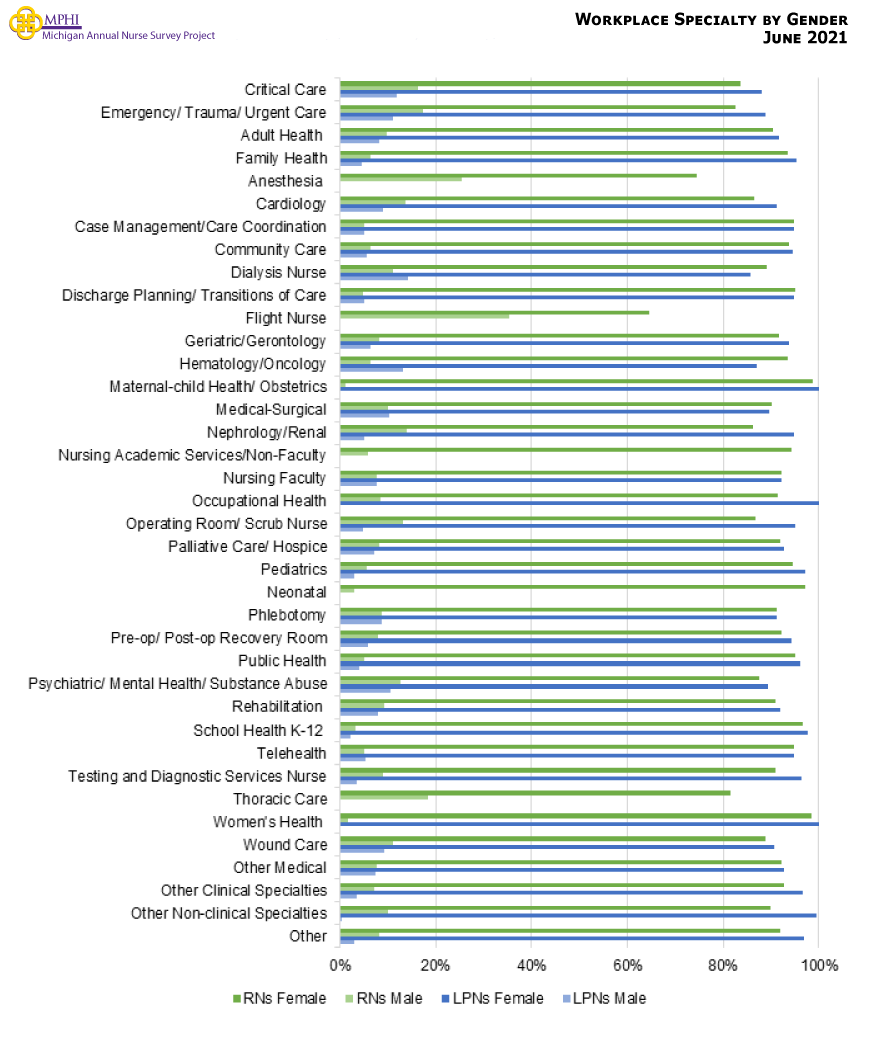
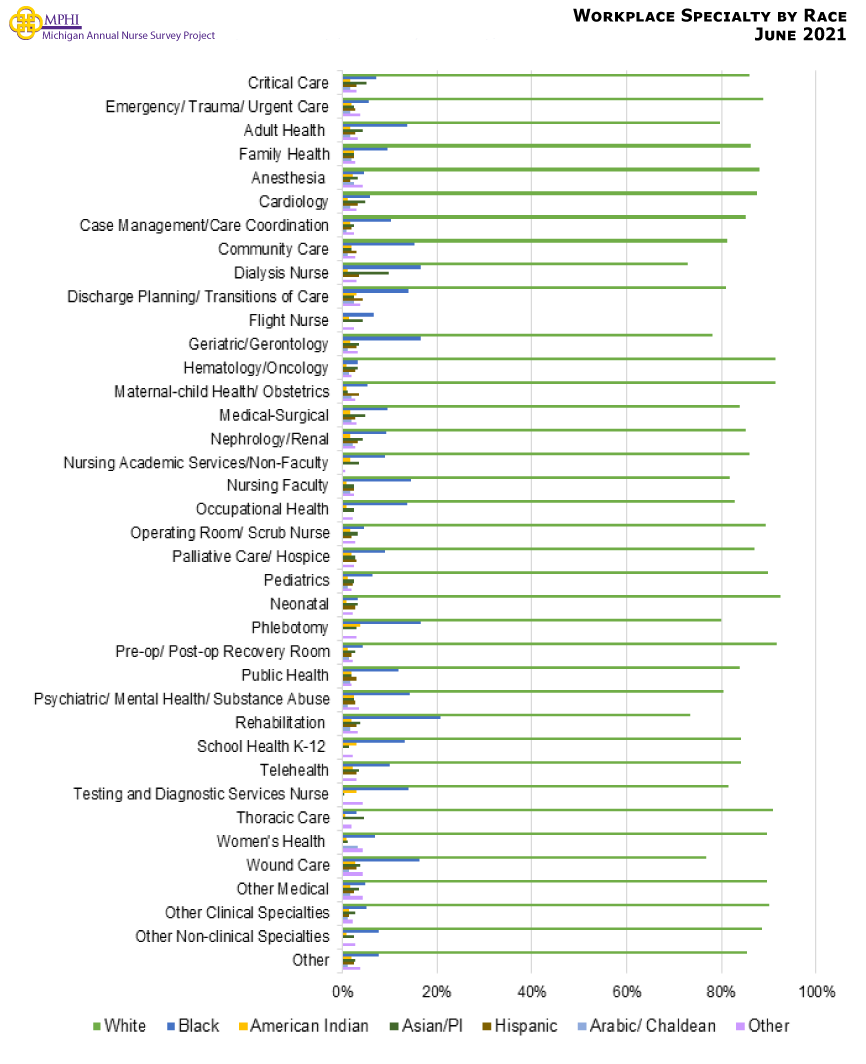
| Specialty | RN = 25,173 | LPN = 2,975 | ||
|---|---|---|---|---|
| % | 95% CI | % | 95% CI | |
| Critical Care | 16.1% | (15.7%, 16.6%) | 3.3% | (2.7%, 4.0%) |
| Emergency/ Trauma/ Urgent Care | 9.9% | (9.5%, 10.3%) | 2.1% | (1.6%, 2.7%) |
| Adult Health | 20.3% | (19.8%, 20.8%) | 39.3% | (37.6%, 41.1%) |
| Family Health | 5.4% | (5.1%, 5.7%) | 9.4% | (8.4%, 10.5%) |
| Anesthesia | 2.6% | (2.4%, 2.8%) | 0.3% | (0.2%, 0.6%) |
| Cardiology | 8.8% | (8.5%, 9.2%) | 1.9% | (1.5%, 2.5%) |
| Case Management/Care Coordination | 9.4% | (9.0%, 9.8%) | 4.4% | (3.7%, 5.2%) |
| Community Care | 3.9% | (3.7%, 4.1%) | 6.1% | (5.3%, 7.0%) |
| Dialysis Nurse | 1.8% | (1.6%, 2.0%) | 1.2% | (0.9%, 1.7%) |
| Discharge Planning/ Transitions of Care | 2.1% | (1.9%, 2.3%) | 2.8% | (2.3%, 3.5%) |
| Flight Nurse | 0.2% | (0.2%, 0.3%) | 0.1% | (0.0%, 0.3%) |
| Geriatric/Gerontology | 9.4% | (9.0%, 9.8%) | 39.3% | (37.6%, 41.1%) |
| Hematology/Oncology | 4.3% | (4.1%, 4.6%) | 1.1% | (0.8%, 1.5%) |
| Maternal-child Health/ Obstetrics | 5.9% | (5.6%, 6.2%) | 1.1% | (0.8%, 1.5%) |
| Medical-Surgical | 16.4% | (15.9%, 16.9%) | 5.6% | (4.8%, 6.5%) |
| Nephrology/Renal | 2.7% | (2.5%, 2.9%) | 1.4% | (1.0%, 1.9%) |
| Nursing Academic Services/Non-Faculty | 0.7% | (0.6%, 0.8%) | 0.3% | (0.2%, 0.6%) |
| Nursing Faculty | 3.0% | (2.8%, 3.2%) | 2.9% | (2.4%, 3.6%) |
| Occupational Health | 1.2% | (1.1%, 1.3%) | 1.2% | (0.9%, 1.7%) |
| Operating Room/ Scrub Nurse | 4.6% | (4.3%, 4.9%) | 0.7% | (0.5%, 1.1%) |
| Palliative Care/ Hospice | 3.9% | (3.7%, 4.1%) | 6.3% | (5.5%, 7.2%) |
| Pediatrics | 5.6% | (5.3%, 5.9%) | 5.9% | (5.1%, 6.8%) |
| Neonatal | 2.3% | (2.1%, 2.5%) | 0.2% | (0.1%, 0.4%) |
| Phlebotomy | 0.8% | (0.7%, 0.9%) | 2.6% | (2.1%, 3.2%) |
| Pre-op/ Post-op Recovery Room | 6.4% | (6.1%, 6.7%) | 1.2% | (0.9%, 1.7%) |
| Public Health | 4.0% | (3.8%, 4.2%) | 3.3% | (2.7%, 4.0%) |
| Psychiatric/ Mental Health/ Substance Abuse | 5.4% | (5.1%, 5.7%) | 6.7% | (5.9%, 7.7%) |
| Rehabilitation | 4.3% | (4.1%, 4.6%) | 17.7% | (16.4%, 19.1%) |
| School Health K-12 | 1.2% | (1.1%, 1.3%) | 1.5% | (1.1%, 2.0%) |
| Telehealth | 3.5% | (3.3%, 3.7%) | 2.5% | (2.0%, 3.1%) |
| Testing and Diagnostic Services Nurse | 0.5% | (0.4%, 0.6%) | 0.9% | (0.6%, 1.3%) |
| Thoracic Care | 1.7% | (1.5%, 1.9%) | 0.1% | (0.0%, 0.3%) |
| Women’s Health | 2.2% | (2.0%, 2.4%) | 1.2% | (0.9%, 1.7%) |
| Wound Care | 3.7% | (3.5%, 3.9%) | 12.8% | (11.6%, 14.0%) |
| Other Medical | 2.6% | (2.4%, 2.8%) | 3.6% | (3.0%, 4.3%) |
| Other Clinical Specialties | 4.5% | (4.3%, 4.8%) | 4.4% | (3.7%, 5.2%) |
| Other Non-clinical Specialties | 2.2% | (2.0%, 2.4%) | 1.4% | (1.0%, 1.9%) |
| Other | 3.8% | (3.6%, 4.0%) | 3.4% | (2.8%, 4.1%) |
Nurses Within Specialties by Age
Male and Female Nurses Within Specialties
Race and Ethnicity Within Specialties for All Nurses
Plans to Work 5 Years or Less Within Each Specialty
| Specialty | RNs | LPNs | ||||
|---|---|---|---|---|---|---|
| N | % | 95% CI | N | % | 95% CI | |
| Critical Care | 3,308 | 15.7% | (14.5%, 17.0%) | 74 | 19.4% | (12.0%, 29.8%) |
| Emergency/ Trauma/ Urgent Care | 2,153 | 12.6% | (11.3%, 14.1%) | 50 | 19.2% | (10.6%, 32.1%) |
| Adult Health | 4,409 | 15.0% | (14.0%, 16.1%) | 941 | 16.4% | (14.2%, 18.9%) |
| Family Health | 1,295 | 15.6% | (13.7%, 17.7%) | 252 | 25.1% | (20.1%, 30.8%) |
| Anesthesia | 660 | 18.2% | (15.4%, 21.3%) | * | * | * |
| Cardiology | 1,857 | 14.2% | (12.7%, 15.9%) | 46 | 26.3% | (15.8%, 40.5%) |
| Case Management/Care Coordination | 2,305 | 22.4% | (20.7%, 24.1%) | 115 | 19.0% | (12.9%, 27.1%) |
| Community Care | 963 | 23.3% | (20.7%, 26.1%) | 144 | 17.1% | (11.8%, 24.1%) |
| Dialysis Nurse | 423 | 12.3% | (9.5%, 15.8%) | * | * | * |
| Discharge Planning/ Transitions of Care | 511 | 17.1% | (14.1%, 20.6%) | * | * | * |
| Flight Nurse | * | * | * | * | * | * |
| Geriatric/Gerontology | 2,085 | 15.9% | (14.4%, 17.5%) | 942 | 14.0% | (11.9%, 16.4%) |
| Hematology/Oncology | 951 | 17.3% | (15.0%, 19.8%) | 29 | * | * |
| Maternal-child Health/ Obstetrics | 1,299 | 16.2% | (14.3%, 18.3%) | 32 | * | * |
| Medical-Surgical | 3,349 | 12.8% | (11.7%, 14.0%) | 133 | 18.0% | (12.4%, 25.4%) |
| Nephrology/Renal | 565 | 12.5% | (10.0%, 15.5%) | * | * | * |
| Nursing Academic Services/Non-Faculty | 177 | 22.6% | (17.1%, 29.3%) | * | * | * |
| Nursing Faculty | 783 | 25.4% | (22.5%, 28.6%) | 72 | 17.5% | (10.4%, 27.9%) |
| Occupational Health | 308 | 24.9% | (20.4%, 30.0%) | * | * | * |
| Operating Room/ Scrub Nurse | 1,106 | 21.4% | (19.1%, 23.9%) | * | * | * |
| Palliative Care/ Hospice | 899 | 17.5% | (15.2%, 20.1%) | 148 | 9.8% | (6.0%, 15.7%) |
| Pediatrics | 1,201 | 15.5% | (13.6%, 17.7%) | 147 | 24.1% | (17.9%, 31.6%) |
| Neonatal | 511 | 19.0% | (15.8%, 22.6%) | * | * | * |
| Phlebotomy | 177 | 19.8% | (14.6%, 26.3%) | 62 | 20.2% | (12.1%, 31.8%) |
| Pre-op/ Post-op Recovery Room | 1,536 | 21.5% | (19.5%, 23.6%) | * | * | * |
| Public Health | 966 | 26.5% | (23.8%, 29.4%) | 76 | 13.5% | (7.6%, 23.0%) |
| Psychiatric/ Mental Health/ Substance Abuse | 1,290 | 18.7% | (16.7%, 20.9%) | 149 | 17.0% | (11.8%, 23.8%) |
| Rehabilitation | 953 | 14.9% | (12.8%, 17.3%) | 402 | 12.8% | (9.9%, 16.4%) |
| School Health K-12 | 281 | 25.6% | (20.9%, 31.0%) | 43 | * | * |
| Telehealth | 860 | 20.7% | (18.1%, 23.5%) | 74 | 22.1% | (14.2%, 32.8%) |
| Testing and Diagnostic Services Nurse | 131 | 24.6% | (18.0%, 32.6%) | * | * | * |
| Thoracic Care | 341 | 14.7% | (11.3%, 18.9%) | * | * | * |
| Women’s Health | 500 | 17.1% | (14.1%, 20.6%) | * | * | * |
| Wound Care | 826 | 12.0% | (10.0%, 14.4%) | 295 | 13.9% | (10.4%, 18.3%) |
| Other Medical | 592 | 16.7% | (13.9%, 19.9%) | 90 | 18.0% | (11.4%, 27.2%) |
| Other Clinical Specialties | 1,106 | 23.2% | (20.8%, 25.8%) | 117 | 31.0% | (23.3%, 39.9%) |
| Other Non-clinical Specialties | 553 | 24.7% | (21.3%, 28.5%) | * | * | * |
| Other | 958 | 29.8% | (27.0%, 32.8%) | 85 | 33.7% | (24.6%, 44.3%) |
* Data are suppressed if count is less than 10 or sample population was less than 20.
Workplace Violence
Demographics of those Nurses who Experienced Workplace Violence in the Past Year, 2021
| Characteristics | RNs | LPNs |
|---|---|---|
| Total | 34.2% | 23.6% |
| Age | ||
| <25 years | 48.8% | 44.5% |
| 25 to 34 years | 45.9% | 24.9% |
| 35 to 44 years | 37.6% | 25.9% |
| 45 to 54 years | 29.7% | 22.1% |
| 55 to 64 years | 24.9% | 22.0% |
| 65+ years | 15.2% | 12.2% |
| Gender | ||
| Female | 33.5% | 23.5% |
| Male | 41.1% | 25.3% |
| Ethnicity | ||
| Hispanic or Latino | 40.5% | 23.4% |
| Arabic or Chaldean | 31.7% | * |
| Race | ||
| White | 35.1% | 27.6% |
| Black | 24.6% | 14.7% |
| American Indian | 43.6% | 35.2% |
| Asian/ Pacific Islander | 28.8% | 17.7% |
| Other | 43.3% | 31.3% |
| Employment Region | ||
| Eastern/Central/Western UP | 39.0% | 24.6% |
| Northwest LP | 34.8% | 25.7% |
| Northeast LP | 33.5% | 33.0% |
| West/West Central | 36.9% | 24.2% |
| East Central | 34.7% | 31.9% |
| East | 37.3% | 31.5% |
| South Central | 40.5% | 36.5% |
| Southwest | 42.7% | 27.7% |
| Southeast | 34.5% | 24.4% |
| Detroit Metro | 32.7% | 17.7% |
| Outside of MI | 22.7% | 21.0% |
| Unknown MI Region | 34.1% | 23.7% |
| Region of Residence | ||
| Upper Peninsula | 37.4% | 24.5% |
| Northwest LP | 34.8% | 26.7% |
| Northeast LP | 32.4% | 31.3% |
| West/West Central | 37.1% | 24.1% |
| East Central | 34.6% | 30.5% |
| East | 37.3% | 33.4% |
| South Central | 42.6% | 35.6% |
| Southwest | 41.7% | 30.3% |
| Southeast | 34.0% | 23.7% |
| Detroit Metro | 32.8% | 17.5% |
| Non-Michigan Residence | 22.7% | 21.0% |
| Unknown MI Region | 37.9% | 19.4% |
| Practicing as a Nurse | ||
| Less than 3 years | 47.3% | 24.9% |
| 3 to less than 10 years | 43.5% | 23.7% |
| 10 years to less than 19 year | 33.1% | 25.9% |
| Greater than 19 years | 22.8% | 20.5% |
Demographics of those Nurses who Experienced Workplace Violence, 2020-2021
| Characteristics | 2020 | 2021 | ||
|---|---|---|---|---|
| RNs | LPNs | RNs | LPNs | |
| Total | 35.6% | 25.1% | 34.2% | 23.6% |
| Age | ||||
| <25 years | 53.9% | 23.9% | 48.8% | 44.5% |
| 25 to 34 years | 46.5% | 25.1% | 45.9% | 24.9% |
| 35 to 44 years | 38.0% | 27.8% | 37.6% | 25.9% |
| 45 to 54 years | 32.1% | 23.0% | 29.7% | 22.1% |
| 55 to 64 years | 27.6% | 28.0% | 24.9% | 22.0% |
| 65+ years | 17.5% | 14.5% | 15.2% | 12.2% |
| Gender | ||||
| Female | 34.9% | 24.8% | 33.5% | 23.5% |
| Male | 42.4% | 27.9% | 41.1% | 25.3% |
| Ethnicity | ||||
| Hispanic or Latino | 38.8% | 26.6% | 40.5% | 23.4% |
| Arabic or Chaldean | 37.1% | 29.0% | 31.7% | * |
| Race | ||||
| White | 36.6% | 27.7% | 35.1% | 27.6% |
| Black | 26.5% | 19.9% | 24.6% | 14.7% |
| American Indian | 44.8% | 19.4% | 43.6% | 35.2% |
| Asian/ Pacific Islander | 27.8% | 20.9% | 28.8% | 17.7% |
| Other | 39.0% | 25.2% | 43.3% | 31.3% |
| Employment Region | ||||
| Eastern/Central/Western UP | 35.1% | 27.0% | 39.0% | 24.6% |
| Northwest LP | 37.4% | 21.7% | 34.8% | 25.7% |
| Northeast LP | 35.3% | 24.6% | 33.5% | 33.0% |
| West/West Central | 38.4% | 27.5% | 36.9% | 24.2% |
| East Central | 38.8% | 34.0% | 34.7% | 31.9% |
| East | 39.9% | 29.9% | 37.3% | 31.5% |
| South Central | 41.8% | 33.8% | 40.5% | 36.5% |
| Southwest | 41.9% | 30.7% | 42.7% | 27.7% |
| Southeast | 34.3% | 25.8% | 34.5% | 24.4% |
| Detroit Metro | 35.4% | 21.1% | 32.7% | 17.7% |
| Outside of MI | 24.1% | 19.5% | 22.7% | 21.0% |
| Unknown MI Region | 37.1% | 19.8% | 34.1% | 23.7% |
| Region of Residence | ||||
| Upper Peninsula | 33.7% | 26.7% | 37.4% | 24.5% |
| Northwest LP | 37.7% | 19.1% | 34.8% | 26.7% |
| Northeast LP | 34.4% | 22.9% | 32.4% | 31.3% |
| West/West Central | 38.9% | 27.7% | 37.1% | 24.1% |
| East Central | 39.9% | 31.1% | 34.6% | 30.5% |
| East | 39.3% | 33.7% | 37.3% | 33.4% |
| South Central | 41.1% | 33.6% | 42.6% | 35.6% |
| Southwest | 40.2% | 29.2% | 41.7% | 30.3% |
| Southeast | 35.2% | 26.1% | 34.0% | 23.7% |
| Detroit Metro | 34.9% | 20.4% | 32.8% | 17.5% |
| Non-Michigan Residence | 24.6% | 21.1% | 22.7% | 21.0% |
| Unknown MI Region | 40.5% | 21.2% | 37.9% | 19.4% |
| Practicing as a Nurse | ||||
| Less than 3 years | 50.1% | 22.3% | 47.3% | 24.9% |
| 3 to less than 10 years | 43.4% | 26.7% | 43.5% | 23.7% |
| 10 years to less than 19 year | 34.2% | 26.4% | 33.1% | 25.9% |
| Greater than 19 years | 25.2% | 23.4% | 22.8% | 20.5% |
* Data are suppressed if count is less than 10 or sample population was less than 20.
Nurses who Experienced Workplace Violence by Care Setting, 2021 (top settings in descending order by RNs)
| Setting | RN = 25,472 | LPN = 3,032 | ||
|---|---|---|---|---|
| n | Estimate | n | Estimate | |
| Emergent /Urgent Care Center | 11,701 | 59% | * | * |
| Correctional Facility | 3,580 | 54% | 378 | 34% |
| Acute Care | 1,162 | 45% | 29 | 26% |
| Nursing Home/Extended Care | 125 | 32% | 25 | 28% |
| Community Health | 710 | 31% | 19 | 23% |
| Dialysis Center | 1,532 | 30% | * | * |
| School of Nursing | 243 | 30% | 288 | 18% |
| Public Health | 1,342 | 29% | 414 | 24% |
| Assisted Living Facility | 773 | 28% | 114 | 27% |
| Diagnostic/Testing Center | 196 | 27% | 82 | 16% |
| Mobile Care Unit | 55 | 27% | 0 | 0% |
| Hospice | 1,032 | 27% | 39 | 21% |
| Occupational Health | 679 | 25% | 51 | 19% |
| Ambulatory Care | 346 | 24% | 16 | 19% |
| Ambulatory Surgery Center | 625 | 24% | 98 | 16% |
* Data are suppressed if count is less than 10 or sample population was less than 20.
Nurses who Experienced Workplace Violence by Position, 2021 (top positions in descending order by RNs)
| Position | RN = 25,472 | LPN = 3,032 | ||
|---|---|---|---|---|
| n | Estimate | n | Estimate | |
| Staff Nurse | 14,063 | 42% | 2,000 | 25% |
| Non-military, work in Military setting | 58 | 40% | * | * |
| Nurse Manager/Supervisor | 2,000 | 35% | 381 | 26% |
| Professional Nurse Training | 439 | 32% | 21 | 14% |
| Nurse Post-Secondary Educator | 801 | 31% | * | * |
| Patient Educator | 771 | 30% | 86 | 29% |
| Nurse Secondary Educator | 180 | 28% | * | * |
| Advanced Practice Registered Nurse | 2,244 | 25% | * | * |
| Faith-based Nurse | 80 | 24% | * | * |
| Nurse Executive/Administrator | 1,151 | 23% | 77 | 27% |
| Nurse Consultant | 601 | 22% | 28 | 26% |
| Reserve and Active Military | 43 | 21% | 43 | 21% |
| Case Manager/Coordinator/Navigator | 2,640 | 21% | 131 | 22% |
| Nurse Researcher | 181 | 20% | * | * |
| School Health Nurse K-12 | 240 | 20% | 50 | 12% |
* Data are suppressed if count is less than 10 or sample population was less than 20.
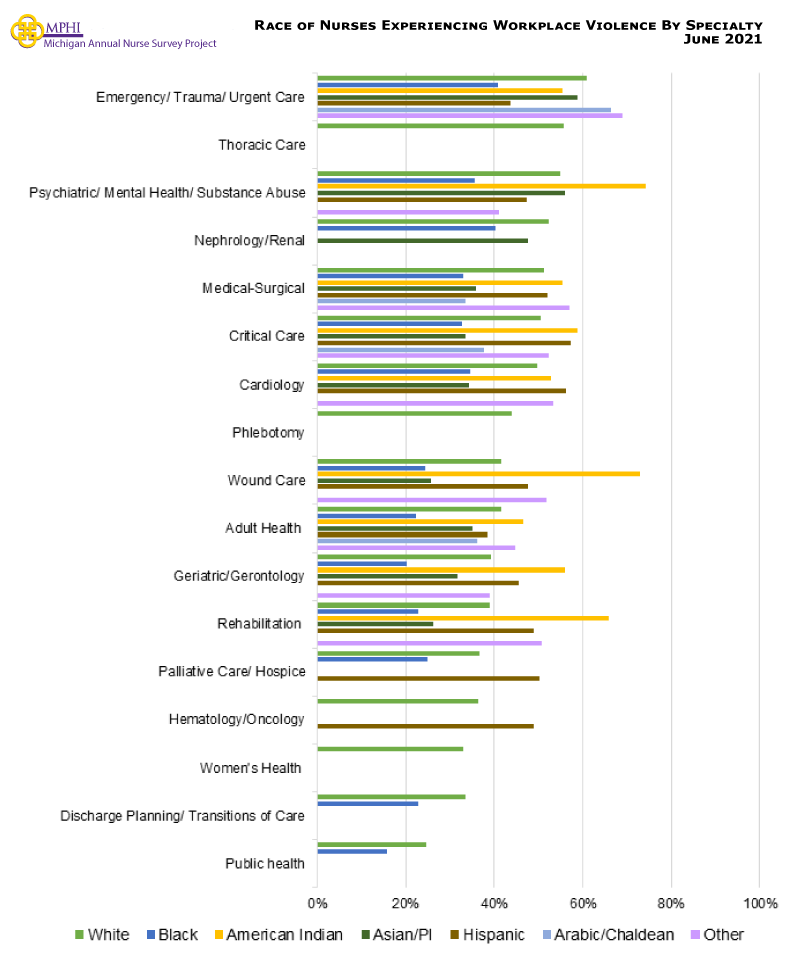
Nurses who Experienced Workplace Violence by Specialty, 2021 (top specialties in descending order by RNs)
| Specialty | RN = 25,472 | LPN = 3,032 | ||
|---|---|---|---|---|
| n | Estimate | n | Estimate | |
| Emergency/ Trauma/ Urgent Care | 2,223 | 61% | 58 | 30% |
| Thoracic Care | 348 | 55% | * | * |
| Psychiatric/ Mental Health/ Substance Abuse | 1,328 | 53% | 175 | 42% |
| Nephrology/Renal | 580 | 51% | 36 | 31% |
| Medical-Surgical | 3,497 | 49% | 148 | 29% |
| Critical Care | 3,441 | 49% | 85 | 29% |
| Cardiology | 1,906 | 48% | 51 | 27% |
| Phlebotomy | 185 | 48% | 70 | 21% |
| Wound Care | 849 | 41% | 321 | 30% |
| Adult Health | 4,557 | 41% | 1,027 | 27% |
| Geriatric/Gerontology | 2,183 | 39% | 1,021 | 29% |
| Rehabilitation | 986 | 36% | 440 | 32% |
| Palliative Care/ Hospice | 934 | 36% | 158 | 29% |
| Hematology/Oncology | 982 | 36% | 30 | 27% |
| Women’s Health | 510 | 33% | 33 | 22% |
| Discharge Planning/ Transitions of Care | 504 | 32% | 75 | 28% |
| Public health | 993 | 23% | 89 | 25% |
* Data are suppressed if count is less than 10 or sample population was less than 20.
Age of Nurses who Experienced Workplace Violence by Specialty, 2021 (top specialties)
| Specialty | Age 34 and Younger = 9,376 | Age 35 and Older = 36,979 | ||
|---|---|---|---|---|
| n | Estimate | n | Estimate | |
| Emergency/ Trauma/ Urgent Care | 533 | 65.7% | 1,604 | 57.0% |
| Thoracic Care | 115 | 67.7% | 221 | 43.6% |
| Psychiatric/ Mental Health/ Substance Abuse | 245 | 63.5% | 1,175 | 47.9% |
| Nephrology/Renal | 165 | 60.3% | 425 | 43.0% |
| Medical-Surgical | 1,079 | 57.2% | 2,374 | 42.3% |
| Critical Care | 1,033 | 53.7% | 2,303 | 44.0% |
| Cardiology | 533 | 59.2% | 1,319 | 40.1% |
| Phlebotomy | 51 | 51.4% | 193 | 36.3% |
| Wound Care | 226 | 39.9% | 897 | 37.0% |
| Adult Health | 1,277 | 50.2% | 4,022 | 32.5% |
| Geriatric/Gerontology | 586 | 43.6% | 2,478 | 32.5% |
| Rehabilitation | 279 | 34.6% | 1,092 | 35.1% |
| Palliative Care/ Hospice | 174 | 50.4% | 872 | 30.0% |
| Hematology/Oncology | 232 | 47.2% | 734 | 30.1% |
| Women’s Health | 112 | 45.4% | 405 | 26.7% |
| Discharge Planning/ Transitions of Care | 85 | 42.1% | 472 | 28.5% |
| Public health | 147 | 36.7% | 870 | 19.6% |
Gender of Nurses who Experienced Workplace Violence by Specialty, 2021 (top specialties)
| Specialty | Females n = 24,253 | Males n = 2,495 |
||
|---|---|---|---|---|
| Estimate | 95% CI | Estimate | 95% CI | |
| Emergency/ Trauma/ Urgent Care | 15.3% | (14.9%, 15.8%) | 24.4% | (22.8%, 26.1%) |
| Thoracic Care | 2.2% | (2.0%, 2.4%) | 4.8% | (4.0%, 5.7%) |
| Psychiatric/ Mental Health/ Substance Abuse | 8.6% | (8.3%, 9.0%) | 10.6% | (9.5%, 11.9%) |
| Nephrology/Renal | 3.7% | (3.5%, 3.9%) | 4.6% | (3.8%, 5.5%) |
| Medical-Surgical | 22.7% | (22.2%, 23.2%) | 19.9% | (18.4%, 21.5%) |
| Critical Care | 19.7% | (19.2%, 20.2%) | 33.2% | (31.4%, 35.1%) |
| Cardiology | 11.1% | (10.7%, 11.5%) | 14.3% | (13.0%, 15.7%) |
| Phlebotomy | 1.3% | (1.2%, 1.5%) | 1.3% | (0.9%, 1.8%) |
| Wound Care | 5.4% | (5.1%, 5.7%) | 5.2% | (4.4%, 6.1%) |
| Adult Health | 26.5% | (25.9%, 27.1%) | 23.2% | (21.6%, 24.9%) |
| Geriatric/Gerontology | 14.4% | (14.0%, 14.8%) | 9.0% | (7.9%, 10.2%) |
| Rehabilitation | 6.3% | (6.0%, 6.6%) | 4.7% | (3.9%, 5.6%) |
| Palliative Care/ Hospice | 4.5% | (4.2%, 4.8%) | 3.6% | (2.9%, 4.4%) |
| Hematology/Oncology | 4.4% | (4.1%, 4.7%) | 3.8% | (3.1%, 4.6%) |
| Women’s Health | 2.2% | (2.0%, 2.4%) | 0.6% | (0.4%, 1.0%) |
| Discharge Planning/ Transitions of Care | 2.3% | (2.1%, 2.5%) | 0.9% | (0.6%, 1.4%) |
| Public health | 2.9% | (2.7%, 3.1%) | 1.5% | (1.1%, 2.1%) |
Race & Ethnicity of Nurses who Experienced Workplace Violence by Specialty, 2021 (top specialties)
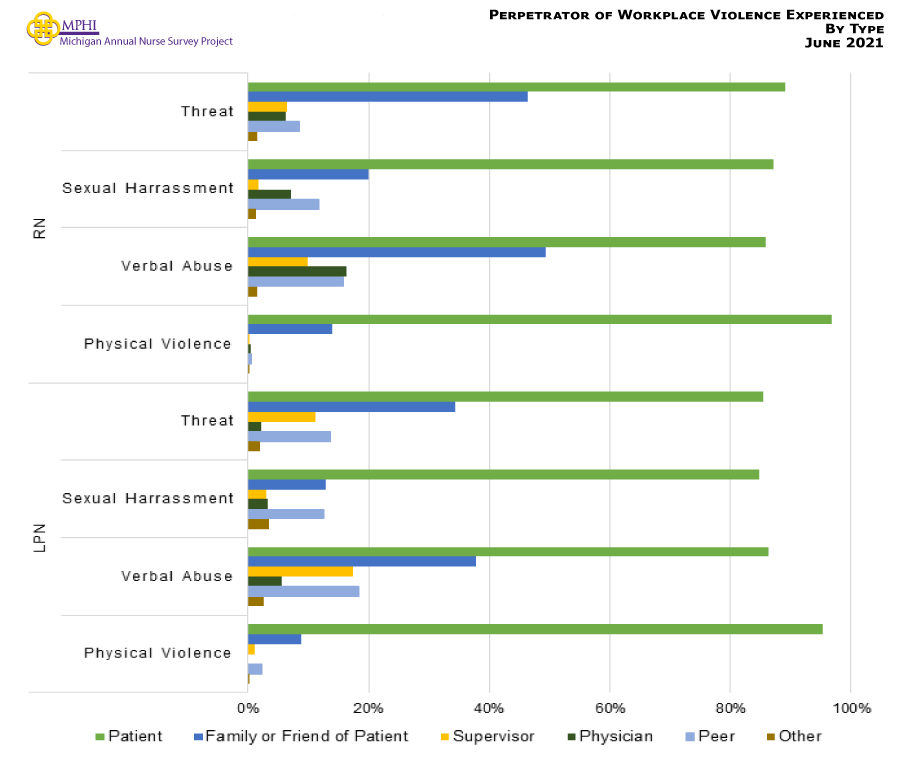
Perpetrator and Type of Violence Experienced by Nurses, 2021
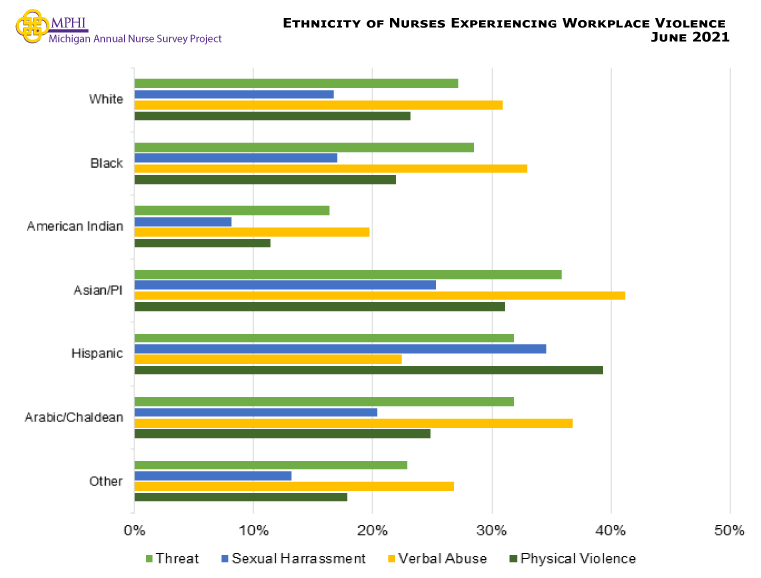
Ethnicity and Type of Violence Experienced by Nurses, 2021
Perpetrator of Workplace Violence Experienced by Specialty & Age
| Specialty | Nurses 34 Years or Younger | Nurses 35 Years or Older | ||||
|---|---|---|---|---|---|---|
| Supervisor | Physician | Peer | Supervisor | Physician | Peer | |
| Emergency/ Trauma/ Urgent Care | 11.1% | 16.5% | 17.9% | 3.4% | 13.6% | 19.7% |
| Thoracic Care | * | 31.3% | 21.4% | * | 25.0% | 50.0% |
| Psychiatric/ Mental Health/ Substance Abuse | 16.4% | 6.8% | 23.1% | 6.5% | 2.3% | 6.1% |
| Nephrology/Renal | * | 20.1% | 7.7% | 14.7% | 0.0% | 58.7% |
| Medical-Surgical | 11.9% | 14.0% | 19.7% | 11.1% | 8.6% | 17.2% |
| Critical Care | 12.8% | 26.2% | 24.0% | 14.6% | 36.7% | 37.8% |
| Cardiology | 13.2% | 25.7% | 20.6% | 17.8% | 17.8% | 29.7% |
| Phlebotomy | * | * | * | 0.0% | 0.0% | 33.3% |
| Wound Care | 22.1% | 8.9% | 17.3% | 32.2% | 0.0% | 32.2% |
| Adult Health | 17.2% | 16.7% | 21.7% | 18.4% | 13.1% | 24.0% |
| Geriatric/Gerontology | 21.0% | 10.7% | 18.0% | 18.0% | 0.0% | 11.8% |
| Rehabilitation | 18.5% | 8.9% | 23.4% | 8.3% | 0.0% | 28.6% |
| Palliative Care/ Hospice | 27.1% | 17.2% | 19.1% | 15.6% | 14.1% | 7.8% |
| Hematology/Oncology | * | 11.4% | 7.8% | 31.2% | 0.0% | 34.4% |
| Women’s Health | * | 25.1% | * | 38.8% | 50.0% | 38.8% |
| Discharge Planning/ Transitions of Care | * | * | 27.3% | 0.0% | 0.0% | 0.0% |
| Public health | 23.4% | 20.4% | 32.9% | 32.4% | 12.7% | 28.1% |
* Data are suppressed if count is less than 10 or sample population was less than 20.
Perpetrator of Workplace Violence Experienced by Specialty & Gender
| Specialty | Female | Male | ||||
|---|---|---|---|---|---|---|
| Supervisor | Physician | Peer | Supervisor | Physician | Peer | |
| Emergency/ Trauma/ Urgent Care | 9.0% | 15.1% | 16.6% | 11.3% | 15.5% | 20.0% |
| Thoracic Care | * | 28.3% | 17.4% | * | 25.4% | * |
| Psychiatric/ Mental Health/ Substance Abuse | 12.1% | 8.6% | 20.6% | 11.4% | 9.8% | 16.5% |
| Nephrology/Renal | 6.4% | 16.8% | 16.7% | * | * | * |
| Medical-Surgical | 7.8% | 14.5% | 16.2% | 7.3% | 11.5% | 19.3% |
| Critical Care | 9.8% | 21.8% | 20.0% | 9.1% | 23.4% | 27.2% |
| Cardiology | 7.9% | 22.0% | 19.4% | 11.1% | 20.1% | 24.1% |
| Phlebotomy | 12.4% | 20.2% | 24.7% | * | * | * |
| Wound Care | 19.5% | 13.8% | 21.4% | * | * | 22.2% |
| Adult Health | 11.7% | 15.1% | 20.3% | 11.6% | 17.9% | 25.1% |
| Geriatric/Gerontology | 18.3% | 12.1% | 22.3% | 13.5% | 13.9% | 25.2% |
| Rehabilitation | 19.7% | 8.4% | 24.5% | * | * | * |
| Palliative Care/ Hospice | 18.8% | 15.3% | 21.6% | * | * | * |
| Hematology/Oncology | 8.2% | 14.4% | 19.1% | * | * | * |
| Women’s Health | 14.5% | 26.2% | 14.7% | * | * | * |
| Discharge Planning/ Transitions of Care | 17.0% | 21.1% | 27.7% | * | * | * |
| Public health | 22.5% | 22.9% | 32.3% | * | * | * |
* Data are suppressed if count is less than 10 or sample population was less than 20.
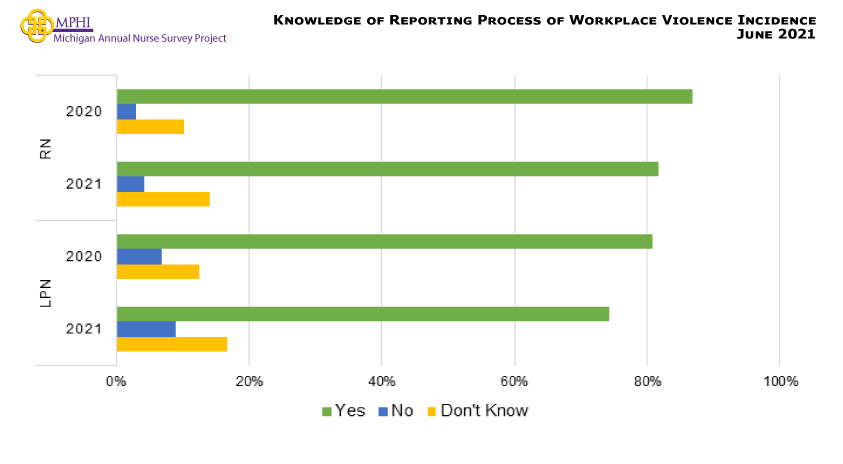
Reporting of Workplace Violence Incidence, 2021
| RN = 7,481 | LPN = 607 | |||
|---|---|---|---|---|
| Estimate | 95% CI | Estimate | 95% CI | |
| Knowledge of Organizational Process for Reporting Workplace Violence | ||||
| Yes | 81.7% | (80.8%, 82.6%) | 74.3% | (70.7%, 77.6%) |
| No | 4.2% | (3.8%, 4.7%) | 9.0% | (7.0%, 11.6%) |
| Don’t Know | 14.1% | (13.3%, 14.9%) | 16.7% | (13.9%, 19.9%) |
| Reported Workplace Violence Using Organizational Process | ||||
| Yes | 53.3% | (52.1%, 54.6%) | 71.2% | (66.9%, 75.2%) |
| No | 46.7% | (45.4%, 47.9%) | 28.8% | (24.8%, 33.1%) |
Knowledge of Reporting Process of Workplace Violence Incidents through Organization, 2020-2021
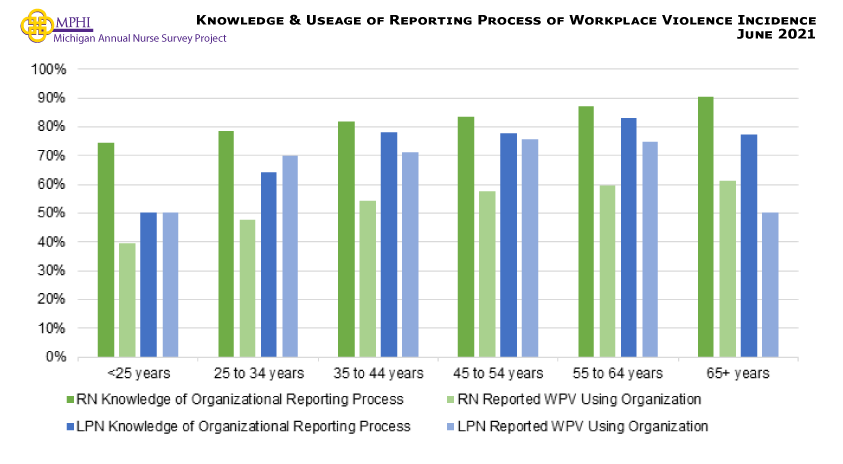
Knowledge of Organizational Reporting Process & Use of WPV Reporting by Age
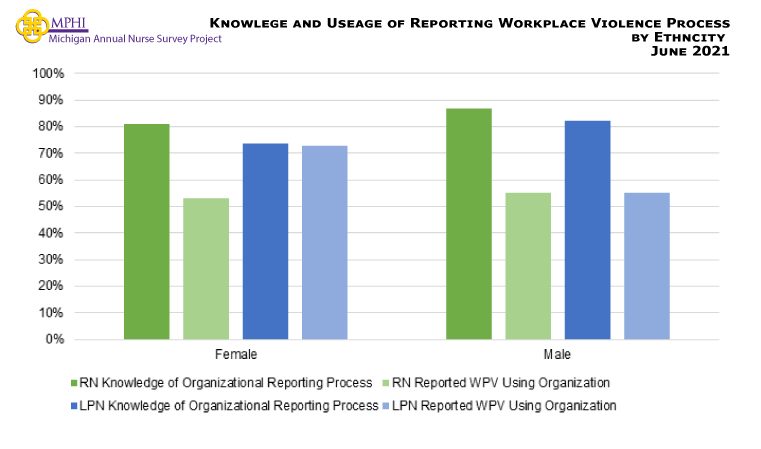
Knowledge of Organizational Reporting Process & Use of WPV Reporting by Gender
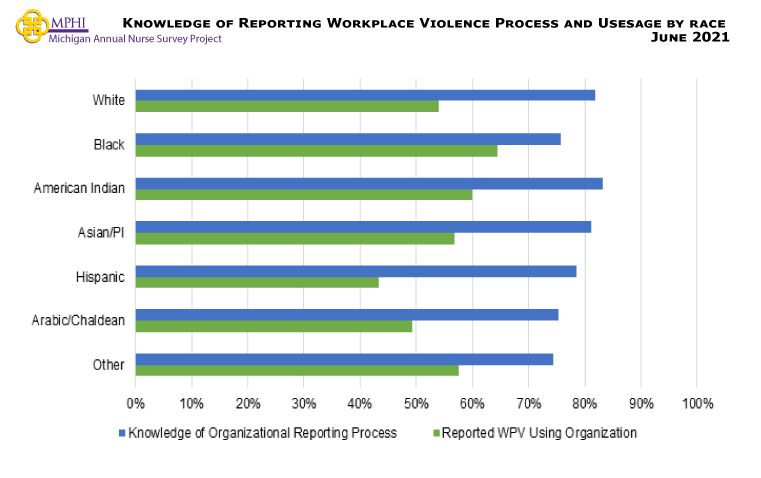
Knowledge of Organizational Reporting Process & Use of WPV Reporting by Race & Ethnicity
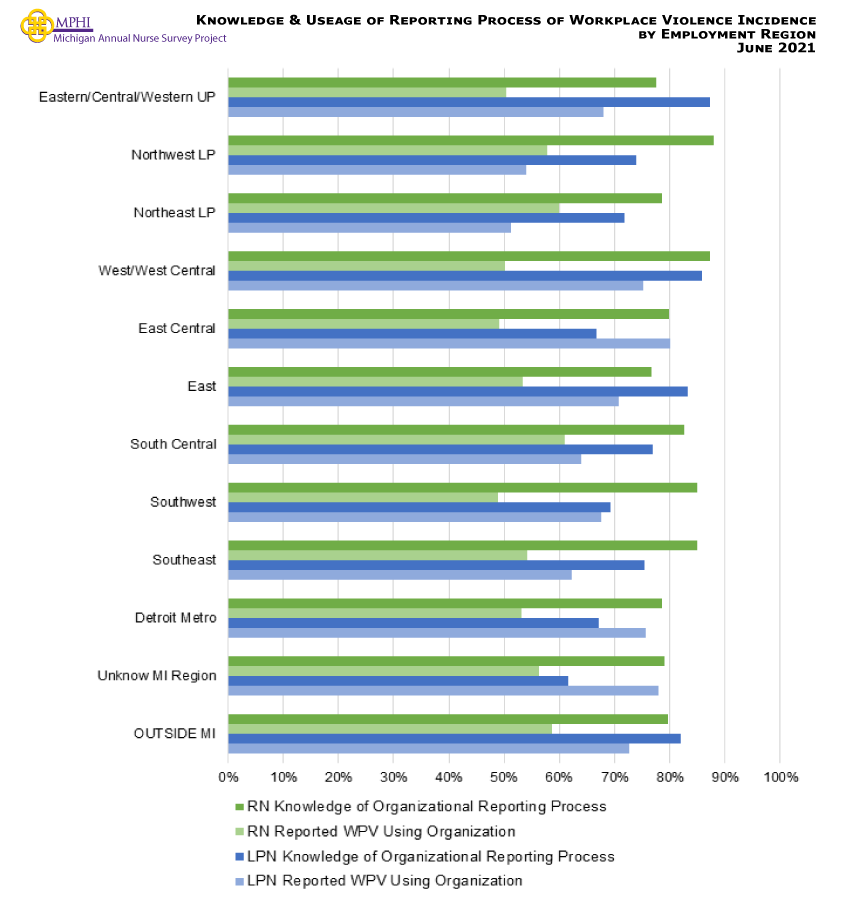
Knowledge of Organizational Reporting Process & Use of WPV Reporting by Employment Region
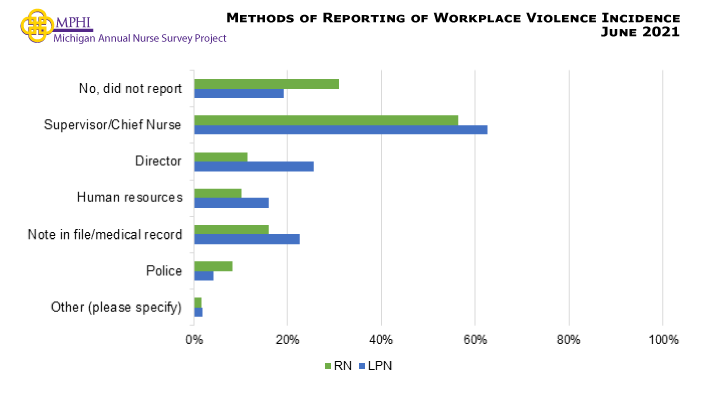
Methods of Reporting Workplace Violence Incidence, 2021