Analysis of the survey responses are presented in tables and charts below:
Survey Respondents & Response RatesComparison of Online & Mail Survey Response Options
Online
Mail
n
%
95% CI
n
%
95% CI
Total
16,898
87.1%
(86.6%, 87.6%)
2,507
12.9%
(12.4%, 13.4%)
RN
15,105
87.6%
(87.1%, 88.1%)
2,139
12.4%
(11.9%, 12.9%)
APRN
605
83.8%
(81.1%, 86.5%)
117
16.2%
(13.5%, 18.9%)
LPN
1,793
83.0%
(81.4%, 84.6%)
368
17.0%
(15.4%, 18.6%)
Age
18 to 24 years
318
95.5%
(93.3%, 97.7%)
15
4.5%
(2.3%, 6.7%)
25 to 34 years
2,344
93.7%
(92.8%, 94.7%)
157
6.3%
(5.3%, 7.2%)
35 to 44 years
2,674
92.7%
(91.8%, 93.7%)
210
7.3%
(6.3%, 8.2%)
45 to 54 years
3,818
90.8%
(89.9%, 91.6%)
389
9.2%
(8.4%, 10.1%)
55 to 64 years
5,282
86.3%
(85.4%, 87.2%)
838
13.7%
(12.8%, 14.6%)
65+ years
2,072
73.4%
(71.8%, 75.1%)
750
26.6%
(24.9%, 28.2%)
Gender
Female
15,595
86.8%
(86.3%, 87.3%)
2,374
13.2%
(12.7%, 13.7%)
Male
1,120
90.8%
(89.1%, 92.4%)
114
9.2%
(7.6%, 10.9%)
Race
White
15,001
87.2%
(86.7%, 87.7%)
2,195
12.8%
(12.3%, 13.3%)
Black or African American
1,042
85.8%
(83.9%, 87.8%)
172
14.2%
(12.2%, 16.1%)
Other
810
85.5%
(83.3%, 87.8%)
137
14.5%
(12.2%, 16.7%)
Ethnicity
Hispanic or Latino
238
89.1%
(85.4%, 92.9%)
29
10.9%
(7.1%, 14.6%)
Not Hispanic or Latino
16,024
87.1%
(86.6%, 87.6%)
2,377
12.9%
(12.4%, 13.4%)
Residency
Eastern/Central/Western UP
575
86.5%
(83.9%, 89.1%)
90
13.5%
(10.9%, 16.1%)
Northwest LP
578
85.6%
(83.0%, 88.3%)
97
14.4%
(11.7%, 17.0%)
Northeast LP
272
82.4%
(78.3%, 86.5%)
58
17.6%
(13.5%, 21.7%)
West/West Central
2,552
88.5%
(87.4%, 89.7%)
331
11.5%
(10.3%, 12.6%)
East Central
857
86.1%
(84.0%, 88.3%)
138
13.9%
(11.7%, 16.0%)
East
1,242
85.8%
(84.0%, 87.6%)
206
14.2%
(12.4%, 16.0%)
South Central
564
86.9%
(84.3%, 89.5%)
85
13.1%
(10.5%, 15.7%)
Southwest
1,100
87.1%
(85.2%, 88.9%)
163
12.9%
(11.1%, 14.8%)
Southeast
1,694
87.2%
(85.7%, 88.7%)
248
12.8%
(11.3%, 14.3%)
Detroit Metro
5,058
86.4%
(85.5%, 87.3%)
797
13.6%
(12.7%, 14.5%)
Outside MI
1,167
84.9%
(83.0%, 86.8%)
208
15.1%
(13.2%, 17.0%)
All percentages reported in the table are presented as weighted estimates that reflect Michigan’s overall nurse population. For example, of RNs who responded to the survey, 87.6% completed the survey online compared to 12.4% who completed the survey through mail. Comparison of Survey Respondents to All Nurses Licensed in Michigan
Characteristics
Nurse Population (Licensure Data)
2016 Survey Data
2016
2017
Total
Total
#
%
#
%
#
%
#
%
Total
84,439
–
82,034
–
166,473
–
19,405
–
RNs
71,657
84.9%
69,866
85.2%
141,523
85.0%
17,244
88.9%
NPs
2,896
4.0%
2,888
4.1%
5,784
4.1%
564
3.3%
Anesthetists
1,240
1.7%
1,338
1.9%
2,578
1.8%
120
0.7%
Nurse Midwifes
169
0.2%
175
0.3%
344
0.2%
48
0.3%
Age
<25 years
1,309
1.8%
1,038
1.5%
2,347
1.7%
302
1.8%
25 to 34 years
12,775
17.8%
12,411
17.8%
25,186
17.8%
2,306
13.4%
35 to 44 years
14,620
20.4%
14,277
20.4%
28,897
20.4%
2,560
14.8%
45 to 54 years
16,488
23.0%
15,883
22.7%
32,371
22.9%
3,751
21.8%
55 to 64 years
18,173
25.4%
18,551
26.6%
36,724
25.9%
5,387
31.2%
65+ years
8,280
11.6%
7,696
11.0%
15,976
11.3%
2,466
14.3%
Unknown
12
0.0%
10
0.0%
22
0.0%
472
2.7%
Region
Eastern/Central/Western UP
2,062
2.9%
1,932
2.8%
3,994
2.8%
524
3.0%
Northwest LP
2,295
3.2%
2,417
3.5%
4,712
3.3%
576
3.3%
Northeast LP
1,152
1.6%
1,151
1.6%
2,303
1.6%
265
1.5%
West/West Central
9,152
12.8%
9,098
13.0%
18,250
12.9%
2,502
14.5%
East Central
3,728
5.2%
3,529
5.1%
7,257
5.1%
859
5.0%
East
5,763
8.0%
5,721
8.2%
11,484
8.1%
1,243
7.2%
South Central
2,587
3.6%
2,618
3.7%
5,205
3.7%
591
3.4%
Southwest
4,599
6.4%
4,647
6.7%
9,246
6.5%
1,111
6.4%
Southeast
7,347
10.3%
7,177
10.3%
14,524
10.3%
1,748
10.1%
Detroit Metro
24,241
33.8%
23,764
34.0%
48,005
33.9%
5,360
31.1%
Outside Michigan
8,731
12.2%
7,812
11.2%
16,543
11.7%
1,276
7.4%
Unknown
0
0.0%
0
0.0%
0
0.0%
1,186
6.9%
LPNs
12,782
15.1%
12,168
14.8%
24,950
15.0%
2,161
11.1%
Age
<25 years
272
2.1%
243
2.0%
515
2.1%
31
1.4%
25 to 34 years
2,263
17.7%
2,085
17.1%
4,348
17.4%
195
9.0%
35 to 44 years
2,651
20.7%
2,421
19.9%
5,072
20.3%
324
15.0%
45 to 54 years
2,612
20.4%
2,592
21.3%
5,204
20.9%
455
21.1%
55 to 64 years
3,367
26.3%
3,334
27.4%
6,701
26.9%
733
33.9%
65+ years
1,614
12.6%
1,488
12.2%
3,102
12.4%
356
16.5%
Unknown
*
*
*
*
*
*
67
3.1%
Region
Eastern/Central/Western UP
866
6.8%
919
7.6%
1,785
7.2%
141
6.5%
Northwest LP
372
2.9%
326
2.7%
698
2.8%
99
4.6%
Northeast LP
461
3.6%
443
3.6%
904
3.6%
65
3.0%
West/West Central
2,046
16.0%
2,039
16.8%
4,085
16.4%
381
17.6%
East Central
902
7.1%
950
7.8%
1,852
7.4%
136
6.3%
East
1,275
10.0%
1,132
9.3%
2,407
9.6%
205
9.5%
South Central
420
3.3%
367
3.0%
787
3.2%
58
2.7%
Southwest
932
7.3%
897
7.4%
1,829
7.3%
152
7.0%
Southeast
1,220
9.5%
1,023
8.4%
2,243
9.0%
194
9.0%
Detroit Metro
3,579
28.0%
3,469
28.5%
7,048
28.2%
492
22.8%
Outside Michigan
709
5.5%
603
5.0%
1,312
5.3%
99
4.6%
Unknown
0
0.0%
0
0.0%
0
0.0%
139
6.4%
All percentages reported in the table are presented as weighted estimates that reflect Michigan’s overall nurse population. For example, of RNs who responded to the survey, 31.2% are 55 to 64 years old compared to 25.4% of RNs in the 2016 nursing populations overall.
* Data are suppressed if count is less than 10 or sample population was less than 20.EducationEducational Background of Michigan Nurses
Education Level
RN = 17,216
LPN = 2,158
Estimate*
95% CI
Estimate*
95% CI
LPN diploma/certificate
3.1%
(2.8%, 3.3%)
96.5%
(95.7%, 97.2%)
RN diploma in nursing
12.9%
(12.4%, 13.4%)
–
–
Associate’s degree in nursing
39.8%
(39.1%, 40.5%)
4.7%
(3.9%, 5.7%)
Bachelor’s degree in nursing
48.1%
(47.4%, 48.9%)
0.7%
(0.4%, 1.1%)
Master’s degree in nursing
10.1%
(9.7%, 10.6%)
–
–
Master’s degree in other field
4.7%
(4.4%, 5.0%)
–
–
Doctorate in nursing
1.0%
(0.9%, 1.2%)
–
–
Doctorate in other field
0.6%
(0.5%, 0.7%)
–
–
Other degree
6.8%
(6.4%, 7.2%)
10.2%
(9.0%, 11.5%)
All percentages reported in the table are presented as weighted estimates that reflect Michigan’s overall nurse population. For example, of RNs who responded to the survey, 3.1% had attained a LPN diploma/certificate.
*Because nurses had the option to select more than one response, percentages sum to more than 100%.
– Survey respondents were not given these education levels because they had previously indicated they were LPNs.Type of Doctoral Degrees Held by Michigan Nurses
Doctorate Degree
RN = 180
Estimate
95% CI
Doctor of Nursing (ND)
3.1%
(1.4%, 6.7%)
Doctor of Nursing Practice (DNP)
55.1%
(47.8%, 62.2%)
Doctor of Nursing Science (DNSc)
1.3%
(0.4%, 4.2%)
Doctor of Philosophy (PhD)
41.8%
(34.8%, 49.1%)
All percentages reported in the table are presented as weighted estimates that reflect Michigan’s overall nurse population. For example, of RNs who held a doctoral degree, 3.1% had a Doctor of Nursing (ND) degree.Current Enrollment in Nursing Educational Programs
Degree
RN = 17,244
LPN = 2,161
Estimate
95% CI
Estimate
95% CI
Bachelor of Science in Nursing (BSN)
5.5%
(5.2%, 5.9%)
2.9%
(2.2%, 3.6%)
Master of Science in Nursing (MSN)
3.3%
(3.0%, 3.6%)
0.1%
(0.0%, 0.3%)
Doctor of Nursing Practice (DNP)
0.9%
(0.7%, 1.0%)
0.1%
(0.0%, 0.3%)
Doctor of Philosophy in Nursing (PhD)
0.2%
(0.1%, 0.2%)
0.0%
(0.0%, 0.2%)
All percentages reported in the table are presented as weighted estimates that reflect Michigan’s overall nurse population. For example, of RNs who responded to the survey, 5.5% are currently enrolled in a Bachelor of Science in Nursing (BSN) program.Educational Preparation to Earn Specialty Certification
Nurse Certificate
n = 352
Estimate
95% CI
Nurse Practitioner
91.0%
(87.5%, 93.5%)
Nurse Midwife
3.3%
(1.9%, 5.7%)
Nurse Anesthetist
5.8%
(3.8%, 8.7%)
All percentages reported in the table are presented as weighted estimates that reflect Michigan’s overall nurse population. For example, of RNs who responded they are currently enrolled in an AP associated program, 91.0% are currently enrolled in a Nurse Practitioner program.EmploymentDemographic Characteristics of Employed Nurses
Demographics
RN
LPN
n
Estimate
95% CI
n
Estimate
95% CI
Total
17,244
84.0%
(83.4%, 84.5%)
2,161
77.5%
(75.7%, 79.2%)
Age
18 to 24 years
302
97.0%
(95.1%, 98.9%)
31
83.9%
(70.9%, 96.8%)
25 to 34 years
2,306
95.8%
(95.0%, 96.6%)
195
86.2%
(81.3%, 91.0%)
35 to 44 years
2,560
91.8%
(90.7%, 92.9%)
324
83.6%
(79.6%, 87.7%)
45 to 54 years
3,752
90.6%
(89.7%, 91.6%)
455
86.4%
(83.2%, 89.5%)
55 to 64 years
5,387
80.5%
(79.5%, 81.6%)
733
74.1%
(70.9%, 77.3%)
65+ years
2,466
43.7%
(41.7%, 45.7%)
356
46.6%
(41.5%, 51.8%)
Gender
Female
15,946
83.6%
(83.0%, 84.2%)
2,023
77.0%
(75.2%, 78.9%)
Male
1,125
89.8%
(88.0%, 91.5%)
109
85.7%
(79.1%, 92.2%)
Race
White
15,461
83.8%
(83.2%, 84.4%)
1,735
75.8%
(73.8%, 77.9%)
Black or African American
891
84.7%
(82.4%, 87.1%)
323
85.2%
(81.3%, 89.1%)
Other
830
86.3%
(84.0%, 88.6%)
117
79.0%
(71.6%, 86.4%)
Ethnicity
Hispanic or Latino
241
92.0%
(88.6%, 95.4%)
26
83.5%
(69.2%, 97.8%)
Not Hispanic or Latino
16,381
84.0%
(83.5%, 84.6%)
2,020
77.5%
(75.6%, 79.3%)
Residency
Eastern/Central/Western UP
524
84.1%
(81.0%, 87.3%)
141
73.3%
(66.0%, 80.6%)
Northwest LP
576
83.4%
(80.4%, 86.5%)
99
79.8%
(71.9%, 87.7%)
Northeast LP
265
81.0%
(76.3%, 85.7%)
65
77.5%
(67.4%, 87.7%)
West/West Central
2,502
86.7%
(85.4%, 88.0%)
381
78.7%
(74.6%, 82.8%)
East Central
859
87.3%
(85.1%, 89.5%)
136
79.4%
(72.6%, 86.2%)
East
1,243
86.3%
(84.4%, 88.2%)
205
74.2%
(68.2%, 80.2%)
South Central
591
85.3%
(82.5%, 88.2%)
58
71.5%
(59.9%, 83.1%)
Southwest
1,111
85.7%
(83.6%, 87.7%)
152
84.6%
(78.8%, 90.3%)
Southeast
1,748
85.7%
(84.0%, 87.3%)
194
82.7%
(77.4%, 88.1%)
Detroit Metro
5,363
86.4%
(85.5%, 87.4%)
492
81.7%
(78.3%, 85.1%)
Outside MI
1,276
81.6%
(79.5%, 83.8%)
99
73.5%
(64.8%, 82.2%)
All percentages reported in the table are presented as weighted estimates that reflect Michigan’s overall nurse population. For example, of RNs 25 years or younger who responded to the survey, 97.0% are employed.Prosperity Region of Residency & Employment among Michigan Nurses
Prosperity Region
RNs
LPNs
Place of Residency
Place of Employment
Place of Residency
Place of Employment
Estimate
95% CI
Estimate
95% CI
Estimate
95% CI
Estimate
95% CI
Eastern/Central/Western UP
2.8%
(2.5%, 3.1%)
2.9%
(2.6%, 3.2%)
6.6%
(5.5%, 8.0%)
7.4%
(6.2%, 8.9%)
Northwest LP
3.2%
(3.0%, 3.6%)
3.3%
(3.0%, 3.7%)
2.8%
(2.1%, 3.8%)
2.9%
(2.1%, 3.9%)
Northeast LP
1.5%
(1.3%, 1.8%)
1.5%
(1.3%, 1.7%)
3.5%
(2.7%, 4.6%)
3.2%
(2.4%, 4.2%)
West/West Central
13.1%
(12.5%, 13.7%)
12.7%
(12.1%, 13.3%)
16.3%
(14.6%, 18.2%)
16.6%
(14.8%, 18.6%)
East Central
5.2%
(4.9%, 5.6%)
5.3%
(5.0%, 5.7%)
7.5%
(6.2%, 8.9%)
7.7%
(6.5%, 9.2%)
East
8.2%
(7.7%, 8.7%)
7.1%
(6.7%, 7.6%)
9.1%
(7.7%, 10.6%)
8.2%
(6.9%, 9.7%)
South Central
3.7%
(3.4%, 4.0%)
4.0%
(3.6%, 4.3%)
2.8%
(2.1%, 3.8%)
3.1%
(2.3%, 4.1%)
Southwest
6.5%
(6.1%, 7.0%)
7.0%
(6.6%, 7.4%)
7.8%
(6.6%, 9.3%)
8.1%
(6.8%, 9.6%)
Southeast
10.3%
(9.8%, 10.8%)
12.0%
(11.4%, 12.6%)
9.4%
(8.1%, 11.0%)
9.7%
(8.2%, 11.3%)
Detroit Metro
34.3%
(33.5%, 35.1%)
32.7%
(31.9%, 33.5%)
29.2%
(27.0%, 31.5%)
29.6%
(27.3%, 32.0%)
Outside MI
11.2%
(10.6%, 11.7%)
11.4%
(10.9%, 12.0%)
4.9%
(3.9%, 6.1%)
3.7%
(2.8%, 4.7%)
All percentages reported in the table are presented as weighted estimates that reflect Michigan’s overall nurse population. For example, of RNs who responded to the survey, 2.8% live in the Upper Peninsula.Current Employment Status by AgeNumber of Years Working as a Nurse
Years
RN = 13,884
LPN = 1,592
Estimate
95% CI
Estimate
95% CI
Less than 3 years
15.8%
(15.2%, 16.4%)
21.2%
(19.2%, 23.2%)
4 to 9 years
19.5%
(18.8%, 20.1%)
22.6%
(20.6%, 24.7%)
10 years or more
64.7%
(63.9%, 65.5%)
56.2%
(53.8%, 58.6%)
All percentages reported in the table are presented as weighted estimates that reflect Michigan’s overall nurse population. For example, of RNs who responded to the survey, 15.8% have worked as a nurse for less than 3 years.Plans to Continue Working as a Nurse
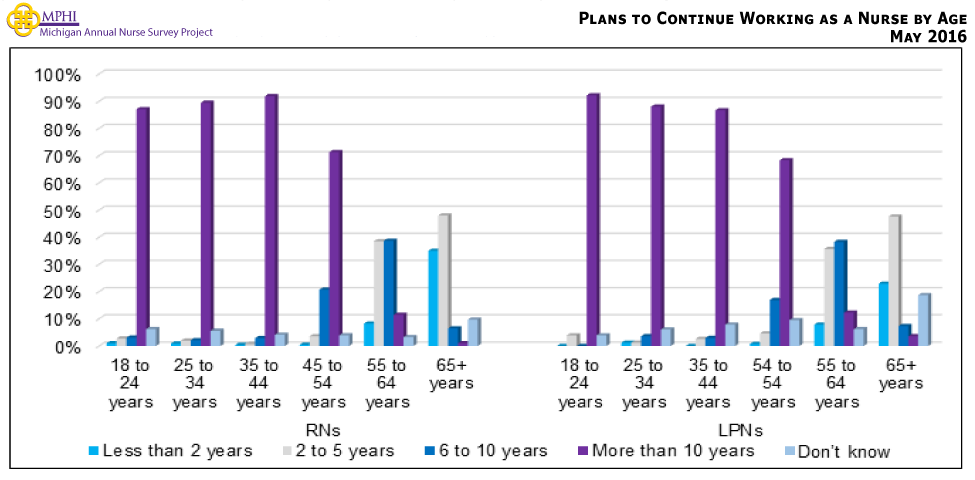
Years
RN = 13,897
LPN = 1,592
Estimate
95% CI
Estimate
95% CI
Less than 2 years
4.5%
(4.1%, 4.8%)
4.1%
(3.2%, 5.1%)
2 to 5 years
13.9%
(13.3%, 14.5%)
14.7%
(12.9%, 16.4%)
6 to 10 years
16.3%
(15.6%, 16.9%)
15.6%
(13.8%, 17.4%)
More than 10 years
60.8%
(60.0%, 61.6%)
57.5%
(55.0%, 59.9%)
Don’t know
4.5%
(4.2%, 4.9%)
8.1%
(6.8%, 9.5%)
All percentages reported in the table are presented as weighted estimates that reflect Michigan’s overall nurse population. For example, of RNs who responded to the survey, 4.5% were planning to continue to work as a nurse for less than 2 years.Plans to Continue to Practice Nursing (in years) by AgeNurses Who Plan to Stop Working within the Next 5 Years by Age
Age Category
RN
LPN
n
Estimate
95% CI
n
Estimate
95% CI
<55 Years
8,218
2.7%
(2.4%, 3.1%)
854
3.5%
(2.3%, 4.8%)
55+ Years
5,381
53.6%
(52.3%, 54.9%)
705
49.6%
(45.9%, 53.3%)
All percentages reported in the table are presented as weighted estimates that reflect Michigan’s overall nurse population. For example, of RNs who younger than 55 years, 2.7% were planning to continue to stop working as a nurse within the next 5 years.Direct CareNurses Who Provide Direct Care Services
Plans to Work
RN
LPN
n
Estimate
95% CI
n
Estimate
95% CI
Total
13,911
81.3%
(80.6%, 81.9%)
1,596
87.9%
(86.3%, 89.5%)
5 years or less
3,203
70.0%
(68.4%, 71.6%)
391
83.5%
(79.9%, 87.2%)
More than 5 years
10,646
83.8%
(83.1%, 84.5%)
1,194
88.8%
(87.1%, 90.6%)
All percentages reported in the table are presented as weighted estimates that reflect Michigan’s overall nurse population. For example, of RNs who provide direct care services, 70.0% plan to work for 5 years or less.Hours per Week Spent Providing Direct Care Services
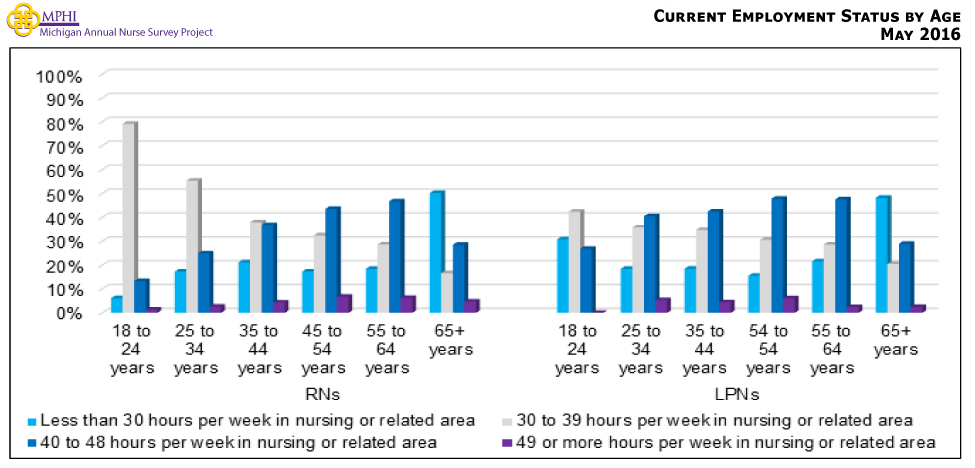
Hours per Week
RN (excluding APRNs) = 12,353
APRNs = 659
LPNs = 1,313
Estimate
95% CI
Estimate
95% CI
Estimate
95% CI
No direct care
14.5%
(13.9%, 15.2%)
2.7%
(7.5%, 10.6%)
8.9%
(7.5%, 10.6%)
Less than 10 hours per week
8.9%
(8.4%, 9.4%)
4.1%
(2.7%, 7.9%)
9.4%
(7.9%, 11.1%)
10 to 15 hours per week
4.9%
(4.5%, 5.3%)
5.1%
(2.7%, 4.4%)
5.5%
(4.4%, 06.9%)
16 to 25 hours per week
12.8%
(12.2%, 13.4%)
11.9%
(2.7%, 11.5%)
13.3%
(11.5%, 15.2%)
26 to 35 hours per week
12.9%
(12.3%, 13.5%)
15.2%
(2.7%, 15.5%)
17.4%
(15.5%, 19.6%)
36 to 41 hours per week
39.0%
(38.2%, 39.9%)
32.6%
(2.7%, 30.8%)
33.3%
(30.8%, 35.9%)
42 to 48 hours per week
5.5%
(5.1%, 5.9%)
20.2%
(2.7%, 07.8%)
9.3%
(7.8%, 11.0%)
49 or more hours per week
1.5%
(1.3%, 1.7%)
8.2%
(2.7%, 2.1%)
2.9%
(2.1%, 4.0%)
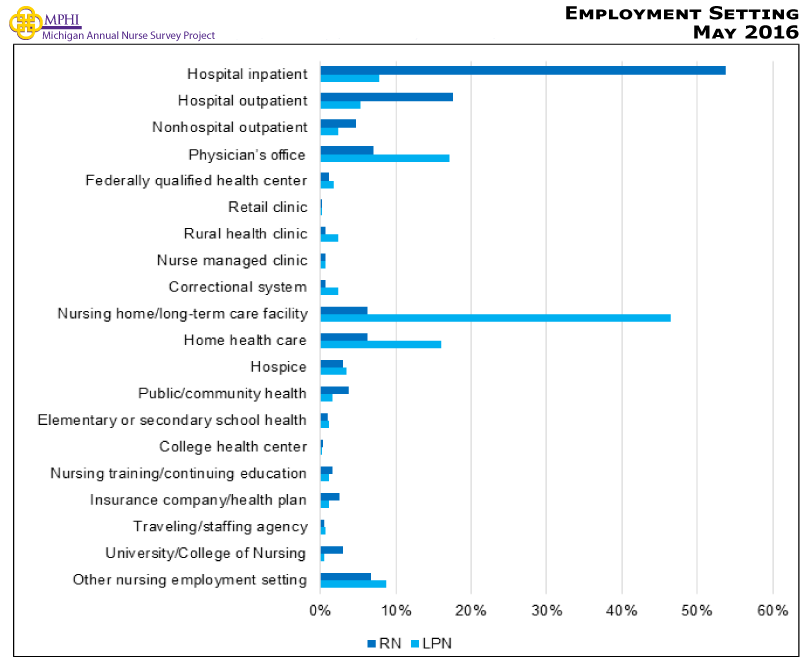
All percentages reported in the table are presented as weighted estimates that reflect Michigan’s overall nurse population. For example, of RNs who provide direct care services, 14.5% work 0 hours per week providing direct care services.Direct Care Main Practice AreaMain Role Outside of Direct Patient CarePractice SettingEmployment SettingPercentage of Nurses who Plan to Stop Working in the Next 5 Years by Employment SettingParticipation in Interprofessional ActivitiesChange in Employment Setting