2020 Annual Survey of Nurses
Survey Data Tables
Analysis of the survey responses are presented in tables and charts below:
Survey Respondents & Response Rates
Demographic Characteristics of Survey Respondents
| Demographics | RN = 36,617 | LPN = 4,204 | ||
|---|---|---|---|---|
| n | Estimate | n | Estimate | |
| Age | ||||
| <25 years | 520 | 1.4% | 50 | 1.2% |
| 25 to 34 years | 6,203 | 16.9% | 626 | 14.9% |
| 35 to 44 years | 7,217 | 19.7% | 885 | 21.1% |
| 45 to 54 years | 6,956 | 19.0% | 882 | 21.0% |
| 55 to 64 years | 7,900 | 21.6% | 895 | 21.3% |
| 65 to 74 years | 4,962 | 13.6% | 485 | 11.5% |
| 75+ years | 625 | 1.7% | 48 | 1.1% |
| Unknown | 2,234 | 6.1% | 333 | 7.9% |
| Gender | ||||
| Female | 31,913 | 87.2% | 3,668 | 87.3% |
| Male | 3,110 | 8.5% | 269 | 6.4% |
| Other | 46 | 0.1% | * | * |
| Unknown | 1,548 | 4.2% | 258 | 6.1% |
| Race | ||||
| White | 31,390 | 85.7% | 2,765 | 65.8% |
| Black or African American | 2,028 | 5.5% | 993 | 23.6% |
| American Indian or Alaska Native | 430 | 1.2% | 93 | 2.2% |
| Asian | 1,128 | 3.1% | 76 | 1.8% |
| Native Hawaiian or Pacific Islander | 89 | 0.2% | 11 | 0.3% |
| Other | 609 | 1.7% | 110 | 2.6% |
| Unknown | 1,759 | 4.8% | 300 | 7.1% |
| Hispanic or Latino | ||||
| Yes | 756 | 2.1% | 119 | 2.8% |
| No | 34,011 | 92.9% | 3,783 | 90.0% |
| Unknown | 1,850 | 5.1% | 302 | 7.2% |
| Arabic or Chaldean | ||||
| Yes | 756 | 2.1% | 119 | 2.8% |
| No | 34,011 | 92.9% | 3,783 | 90.0% |
| Unknown | 1,850 | 5.1% | 302 | 7.2% |
| Region | ||||
| Upper Peninsula | 927 | 2.5% | 207 | 4.9% |
| Northwest LP | 1,287 | 3.5% | 119 | 2.8% |
| Northeast LP | 598 | 1.6% | 117 | 2.8% |
| West/West Central | 4,987 | 13.6% | 588 | 14.0% |
| East Central | 1,647 | 4.5% | 228 | 5.4% |
| East | 2,559 | 7.0% | 329 | 7.8% |
| South Central | 1,307 | 3.6% | 116 | 2.8% |
| Southwest | 2,130 | 5.8% | 272 | 6.5% |
| Southeast | 3,509 | 9.6% | 321 | 7.6% |
| Detroit Metro | 10,756 | 29.4% | 1,288 | 30.6% |
| MI, Unknown Region | 1,096 | 3.0% | 120 | 2.9% |
| Outside MI | 4,430 | 12.1% | 256 | 6.1% |
| Unknown | 1,384 | 3.8% | 243 | 5.8% |
* Data are suppressed if count is less than 10 or sample population was less than 20.
Comparison of Survey Respondents to All Nurses Licensed in Michigan
| Characteristics | RNs | LPNs | ||||||
|---|---|---|---|---|---|---|---|---|
| Nurse Population | Survey Participants | Nurse Population | Survey Participants | |||||
| # | % | # | % | # | % | # | % | |
| Total | 155,199 | – | 36,617 | – | 22,434 | – | 4,204 | – |
| Age | ||||||||
| <25 years | 3,493 | 2.3% | 520 | 1.4% | 393 | 1.8% | 50 | 1.2% |
| 25 to 34 years | 31,067 | 20.0% | 6,203 | 16.9% | 3,859 | 17.2% | 626 | 14.9% |
| 35 to 44 years | 32,312 | 20.8% | 7,217 | 19.7% | 4,967 | 22.1% | 885 | 21.1% |
| 45 to 54 years | 32,678 | 21.1% | 6,956 | 19.0% | 4,692 | 20.9% | 882 | 21.0% |
| 55 to 64 years | 35,113 | 22.6% | 7,900 | 21.6% | 5,275 | 23.5% | 895 | 21.3% |
| 65 to 74 years | 17,952 | 11.6% | 4,962 | 13.6% | 2,870 | 12.8% | 485 | 11.5% |
| 75+ years | 2,560 | 1.6% | 625 | 1.7% | 372 | 1.7% | 48 | 1.1% |
| Unknown | 24 | 0.0% | 2,234 | 6.1% | * | * | 333 | 7.9% |
| Region | ||||||||
| Eastern/Central/Western UP | 4,130 | 2.7% | 927 | 2.5% | 1,491 | 6.6% | 207 | 4.9% |
| Northwest LP | 4,954 | 3.2% | 1,287 | 3.5% | 582 | 2.6% | 119 | 2.8% |
| Northeast LP | 2,504 | 1.6% | 598 | 1.6% | 681 | 3.0% | 117 | 2.8% |
| West/West Central | 20,214 | 13.0% | 4,987 | 13.6% | 3,399 | 15.2% | 588 | 14.0% |
| East Central | 7,826 | 5.0% | 1,647 | 4.5% | 1,450 | 6.5% | 228 | 5.4% |
| East | 11,883 | 7.7% | 2,559 | 7.0% | 2,012 | 9.0% | 329 | 7.8% |
| South Central | 5,468 | 3.5% | 1,307 | 3.6% | 652 | 2.9% | 116 | 2.8% |
| Southwest | 9,737 | 6.3% | 2,130 | 5.8% | 1,519 | 6.8% | 272 | 6.5% |
| Southeast | 16,499 | 10.6% | 3,509 | 9.6% | 2,111 | 9.4% | 321 | 7.6% |
| Detroit Metro | 51,467 | 33.2% | 10,756 | 29.4% | 7,270 | 32.4% | 1,288 | 30.6% |
| MI, Unknown Region | – | – | 1,096 | 3.0% | – | – | 120 | 2.9% |
| Non-Michigan | 20,517 | 13.2% | 4,430 | 12.1% | 1,267 | 5.6% | 256 | 6.1% |
| Unknown Region | – | – | 1,384 | 3.8% | – | – | 243 | 5.8% |
| APRN (Advanced Practitioner Registered Nurse) | ||||||||
| Nurse Practitioner | 9,478 | 6.1% | 2,495 | 6.8% | – | – | – | – |
| Anesthetist | 2,830 | 1.8% | 564 | 1.5% | – | – | – | – |
| Midwife | 453 | 0.3% | 168 | 0.5% | – | – | – | – |
| Clinical Specialist | 222 | 0.1% | 1,179 | 3.2% | – | – | – | – |
* Data are suppressed if count is less than 10 or sample population was less than 20.
– Data are not available/data are not applicable.
Education
Highest Level of Nursing-Related Education
| Education Level | RN = 36,519 | LPN = 4,198 | ||
|---|---|---|---|---|
| Estimate | 95% CI | Estimate | 95% CI | |
| LPN diploma/certificate | 0.0% | (0.0%, 0.0%) | 93.4% | (92.6%, 94.1%) |
| RN diploma in nursing | 6.5% | (6.3%, 6.8%) | 0.7% | (0.5%, 1.0%) |
| Associate degree in nursing | 33.6% | (33.1%, 34.0%) | 5.0% | (4.4%, 5.8%) |
| Bachelor’s degree in nursing | 46.5% | (46.0%, 47.0%) | 0.6% | (0.4%, 0.9%) |
| Master’s degree in nursing | 11.7% | (11.4%, 12.1%) | 0.2% | (0.1%, 0.4%) |
| Doctorate in Nursing Practice (DNP) | 1.0% | (0.9%, 1.1%) | 0.0% | (0.0%, 0.1%) |
| Doctor of Nurse Anesthesia (DNAP) | 0.0% | (0.0%, 0.1%) | 0.0% | (0.0%, 0.1%) |
| Doctor of Philosophy in Nursing (PhD) | 0.6% | (0.5%, 0.6%) | 0.0% | (0.0%, 0.1%) |
| Other doctoral degree in nursing | 0.0% | (0.0%, 0.1%) | 0.0% | (0.0%, 0.1%) |
Highest Level of Non-Nursing Education
| Education Level | RN = 35,404 | LPN = 4,138 | ||
|---|---|---|---|---|
| Estimate | 95% CI | Estimate | 95% CI | |
| Non-nursing associate degree | 15.1% | (14.7%, 15.5%) | 27.4% | (26.0%, 28.7%) |
| Non-nursing bachelor’s degree | 16.3% | (16.0%, 16.7%) | 7.4% | (6.6%, 8.2%) |
| Non-nursing master’s degree | 6.0% | (5.8%, 6.3%) | 2.0% | (1.6%, 2.5%) |
| Non-nursing doctoral degree | 0.8% | (0.7%, 0.9%) | 0.4% | (0.2%, 0.6%) |
| Not applicable | 61.8% | (61.3%, 62.3%) | 62.9% | (61.4%, 64.4%) |
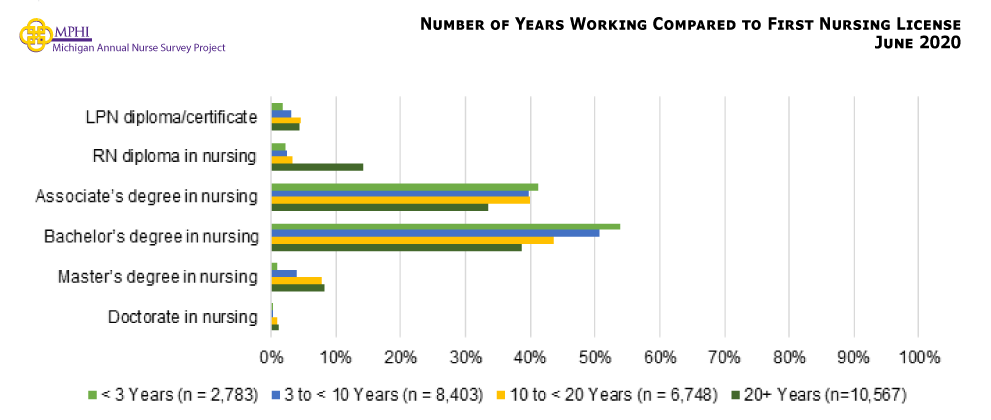
Educational Background that Qualified for First Nursing License
| Education Level | RN = 36,585 | |
|---|---|---|
| Estimate | 95% CI | |
| LPN diploma/certificate | 3.7% | (3.6%, 3.9%) |
| RN diploma in nursing | 9.4% | (9.1%, 9.7%) |
| Associate’s degree in nursing | 37.3% | (36.8%, 37.8%) |
| Bachelor’s degree in nursing | 43.2% | (42.6%, 43.7%) |
| Master’s degree in nursing | 5.8% | (5.6%, 6.0%) |
| Doctorate in Nursing | 0.7% | (0.6%, 0.7%) |
Number of Years Working Compared to First Nursing License
Current Specialty Certifications in Michigan
| Certification | n = 36,617 | |
|---|---|---|
| Estimate | 95% CI | |
| Nurse Anesthetist | 1.1% | (1.0%, 1.2%) |
| Nurse Midwife | 0.3% | (0.3%, 0.4%) |
| Nurse Practitioner | 4.8% | (4.6%, 5.0%) |
| Clinical Nurse Specialist | 2.3% | (2.1%, 2.4%) |
Current Enrollment in Nursing Educational Programs
| Degree | RN = 36,617 | LPN = 4,204 | ||
|---|---|---|---|---|
| Estimate | 95% CI | Estimate | 95% CI | |
| Associate’s Degree in Nursing (ADN) | * | * | 12.9% | (11.9%, 14.0%) |
| Bachelor of Science in Nursing (BSN) | 5.4% | (5.2%, 5.7%) | 2.4% | (2.0%, 2.9%) |
| Master of Science in Nursing (MSN) | 3.8% | (3.6%, 4.0%) | 0.1% | (0.0%, 0.2%) |
| Doctor of Nursing Practice (DNP) | 1.3% | (1.1%, 1.4%) | 0.0% | (0.0%, 0.1%) |
| Doctor of Nurse Anesthesia (DNAP) | 0.1% | (0.1%, 0.2%) | 0.0% | (0.0%, 0.2%) |
| Doctor of Philosophy in Nursing (PhD) | 0.2% | (0.1%, 0.2%) | 0.0% | (0.0%, 0.1%) |
* Data are suppressed if count is less than 10 or sample population was less than 20.
Current Enrollment to Earn Specialty Certification in Nursing
| Certification | RN = 1,388 | |
|---|---|---|
| Estimate | 95% CI | |
| Nurse Practitioner | 80.2% | (78.1%, 82.3%) |
| Nurse Midwife | 2.7% | (2.0%, 3.7%) |
| Nurse Anesthetist | 5.6% | (4.5%, 6.9%) |
| Clinical Nurse Specialist | 11.5% | (9.9%, 13.3%) |
Employment
Current Employment Status
| Employment | RN= 36,617 | LPN = 4,204 | ||
|---|---|---|---|---|
| Estimate | 95% CI | Estimate | 95% CI | |
| Actively employed in nursing or in a position that requires a nurse license full-time | 63.4% | (62.9%, 63.8%) | 60.4% | (58.9%, 61.8%) |
| Actively employed in nursing or in a position that requires a nurse license part-time | 10.9% | (10.5%, 11.2%) | 10.4% | (9.6%, 11.4%) |
| Actively employed in nursing or in a position that requires a nurse license on a per-diem basis | 5.0% | (4.8%, 5.2%) | 3.7% | (3.1%, 4.3%) |
| On temporary medical leave from a position that requires a nurse license | 1.1% | (1.0%, 1.2%) | * | * |
| On temporary non-medical leave from a position that requires a nurse license | 0.8% | (0.7%, 0.9%) | * | * |
| Actively employed in a field other than nursing | 2.7% | (2.5%, 2.8%) | 4.8% | (4.2%, 5.5%) |
| Unemployed, volunteer status only | 0.8% | (0.7%, 0.9%) | * | * |
| Unemployed, seeking work as a nurse | 1.9% | (1.8%, 2.1%) | 3.6% | (3.1%, 4.2%) |
| Unemployed, not seeking work as a nurse | 3.3% | (3.1%, 3.5%) | 3.6% | (3.1%, 4.2%) |
| Retired | 10.2% | (9.9%, 10.6%) | 9.7% | (8.9%, 10.7%) |
* Data are suppressed if count is less than 10 or sample population was less than 20.
Percentage of Nurses Who are Employed by Demographic Characteristics
| Demographics | RN | LPN | ||||
|---|---|---|---|---|---|---|
| n | Estimate | 95% CI | n | Estimate | 95% CI | |
| Total | 36,617 | 79.2% | (78.8%, 79.6%) | 4,204 | 74.5% | (73.2%, 75.8%) |
| Age | ||||||
| <25 years | 520 | 94.2% | (92.2%, 96.2%) | 50 | 84.0% | (73.8%, 94.1%) |
| 25 to 34 years | 6,203 | 91.2% | (90.5%, 91.9%) | 626 | 87.4% | (84.8%, 90.0%) |
| 35 to 44 years | 7,217 | 89.7% | (89.0%, 90.4%) | 885 | 84.3% | (81.9%, 86.7%) |
| 45 to 54 years | 6,956 | 88.9% | (88.2%, 89.7%) | 882 | 84.6% | (82.2%, 87.0%) |
| 55 to 64 years | 7,900 | 74.9% | (73.9%, 75.8%) | 895 | 68.0% | (65.0%, 71.1%) |
| 65+ years | 5,587 | 34.0% | (32.8%, 35.3%) | 533 | 38.8% | (34.7%, 43.0%) |
| Gender | ||||||
| Female | 31,913 | 78.7% | (78.3%, 79.2%) | 3,668 | 74.5% | (73.1%, 75.9%) |
| Male | 3,110 | 84.5% | (83.2%, 85.8%) | 269 | 75.6% | (70.4%, 80.7%) |
| Other | 46 | 74.7% | (62.1%, 87.3%) | * | * | * |
| Race | ||||||
| White | 31,390 | 78.8% | (78.4%, 79.3%) | 2,765 | 71.3% | (69.6%, 73.0%) |
| Black or African American | 2,028 | 82.6% | (81.0%, 84.3%) | 993 | 82.2% | (79.9%, 84.6%) |
| Other | 2,178 | 82.9% | (81.4%, 84.5%) | 280 | 77.5% | (72.6%, 82.4%) |
| Hispanic or Latino | ||||||
| Yes | 756 | 85.8% | (83.3%, 88.3%) | 119 | 80.1% | (73.0%, 87.3%) |
| No | 34,011 | 79.1% | (78.7%, 79.6%) | 3,783 | 74.3% | (72.9%, 75.7%) |
| Arabic/Chaldean or Other Middle Eastern Descent | ||||||
| Yes | 484 | 84.5% | (81.3%, 87.7%) | 25 | 70.9% | (53.1%, 88.7%) |
| No | 34,258 | 79.2% | (78.7%, 79.6%) | 3,872 | 74.6% | (73.2%, 75.9%) |
| Residence | ||||||
| Upper Peninsula | 927 | 81.8% | (79.4%, 84.3%) | 207 | 77.8% | (72.1%, 83.5%) |
| Northwest LP | 1,287 | 74.1% | (71.7%, 76.5%) | 119 | 64.5% | (55.9%, 73.1%) |
| Northeast LP | 598 | 75.0% | (71.5%, 78.5%) | 117 | 76.2% | (68.5%, 83.9%) |
| West/West Central | 4,987 | 80.1% | (79.0%, 81.2%) | 588 | 72.8% | (69.3%, 76.4%) |
| East Central | 1,647 | 80.2% | (78.2%, 82.1%) | 228 | 73.7% | (68.0%, 79.4%) |
| East | 2,559 | 80.5% | (79.0%, 82.1%) | 329 | 68.0% | (63.0%, 73.1%) |
| South Central | 1,307 | 79.4% | (77.2%, 81.5%) | 116 | 75.9% | (68.1%, 83.7%) |
| Southwest | 2,130 | 78.9% | (77.2%, 80.6%) | 272 | 77.3% | (72.3%, 82.3%) |
| Southeast | 3,509 | 78.4% | (77.0%, 79.8%) | 321 | 77.9% | (73.3%, 82.4%) |
| Detroit Metro | 10,756 | 79.7% | (79.0%, 80.5%) | 1,288 | 76.3% | (74.0%, 78.6%) |
| Michigan Residence** | 30,803 | 77.9% | (77.5%, 78.4%) | 3,705 | 75.4% | (74.0%, 76.7%) |
| Non-Michigan Residence | 4,430 | 74.9% | (73.6%, 76.1%) | 256 | 65.3% | (59.4%, 71.1%) |
* Data are suppressed if count is less than 10 or sample population was less than 20.
**Includes individuals who indicated they live in Michigan but did not provide a zip code.
Demographic Characteristics of Employed Nurses
| Demographics | RN = 27,276 | LPN = 2,952 | ||
|---|---|---|---|---|
| Estimate | 95% CI | Estimate | 95% CI | |
| Age | ||||
| <25 years | 2.7% | (2.5%, 2.9%) | 2.0% | (1.5%, 2.5%) |
| 25 to 34 years | 23.0% | (22.5%, 23.5%) | 20.2% | (18.8%, 21.7%) |
| 35 to 44 years | 23.6% | (23.1%, 24.1%) | 25.1% | (23.5%, 26.7%) |
| 45 to 54 years | 23.6% | (23.1%, 24.2%) | 23.8% | (22.3%, 25.3%) |
| 55 to 64 years | 21.4% | (20.9%, 21.9%) | 21.5% | (20.0%, 23.0%) |
| 65+ years | 5.7% | (5.4%, 6.0%) | 7.5% | (6.6%, 8.5%) |
| Gender | ||||
| Female | 90.5% | (90.1%, 90.8%) | 92.8% | (91.8%, 93.7%) |
| Male | 9.4% | (9.1%, 9.7%) | 7.0% | (6.1%, 7.9%) |
| Other | 0.1% | (0.1%, 0.1%) | 0.2% | (0.1%, 0.4%) |
| Race | ||||
| White | 89.9% | (89.5%, 90.2%) | 68.0% | (66.3%, 69.7%) |
| Black | 6.0% | (5.8%, 6.3%) | 28.1% | (26.5%, 29.7%) |
| Other | 6.4% | (6.1%, 6.7%) | 7.3% | (6.4%, 8.3%) |
| Hispanic or Latino | ||||
| Yes | 2.4% | (2.2%, 2.6%) | 3.3% | (2.7%, 4.0%) |
| No | 97.6% | (97.4%, 97.8%) | 96.7% | (96.0%, 97.3%) |
| Arabic/Chaldean or Other Middle Eastern Descent | ||||
| Yes | 1.5% | (1.4%, 1.6%) | 0.6% | (0.4%, 1.0%) |
| No | 98.5% | (98.4%, 98.6%) | 99.4% | (99.0%, 99.6%) |
Region of Residency & Employment among Michigan Nurses
| Region | RNs | LPNs | ||||||
|---|---|---|---|---|---|---|---|---|
| Place of Residency | Place of Employment | Place of Residency | Place of Employment | |||||
| Estimate | 95% CI | Estimate | 95% CI | Estimate | 95% CI | Estimate | 95% CI | |
| Upper Peninsula | 2.7% | (2.6%, 2.9%) | 2.8% | (2.6%, 3.0%) | 7.0% | (6.1%, 8.0%) | 7.1% | (6.2%, 8.1%) |
| Northwest LP | 3.0% | (2.8%, 3.2%) | 3.0% | (2.8%, 3.2%) | 2.2% | (1.7%, 2.8%) | 2.4% | (1.9%, 3.0%) |
| Northeast LP | 1.5% | (1.4%, 1.7%) | 1.4% | (1.3%, 1.5%) | 3.0% | (2.4%, 3.7%) | 2.9% | (2.4%, 3.6%) |
| West/West Central | 13.1% | (12.7%, 13.6%) | 12.9% | (12.5%, 13.3%) | 14.9% | (13.6%, 16.2%) | 14.8% | (13.5%, 16.1%) |
| East Central | 5.1% | (4.8%, 5.4%) | 5.3% | (5.0%, 5.6%) | 6.4% | (5.6%, 7.4%) | 6.1% | (5.3%, 7.0%) |
| East | 7.8% | (7.5%, 8.1%) | 6.6% | (6.3%, 6.9%) | 8.2% | (7.3%, 9.3%) | 6.7% | (5.8%, 7.6%) |
| South Central | 3.5% | (3.3%, 3.8%) | 3.8% | (3.6%, 4.1%) | 3.0% | (2.4%, 3.7%) | 3.2% | (2.6%, 3.9%) |
| Southwest | 6.2% | (5.9%, 6.5%) | 6.3% | (6.0%, 6.6%) | 7.1% | (6.2%, 8.1%) | 6.7% | (5.9%, 7.7%) |
| Southeast | 10.5% | (10.1%, 10.9%) | 12.3% | (12.0%, 12.7%) | 9.9% | (8.9%, 11.0%) | 9.8% | (8.8%, 10.9%) |
| Detroit Metro | 33.3% | (32.7%, 33.9%) | 32.7% | (32.1%, 33.2%) | 33.4% | (31.7%, 35.1%) | 34.8% | (33.1%, 36.5%) |
| Outside MI | 13.2% | (12.8%, 13.6%) | 12.9% | (12.5%, 13.3%) | 5.0% | (4.3%, 5.9%) | 5.5% | (4.7%, 6.4%) |
Reason Primary Place of Employment is Outside of Michigan
| Reason | RN = 3,311 | LPN = 181 | ||
|---|---|---|---|---|
| Estimate | 95% CI | Estimate | 95% CI | |
| Scope of practice regulation is more favorable outside of Michigan | 6.6% | (5.8%, 7.5%) | 5.3% | (2.9%, 9.7%) |
| Taking care of home and family | 15.5% | (14.3%, 16.7%) | 16.3% | (11.6%, 22.3%) |
| School | 1.4% | (1.0%, 1.8%) | 1.6% | (0.6%, 4.7%) |
| Difficulty finding a nursing position | 5.1% | (4.4%, 5.9%) | 10.0% | (6.4%, 15.2%) |
| Semi-retired | 2.5% | (2.0%, 3.1%) | 3.6% | (1.7%, 7.4%) |
| Better Opportunity, Pay, or Benefits | 3.2% | (2.6%, 3.8%) | 5.2% | (2.8%, 9.5%) |
| Military | 0.8% | (0.5%, 1.2%) | 0.6% | (0.1%, 3.2%) |
| Other | 67.1% | (65.5%, 68.7%) | 59.0% | (51.7%, 65.9%) |
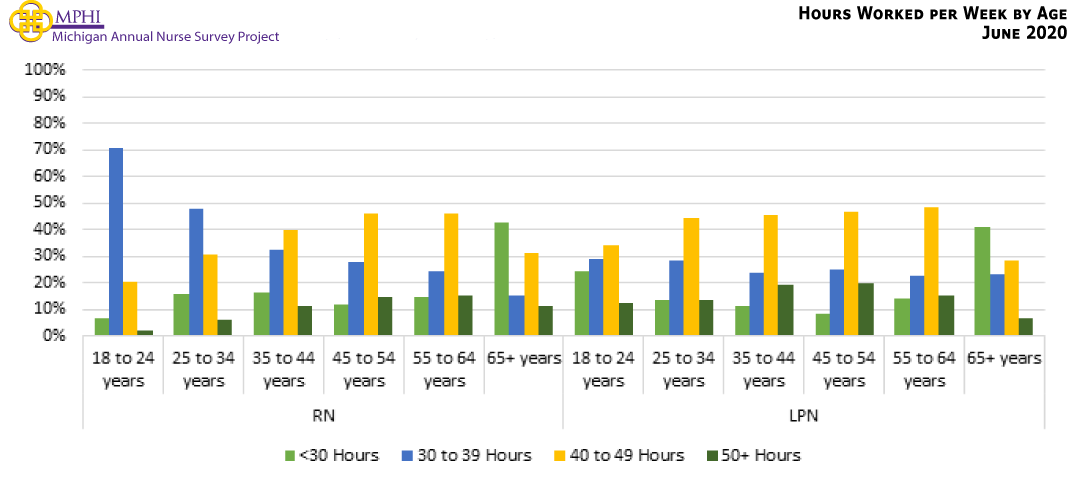
Hours Worked per Week by Age
Number of Currently Employed Nursing Positions
| Number of Positions | RN = 28,398 | LPN = 3,134 | ||
|---|---|---|---|---|
| Estimate | 95% CI | Estimate | 95% CI | |
| 1 Position | 86.3% | (85.9%, 86.7%) | 81.6% | (80.2%, 82.9%) |
| 2 Position | 11.7% | (11.3%, 12.1%) | 15.6% | (14.4%, 16.9%) |
| 3+ Positions | 2.0% | (1.8%, 2.2%) | 2.8% | (2.2%, 3.4%) |
Number of Years Working as a Nurse (RN and LPN)
| Years | RN = 27,834 | LPN = 3,019 | ||
|---|---|---|---|---|
| Estimate | 95% CI | Estimate | 95% CI | |
| Less than 3 years | 11.1% | (10.7%, 11.5%) | 15.7% | (14.4%, 17.0%) |
| 3 to less than 10 years | 30.5% | (30.0%, 31.1%) | 34.0% | (32.3%, 35.7%) |
| 10 to less than 20 years | 23.4% | (22.9%, 23.9%) | 23.4% | (21.9%, 24.9%) |
| 20 or more years | 35.0% | (34.4%, 35.5%) | 26.9% | (25.3%, 28.4%) |
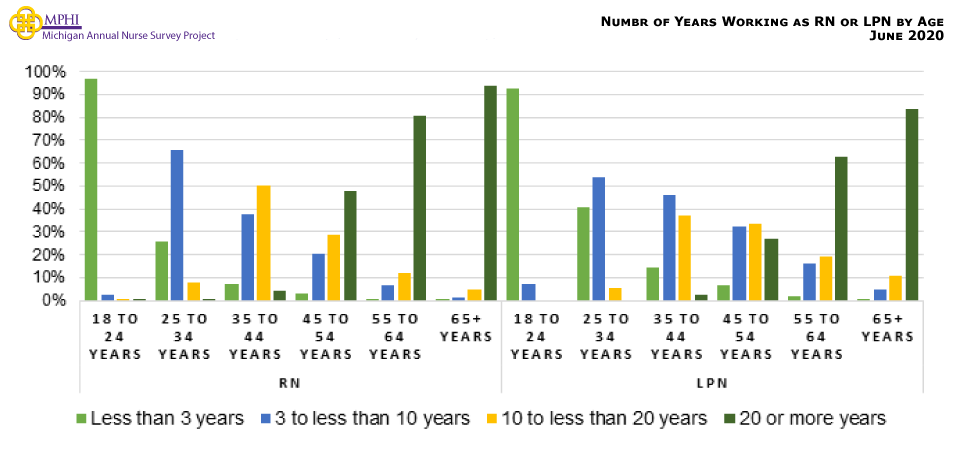
Number of Years Working as a Nurse Compared to Age (RN and LPN)
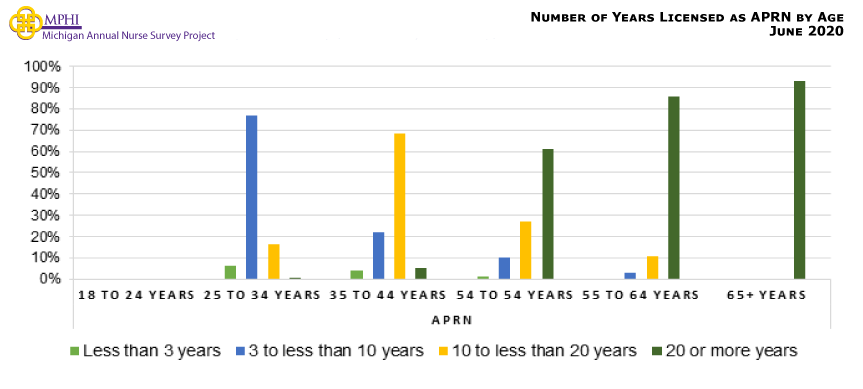
Number of Years Working as a Nurse (APRNs only)
| Years | APRN = 2,758 | |
|---|---|---|
| Estimate | 95% CI | |
| Less than 3 years | 1.0% | (0.7%, 1.4%) |
| 3 to less than 10 years | 24.4% | (22.8%, 26.0%) |
| 10 to less than 20 years | 33.6% | (31.8%, 35.3%) |
| 20 or more years | 41.1% | (39.3%, 42.9%) |
Number of Years Working as a Nurse Compared to Age (APRN)
New Nurses Experience
Preparedness for Entering Nursing Workforce
| Level of Preparedness | RN = 2,698 | LPN = 455 | ||
|---|---|---|---|---|
| Estimate | 95% CI | Estimate | 95% CI | |
| Adequately prepared | 54.7% | (52.8%, 56.5%) | 63.6% | (59.1%, 67.9%) |
| Not enough classroom time | 1.8% | (1.4%, 2.4%) | * | * |
| Not enough clinical time | 29.6% | (27.9%, 31.3%) | * | * |
| Not enough skills lab/simulation time | 15.3% | (14.0%, 16.7%) | 15.0% | (12.0%, 18.6%) |
| Not enough critical thinking/ prioritization practice | 21.3% | (19.8%, 22.9%) | 13.6% | (10.7%, 17.0%) |
| Other | 2.7% | (2.1%, 3.4%) | * | * |
* Data are suppressed if count is less than 10 or sample population was less than 20.
Adequately Preparedness for Entering Nursing Workforce by Region
| Region | RNs | LPNs | ||||
|---|---|---|---|---|---|---|
| N | % | 95% CI | N | % | 95% CI | |
| Upper Peninsula | 79 | 45.8% | (35.3%, 56.7%) | 19 | 46.8% | (26.9%, 67.8%) |
| Northwest LP | 78 | 67.1% | (56.0%, 76.5%) | 10 | 77.6% | (46.6%, 93.2%) |
| Northeast LP | 34 | 47.1% | (31.5%, 63.3%) | * | * | * |
| West/West Central | 444 | 53.3% | (48.7%, 57.9%) | 35 | 64.4% | (47.9%, 78.1%) |
| East Central | 129 | 61.5% | (52.9%, 69.5%) | 14 | 93.4% | (69.2%, 98.9%) |
| East | 217 | 56.7% | (50.0%, 63.1%) | 18 | 68.5% | (45.5%, 85.0%) |
| South Central | 87 | 59.8% | (49.3%, 69.5%) | 20 | 48.1% | (28.4%, 68.5%) |
| Southwest | 149 | 49.4% | (41.5%, 57.3%) | 20 | 53.3% | (32.7%, 72.8%) |
| Southeast | 265 | 58.1% | (52.1%, 63.9%) | 34 | 78.5% | (62.2%, 89.0%) |
| Detroit Metro | 887 | 52.5% | (49.2%, 55.8%) | 232 | 59.7% | (53.3%, 65.8%) |
| Lives in Michigan | 2,502 | 54.2% | (52.2%, 56.1%) | 427 | 63.2% | (58.6%, 67.7%) |
| Lives Outside of Michigan | 145 | 63.7% | (55.7%, 71.1%) | 15 | 72.9% | (47.7%, 88.9%) |
* Data are suppressed if count is less than 10 or sample population was less than 20.
Finding Employment for Nurses Entering Workforce
| RN = 2,707 | LPN = 455 | |||
|---|---|---|---|---|
| Estimate | 95% CI | Estimate | 95% CI | |
| Difficulty Finding a Nursing Position | ||||
| Very difficult | 0.8% | (0.6%, 1.3%) | 0.5% | (0.1%, 1.6%) |
| Difficult | 7.3% | (6.4%, 8.3%) | 3.8% | (2.4%, 6.0%) |
| Neutral | 24.3% | (22.7%, 26.0%) | 17.5% | (14.3%, 21.3%) |
| Easy | 38.2% | (36.4%, 40.1%) | 34.0% | (29.8%, 38.5%) |
| Very easy | 29.3% | (27.7%, 31.1%) | 44.2% | (39.7%, 48.8%) |
| Difficulty Finding a Nursing Position in Preferred Practice Area | ||||
| Very difficult | 8.0% | (7.0%, 9.1%) | 6.1% | (4.3%, 8.7%) |
| Difficult | 21.6% | (20.1%, 23.2%) | 10.6% | (8.1%, 13.8%) |
| Neutral | 31.2% | (29.5%, 32.9%) | 34.3% | (30.1%, 38.8%) |
| Easy | 25.9% | (24.3%, 27.6%) | 23.5% | (19.8%, 27.6%) |
| Very easy | 13.2% | (12.0%, 14.6%) | 25.5% | (21.7%, 29.7%) |
| Had a Residency Placement as Part of Nursing Program | ||||
| Yes | 34.8% | (33.0%, 36.6%) | 11.2% | (8.6%, 14.4%) |
| No | 65.2% | (63.4%, 67.0%) | 88.8% | (85.6%, 91.4%) |
| Satisfaction with Orientation at Place of Employment | ||||
| Very dissatisfied | 2.8% | (2.2%, 3.5%) | 8.7% | (6.5%, 11.7%) |
| Dissatisfied | 8.6% | (7.6%, 9.7%) | 13.0% | (10.2%, 16.4%) |
| Neutral | 20.4% | (18.9%, 21.9%) | 28.2% | (24.3%, 32.5%) |
| Satisfied | 50.1% | (48.2%, 52.0%) | 32.9% | (28.7%, 37.3%) |
| Very satisfied | 18.2% | (16.8%, 19.7%) | 17.1% | (14.0%, 20.9%) |
Plans to Continue Working
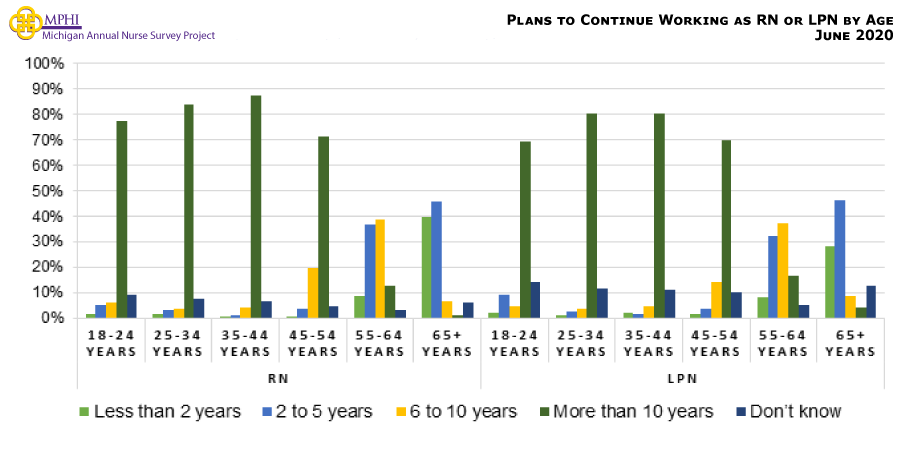
Plans to Continue Working as a Nurse (RN and LPN)
| Years | RN = 27,802 | LPN = 3,013 | ||
|---|---|---|---|---|
| Estimate | 95% CI | Estimate | 95% CI | |
| Less than 2 years | 4.8% | (4.6%, 5.1%) | 5.1% | (4.3%, 5.9%) |
| 2 to 5 years | 12.4% | (12.0%, 12.8%) | 12.6% | (11.4%, 13.8%) |
| 6 to 10 years | 15.3% | (14.9%, 15.7%) | 14.1% | (12.8%, 15.3%) |
| More than 10 years | 61.6% | (61.0%, 62.2%) | 58.1% | (56.4%, 59.9%) |
| Don’t know | 5.8% | (5.6%, 6.1%) | 10.1% | (9.0%, 11.2%) |
Plans to Continue to Practice Nursing (in years) by Age (RN and LPN)
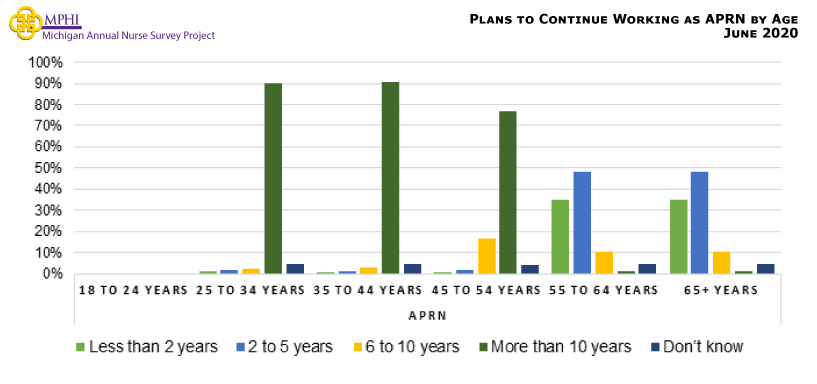
Plans to Continue Working as a Nurse (APRN)
| Years | APRN = 3,569 | |
|---|---|---|
| Estimate | 95% CI | |
| Less than 2 years | 4.1% | (3.9%, 4.3%) |
| 2 to 5 years | 10.5% | (10.1%, 10.8%) |
| 6 to 10 years | 13.7% | (13.3%, 14.1%) |
| More than 10 years | 67.5% | (67.0%, 68.1%) |
| Don’t know | 4.1% | (3.9%, 4.4%) |
Plans to Continue to Practice Nursing (in years) by Age (APRN)
Plans to Work 5 Years or Less by Region
| Region | RNs | LPNs | ||||
|---|---|---|---|---|---|---|
| N | % | 95% CI | N | % | 95% CI | |
| Upper Peninsula | 699 | 20.4% | (17.6%, 23.5%) | 153 | 24.8% | (18.7%, 32.2%) |
| Northwest LP | 903 | 22.0% | (19.4%, 24.8%) | 72 | 23.6% | (15.3%, 34.5%) |
| Northeast LP | 412 | 21.9% | (18.2%, 26.1%) | 84 | 15.4% | (9.2%, 24.6%) |
| West/West Central | 3,713 | 16.6% | (15.4%, 17.8%) | 393 | 23.5% | (19.6%, 28.0%) |
| East Central | 1,230 | 14.8% | (12.9%, 16.9%) | 153 | 19.0% | (13.5%, 25.9%) |
| East | 1,934 | 17.2% | (15.6%, 18.9%) | 214 | 17.7% | (13.2%, 23.4%) |
| South Central | 977 | 16.9% | (14.7%, 19.4%) | 81 | 21.2% | (13.7%, 31.3%) |
| Southwest | 1,569 | 20.3% | (18.4%, 22.4%) | 190 | 18.7% | (13.8%, 24.9%) |
| Southeast | 2,552 | 19.2% | (17.7%, 20.8%) | 230 | 20.1% | (15.4%, 25.7%) |
| Detroit Metro | 7,880 | 18.6% | (17.8%, 19.5%) | 864 | 17.2% | (14.8%, 19.9%) |
| Lives in Michigan | 22,654 | 18.0% | (17.8%, 18.8%) | 2,505 | 19.6% | (18.1%, 21.2%) |
| Lives Outside of Michigan | 3,148 | 19.0% | (17.7%, 20.4%) | 153 | 22.8% | (16.8%, 30.0%) |
Reasons for Leaving Nursing for those Leaving Nursing in Less than 5 Years
| Reason | RN = 5,228 | LPN = 519 | ||
|---|---|---|---|---|
| Estimate | 95% CI | Estimate | 95% CI | |
| Retiring | 84.5% | (83.5%, 85.4%) | 80.7% | (77.1%, 83.9%) |
| Enrolled in education program | 4.6% | (4.1%, 5.2%) | 5.0% | (3.5%, 7.3%) |
| Difficulty finding a nursing position | 0.6% | (0.4%, 0.8%) | 0.6% | (0.2%, 1.7%) |
| Too stressful/Workload | 16.3% | (15.4%, 17.4%) | 19.9% | (16.7%, 23.5%) |
| Difficulties with EMR/new technology | 1.5% | (1.2%, 1.9%) | 0.4% | (0.1%, 1.4%) |
| Violence/safety issues | 4.5% | (3.9%, 5.0%) | 4.5% | (3.0%, 6.7%) |
| Other | 2.9% | (2.5%, 3.4%) | 3.9% | (2.6%, 6.0%) |
Direct Care
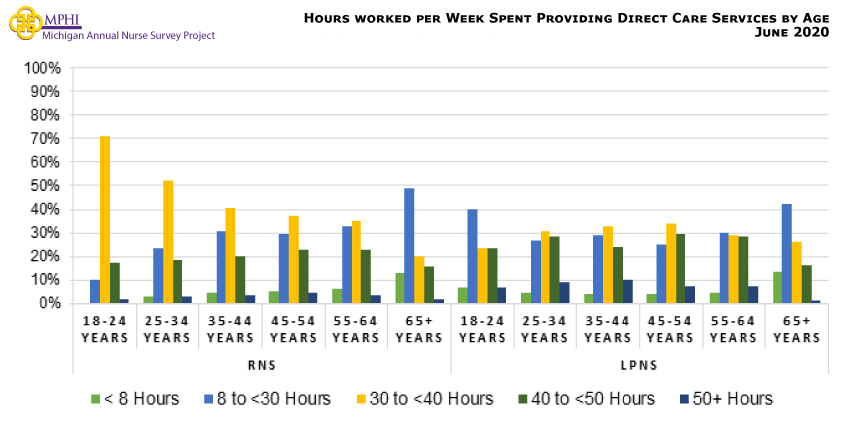
Hours per Week Spent Providing Direct Care Services
| Hours | RN = 20,527 | LPN = 2,462 | ||
|---|---|---|---|---|
| Estimate | 95% CI | Estimate | 95% CI | |
| <8 Hours | 4.7% | (04.4%, 05.0%) | 5.0% | (04.1%, 05.8%) |
| 8 to <30 Hours | 28.9% | (28.2%, 29.5%) | 28.7% | (26.9%, 30.4%) |
| 30 to <40 Hours | 42.3% | (41.6%, 42.9%) | 31.2% | (29.4%, 33.1%) |
| 40 to <50 Hours | 20.4% | (19.8%, 20.9%) | 26.5% | (24.8%, 28.3%) |
| 50+ Hours | 3.4% | (3.1%, 3.6%) | 8.2% | (7.1%, 9.2%) |
Hours per Week Spent Providing Direct Care Services by Age
Plans to Stop Working in the Next Five Years by Nurses who Provide Direct Care
| Provides Direct Care for 8+ Hours/Week | RN = 13,621 | LPN = 1,564 | ||||
|---|---|---|---|---|---|---|
| n | Estimate | 95% CI | n | Estimate | 95% CI | |
| Yes | 12,427 | 12.2% | (11.7%, 12.8%) | 1,401 | 15.0% | (13.3%, 16.8%) |
| No | 1,194 | 22.1% | (21.4%, 22.8%) | 163 | 21.9% | (19.8%, 23.9%) |
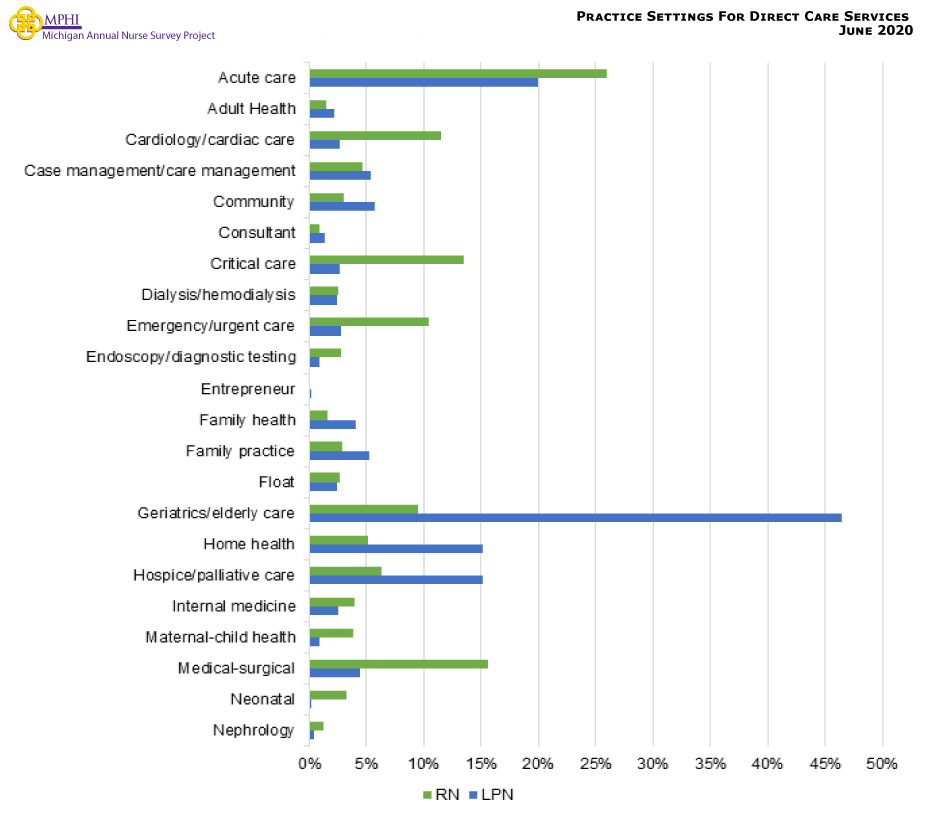
Direct Care Services
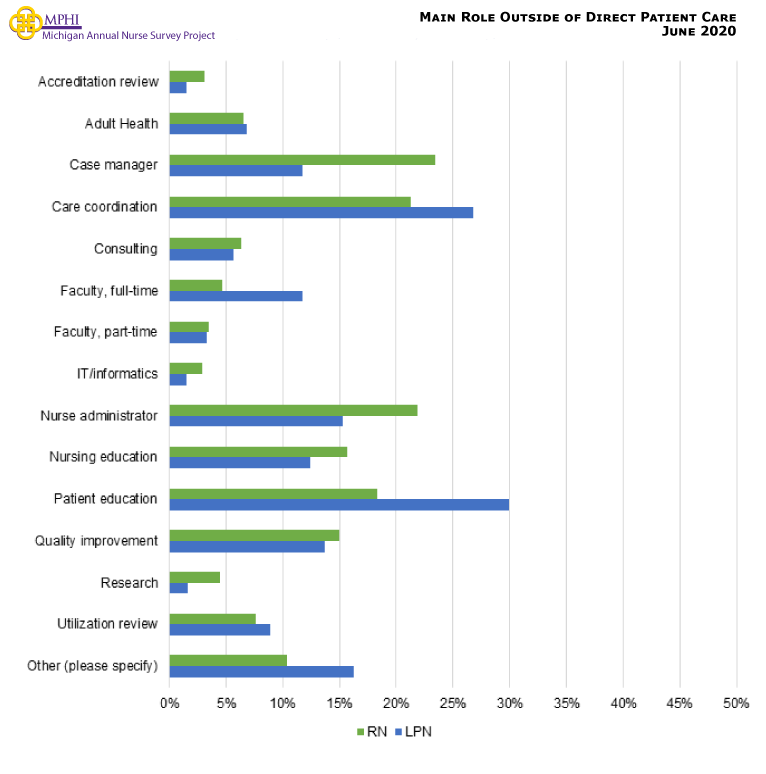
Main Role Outside of Direct Patient Care
Practice Setting
Workplace Setting (Inpatient, Community-Based, and Education)
| Workplace Setting | RN = 28,454 | LPN = 3,142 | ||
|---|---|---|---|---|
| Estimate | 95% CI | Estimate | 95% CI | |
| Inpatient | 57.4% | (56.9%, 58.0%) | 58.4% | (56.7%, 60.1%) |
| Community-based | 20.7% | (20.3%, 21.2%) | 27.7% | (26.1%, 29.2%) |
| Education | 4.8% | (04.5%, 05.0%) | 3.0% | (2.4%, 3.6%) |
| Other** | 19.9% | (19.4%, 20.3%) | 16.5% | (15.2%, 17.8%) |
*Nurses may work in multiple settings.
**Other was not a response option and was created from nurses who answered no to each of the above employment settings.
Inpatient Settings
| Inpatient Settings | RN = 16,444 | LPN = 1,905 | ||
|---|---|---|---|---|
| Estimate | 95% CI | Estimate | 95% CI | |
| Assisted living facility | 1.3% | (1.1%, 1.4%) | 17.6% | (16.0%, 19.4%) |
| Behavioral health facility/psychiatric | 4.3% | (4.0%, 4.6%) | 6.7% | (5.6%, 7.9%) |
| Correctional system | 0.6% | (0.5%, 0.8%) | 2.3% | (1.8%, 3.1%) |
| Home health care | 0.4% | (0.3%, 0.5%) | 3.6% | (2.8%, 4.5%) |
| Hospice | 1.8% | (1.6%, 2.0%) | 5.1% | (4.2%, 6.2%) |
| Hospital (acute care & acute rehabilitation) | 83.7% | (83.1%, 84.2%) | 15.0% | (13.4%, 16.6%) |
| Nursing home/long-term care facility | 8.9% | (8.5%, 9.4%) | 72.8% | (70.7%, 74.7%) |
| Traveling/staffing agency | 2.6% | (2.4%, 2.8%) | 4.9% | (4.0%, 5.9%) |
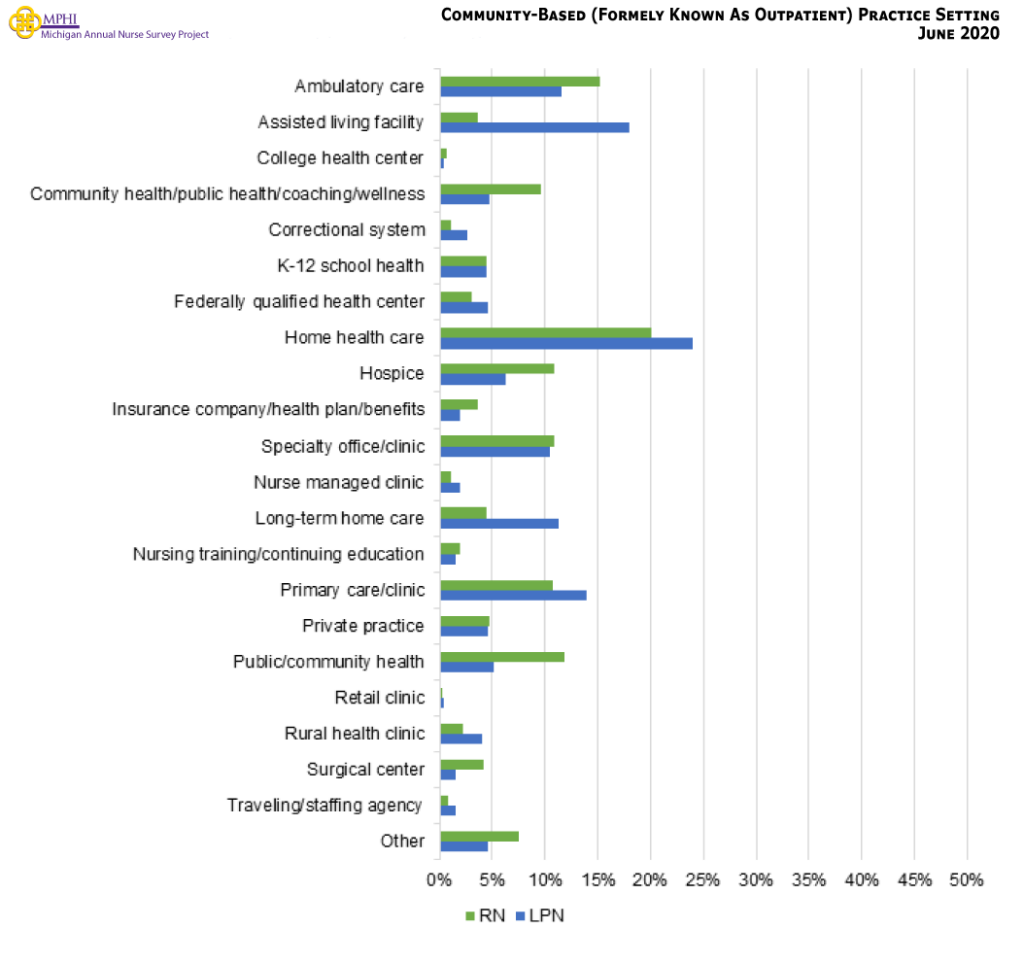
Community-Based Practice Setting
Academia Settings
| Academia Settings | RN = 1,402 | LPN = 90 | ||
|---|---|---|---|---|
| Estimate | 95% CI | Estimate | 95% CI | |
| ADN Educator | 13.7% | (12.0%, 15.6%) | 2.3% | (0.6%, 7.8%) |
| BSN Educator | 24.8% | (22.6%, 27.1%) | 1.2% | (0.2%, 6.2%) |
| CNS Educator | 1.4% | (0.9%, 2.1%) | 1.0% | (0.2%, 5.9%) |
| NP Educator | 5.6% | (4.5%, 6.9%) | 2.3% | (0.6%, 7.8%) |
| Nurse Anesthetist Educator | 0.6% | (0.3%, 1.2%) | 0.0% | (0.0%, 4.1%) |
| Nurse Midwife Educator | 0.3% | (0.1%, 0.8%) | 0.0% | (0.0%, 4.1%) |
| Simulations & Patient Education | 18.3% | (16.4%, 20.5%) | 20.0% | (13.1%, 29.5%) |
| Clinical/didactic | 26.6% | (24.3%, 28.9%) | 21.8% | (14.6%, 31.4%) |
| Administration & Research | 17.1% | (15.3%, 19.2%) | 18.6% | (11.9%, 27.9%) |
| Faculty | 29.5% | (27.1%, 31.9%) | 17.4% | (10.9%, 26.5%) |
| Adjunct | 20.0% | (18.0%, 22.2%) | 7.2% | (3.4%, 14.5%) |
| Other | 16.0% | (14.2%, 18.0%) | 31.3% | (22.6%, 41.4%) |
Change in Employment Setting
| Change in Employment Setting | RN = 26,990 | LPN = 2,952 | ||
|---|---|---|---|---|
| Estimate | 95% CI | Estimate | 95% CI | |
| Did not make a change | 59.3% | (58.3%, 60.2%) | 58.4% | (55.6%, 61.1%) |
| Made a change | 40.7% | (39.8%, 41.7%) | 41.6% | (38.9%, 44.4%) |
| Of those who made a change: | ||||
| An inpatient setting to a community-based setting? | 12.9% | (12.2%, 13.5%) | 11.8% | (10.1%, 13.7%) |
| A community-based setting to an inpatient setting? | 4.7% | (4.3%, 5.1%) | 5.6% | (4.5%, 7.1%) |
| A primary care setting (e.g., family practice, general medicine) to a specialty care setting? | 4.5% | (4.1%, 4.9%) | 6.3% | (5.1%, 7.8%) |
| A specialty care setting to a primary care setting? | 2.7% | (2.4%, 3.0%) | 3.9% | (2.9%, 5.1%) |
| A sub-acute care setting to an acute care setting? | 3.3% | (3.0%, 3.7%) | 3.3% | (2.4%, 4.5%) |
| An acute care setting to a sub-acute care setting? | 2.6% | (2.3%, 2.9%) | 3.1% | (2.3%, 4.2%) |
| A direct patient care setting to a non-direct patient care setting? | 12.7% | (12.1%, 13.3%) | 9.8% | (8.3%, 11.6%) |
| A non-direct patient care setting to a direct patient care setting? | 4.9% | (4.5%, 5.4%) | 5.3% | (4.2%, 6.7%) |
| I changed locations but stayed in the same care setting. | 31.5% | (30.6%, 32.4%) | 36.7% | (34.0%, 39.4%) |
| Some other type of change in employment. | 28.6% | (27.8%, 29.5%) | 25.5% | (23.1%, 28.0%) |
Plans to Stop Working in the Next Five Years by Employment Setting
| Plans to Stop Working in Next 5 Years | RN | LPN | ||||
|---|---|---|---|---|---|---|
| n | Estimate | 95% CI | n | Estimate | 95% CI | |
| Inpatient | 14,704 | 16.2% | (15.6%, 16.8%) | 1,561 | 23.6% | (21.5%, 25.7%) |
| Community-based | 5,667 | 14.5% | (13.6%, 15.4%) | 772 | 16.2% | (13.6%, 18.8%) |
| Education | 1,337 | 27.8% | (25.4%, 30.2%) | 83 | 25.7% | (16.3%, 35.1%) |
| Other** | 5,228 | 23.4% | (22.3%, 24.6%) | 443 | 28.7% | (24.5%, 33.0%) |
*Nurses may work in multiple settings.
**Other was not a response option and was created from nurses who answered no to each of the above employment settings.
Workplace Violence
Demographics of those Nurses who Experienced Workplace Violence in the Past Year
| Characteristics | RNs | LPNs |
|---|---|---|
| Total | 35.6% | 25.1% |
| Age | ||
| <25 years | 53.9% | 23.9% |
| 25 to 34 years | 46.5% | 25.1% |
| 35 to 44 years | 38.0% | 27.8% |
| 45 to 54 years | 32.1% | 23.0% |
| 55 to 64 years | 27.6% | 28.0% |
| 65+ years | 17.5% | 14.5% |
| Unknown | 37.5% | 0.0% |
| Gender | ||
| Female | 34.9% | 24.8% |
| Male | 42.4% | 27.9% |
| Ethnicity | ||
| Hispanic/Latino | 38.8% | 26.6% |
| Arabic, Chaldean, or of other Middle Eastern descent | 37.1% | 29.0% |
| Race | ||
| White | 36.6% | 27.7% |
| Black | 26.5% | 19.9% |
| American Indian | 44.8% | 19.4% |
| Asian Pacific Islander | 27.8% | 20.9% |
| Other | 39.0% | 25.2% |
| Employment Region | ||
| Eastern/Central/Western UP | 35.1% | 27.0% |
| Northwest LP | 37.4% | 21.7% |
| Northeast LP | 35.3% | 24.6% |
| West/West Central | 38.4% | 27.5% |
| East Central | 38.8% | 34.0% |
| East | 39.9% | 29.9% |
| South Central | 41.8% | 33.8% |
| Southwest | 41.9% | 30.7% |
| Southeast | 34.3% | 25.8% |
| Detroit Metro | 35.4% | 21.1% |
| Outside of MI | 24.1% | 19.5% |
| Unknown MI Region | 37.1% | 19.8% |
| Region of Residence | ||
| Upper Peninsula | 33.7% | 26.7% |
| Northwest LP | 37.7% | 19.1% |
| Northeast LP | 34.4% | 22.9% |
| West/West Central | 38.9% | 27.7% |
| East Central | 39.9% | 31.1% |
| East | 39.3% | 33.7% |
| South Central | 41.1% | 33.6% |
| Southwest | 40.2% | 29.2% |
| Southeast | 35.2% | 26.1% |
| Detroit Metro | 34.9% | 20.4% |
| Non-Michigan Residence | 24.6% | 21.1% |
| Unknown MI Region | 40.5% | 21.2% |
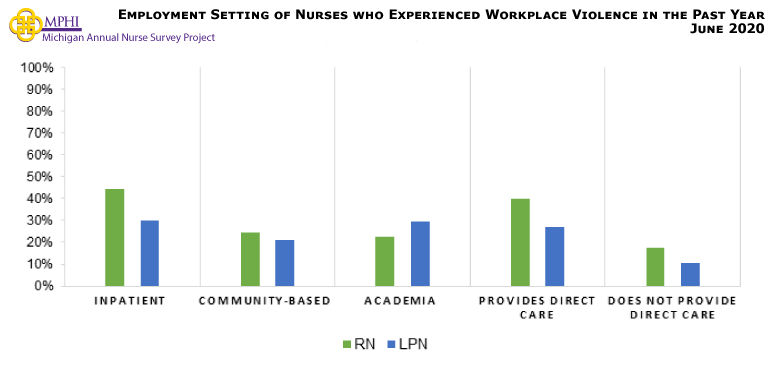
Employment Setting of Nurses who Experienced Workplace Violence in the Past Year
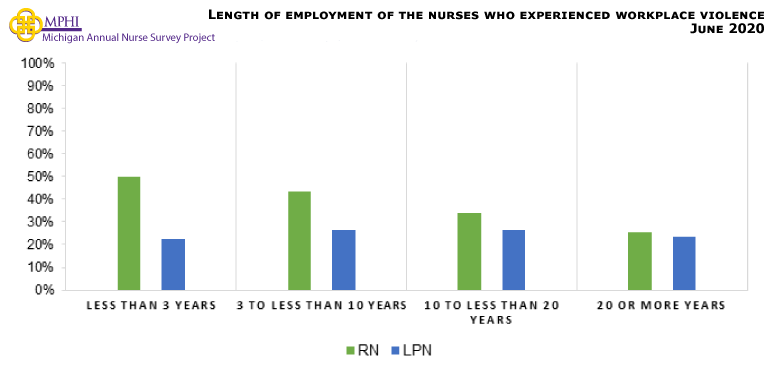
Length of Employment of the Nurses who Experienced Workplace Violence
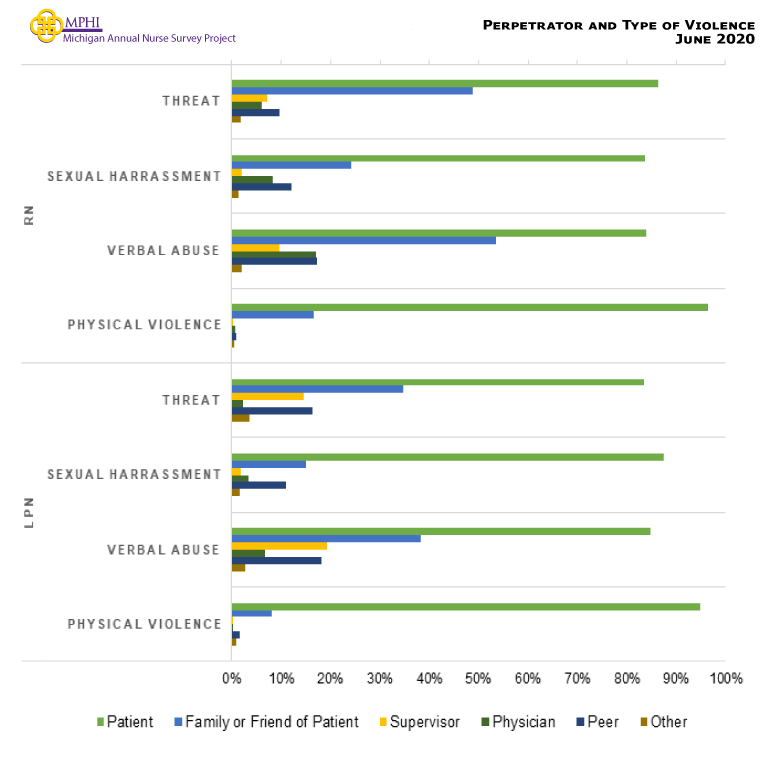
Perpetrator and Type of Violence Experienced by Nurses
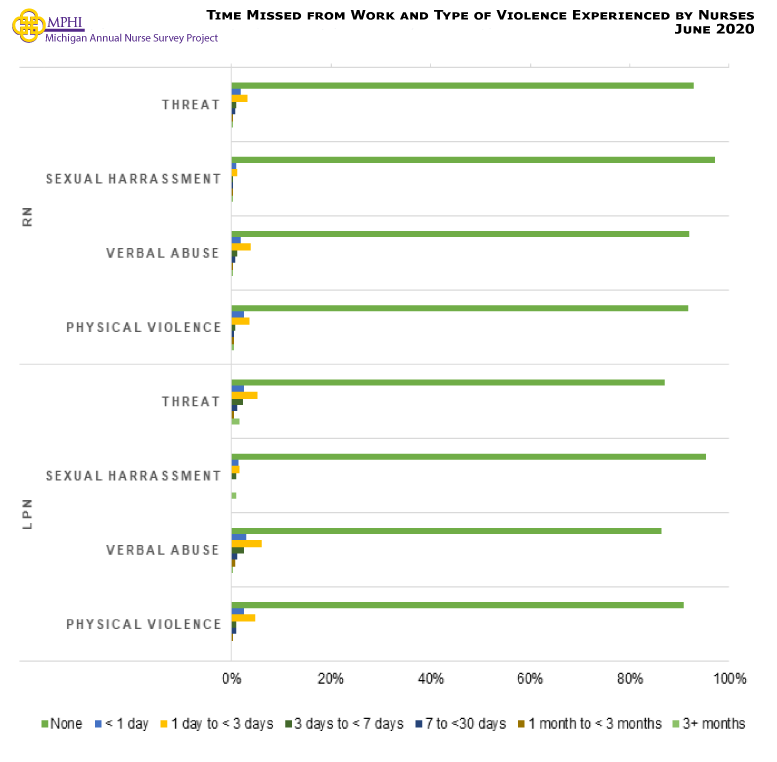
Time Missed from Work and Type of Violence Experienced by Nurses
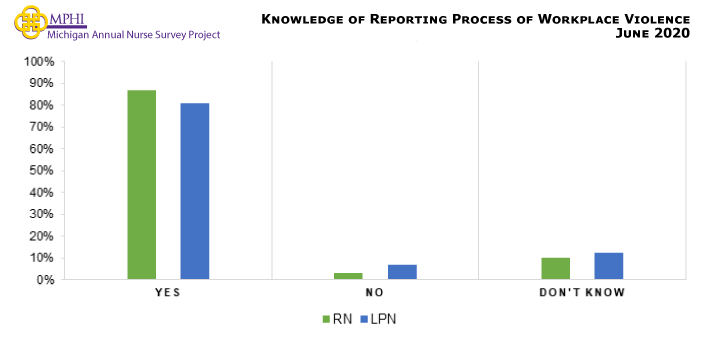
Knowledge of Reporting Process of Workplace Violence Incidents through Organization
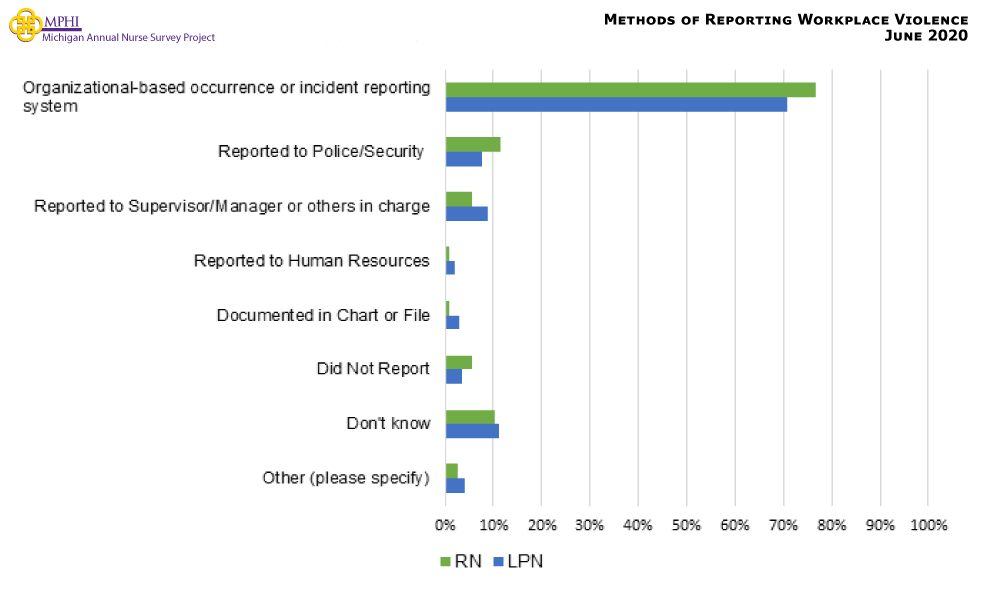
Methods of Reporting Workplace Violence Incidence
Nurses who Experienced Workplace Violence in Inpatient Care Settings
| Inpatient Care Setting | RNs & LPNs | ||
|---|---|---|---|
| n | Estimate | 95% CI | |
| Assisted living facility | 512 | 27.1% | (23.3%, 31.0%) |
| Behavioral health facility/psychiatric | 795 | 57.1% | (53.7%, 60.6%) |
| Correctional system | 142 | 55.8% | (47.7%, 64.0%) |
| Home health care | 124 | 25.6% | (17.9%, 33.3%) |
| Hospice | 370 | 40.7% | (35.7%, 45.7%) |
| Hospital (acute care & acute rehabilitation) | 13,416 | 44.7% | (43.8%, 45.5%) |
| Nursing home/long-term care facility | 2,699 | 32.5% | (30.7%, 34.2%) |
| Traveling/staffing agency | 497 | 44.7% | (40.4%, 49.1%) |
| Other nursing employment setting | 558 | 29.6% | (25.8%, 33.4%) |
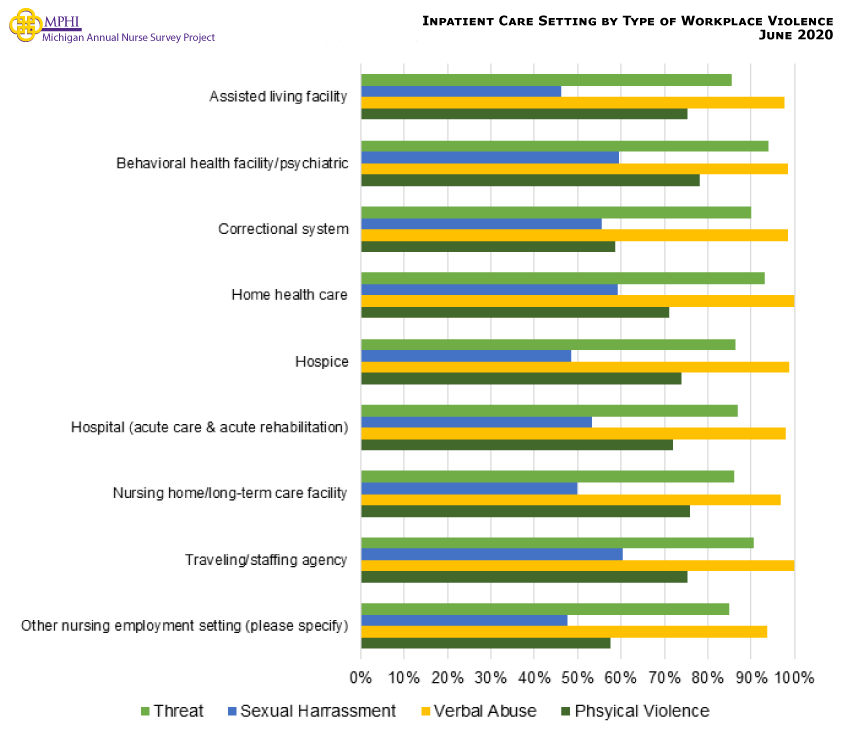
Type of Violence Experienced by Nurses in Inpatient Care Settings
Nurses who Experienced Workplace Violence in Community-based Care Settings
| Community-based Care Setting | RNs & LPNs | ||
|---|---|---|---|
| n | Estimate | 95% CI | |
| Ambulatory care | 1,017 | 27.9% | (25.1%, 30.7%) |
| Assisted living facility | 376 | 27.1% | (22.6%, 31.6%) |
| College health center | 43 | 14.0% | (03.6%, 24.4%) |
| Community health/public health/coaching/wellness | 597 | 21.3% | (18.0%, 24.6%) |
| Correctional system | 90 | 44.3% | (34.0%, 54.5%) |
| K-12 school health | 295 | 23.2% | (18.4%, 28.0%) |
| Federally qualified health center | 232 | 35.7% | (29.5%, 41.9%) |
| Home health care | 1,366 | 19.2% | (17.1%, 21.3%) |
| Hospice | 671 | 21.8% | (18.7%, 24.9%) |
| Insurance company/health plan/benefits | 231 | 13.2% | (08.8%, 17.5%) |
| Specialty office/clinic | 744 | 26.9% | (23.7%, 30.1%) |
| Nurse managed clinic | 85 | 30.5% | (20.7%, 40.3%) |
| Long-term home care | 373 | 23.5% | (19.2%, 27.8%) |
| Nursing training/continuing education | 134 | 23.5% | (16.3%, 30.7%) |
| Primary care/clinic | 808 | 26.9% | (23.9%, 30.0%) |
| Private practice | 352 | 20.6% | (16.4%, 24.8%) |
| Public/community health | 723 | 28.8% | (25.5%, 32.1%) |
| Retail clinic | 18 | 33.7% | (11.9%, 55.6%) |
| Rural health clinic | 165 | 33.5% | (26.3%, 40.7%) |
| Surgical center | 260 | 21.6% | (16.6%, 26.5%) |
| Traveling/staffing agency | 57 | 45.9% | (33.0%, 58.9%) |
| Other | 479 | 29.7% | (25.6%, 33.8%) |
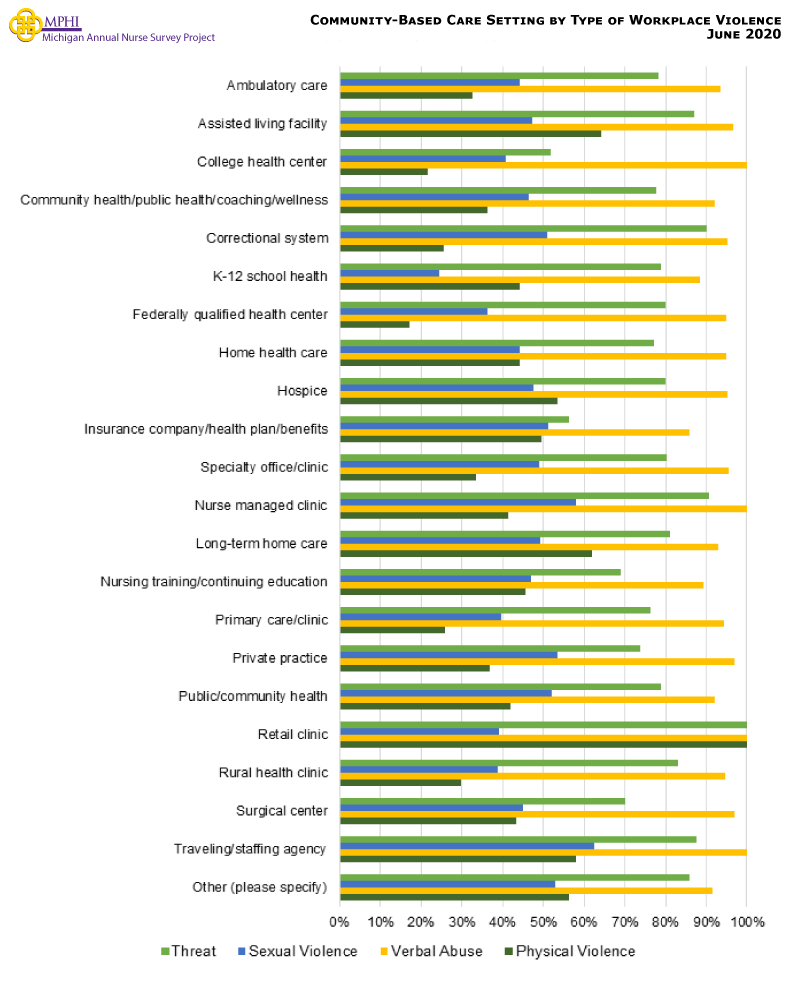
Type of Violence Experienced by Nurses in Community-based Care Settings