Analysis of the survey responses are presented in tables and charts below:
Survey Respondents & Response RatesDemographic Characteristics of Survey Respondents
Demographics
RN
LPN
n
Estimate
n
Estimate
Total
3,695
–
442
–
Age
<25 years
33
0.9%
*
*
25 to 34 years
496
13.4%
41
9.3%
35 to 44 years
552
14.9%
72
16.3%
45 to 54 years
696
18.8%
95
21.5%
55 to 64 years
1,024
27.7%
110
24.9%
65+ years
606
16.4%
72
16.3%
Unknown
288
7.8%
48
10.9%
Gender
Female
3,203
86.7%
381
86.2%
Male
274
7.4%
21
4.8%
Unknown
218
5.9%
40
9.0%
Race
White
3,039
82.2%
290
65.6%
Black or African American
233
6.3%
89
20.1%
American Indian or Alaska Native
43
1.2%
*
*
Asian
133
3.6%
*
*
Native Hawaiian or Pacific Islander
*
*
*
*
Middle Eastern (Arab/Chaldean/Other)
25
0.7%
*
*
Other
52
1.4%
*
*
Unknown
245
6.6%
44
10.0%
Ethnicity
Hispanic or Latino
69
1.9%
*
*
Not Hispanic or Latino
3,362
91.0%
387
87.6%
Unknown
264
7.1%
48
10.9%
Region
Upper Peninsula
91
2.5%
23
5.2%
Northwest LP
123
3.3%
15
3.4%
Northeast LP
50
1.4%
*
*
West/West Central
473
12.8%
67
15.2%
East Central
164
4.4%
19
4.3%
East
222
6.0%
34
7.7%
South Central
132
3.6%
15
3.4%
Southwest
233
6.3%
27
6.1%
Southeast
362
9.8%
34
7.7%
Detroit Metro
1,128
30.5%
122
27.6%
MI, Unknown Region
144
3.9%
19
4.3%
Outside MI
378
10.2%
21
4.8%
Unknown
195
5.3%
37
8.4%
All percentages reported in the table are presented as weighted estimates that reflect Michigan’s overall nurse population. For example, of RNs who responded to the survey, 27.7% are 55 to 64 years old.
* Data are suppressed if count is less than 10 or sample population was less than 20.
– Data are not available/data are not applicable.Comparison of Survey Respondents to All Nurses Licensed in Michigan
Characteristics
Nurse Population (Licensure Data)
Survey Data
2018
2019
Total
2018
#
%
#
%
#
%
#
%
Total
88,152
–
84,974
–
173,126
–
4,137
–
RNs
75,763
85.9%
73,230
86.2%
148,993
86.1%
3,695
89.3%
NPs
3,531
4.7%
3,616
4.9%
7,147
4.8%
271
7.3%
Anesthetists
1,269
1.7%
1,407
1.9%
2,676
1.8%
46
1.2%
Nurse Midwifes
193
0.3%
200
0.3%
393
0.3%
32
0.9%
Age
<25 years
1,526
2.0%
1,174
1.6%
2,700
1.8%
33
0.9%
25 to 34 years
14,404
19.0%
13,886
19.0%
28,290
19.0%
496
13.4%
35 to 44 years
15,232
20.1%
14,779
20.2%
30,011
20.1%
552
14.9%
45 to 54 years
16,782
22.2%
16,160
22.1%
32,942
22.1%
696
18.8%
55 to 64 years
18,174
24.0%
18,359
25.1%
36,533
24.5%
1,024
27.7%
65+ years
9,629
12.7%
8,866
12.1%
18,495
12.4%
606
16.4%
Unknown
16
0.0%
*
*
22
0.0%
288
7.8%
Region
Eastern/ Central/Western UP
2,097
2.8%
1,975
2.7%
4,072
2.7%
91
2.5%
Northwest LP
2,402
3.2%
2,521
3.4%
4,923
3.3%
123
3.3%
Northeast LP
1,177
1.6%
1,209
1.7%
2,386
1.6%
50
1.4%
West/West Central
9,703
12.8%
9,619
13.1%
19,322
13.0%
473
12.8%
East Central
3,906
5.2%
3,609
4.9%
7,515
5.0%
164
4.4%
East
6,088
8.0%
5,872
8.0%
11,960
8.0%
222
6.0%
South Central
2,666
3.5%
2,728
3.7%
5,394
3.6%
132
3.6%
Southwest
4,804
6.3%
4,772
6.5%
9,576
6.4%
233
6.3%
Southeast
7,626
10.1%
7,463
10.2%
15,089
10.1%
362
9.8%
Detroit Metro
25,365
33.5%
24,611
33.6%
49,976
33.5%
1,128
30.5%
MI, Unknown Region
–
–
–
–
–
–
144
3.9%
Outside of MI
9,929
13.1%
8,851
12.1%
18,780
12.6%
378
10.2%
Unknown
–
–
–
–
–
–
195
5.3%
LPNs
12,389
14.1%
11,744
13.8%
24,133
13.9%
442
10.7%
Age
<25 years
239
1.9%
215
1.8%
454
1.9%
*
*
25 to 34 years
2,190
17.7%
2,018
17.2%
4,208
17.4%
41
9.3%
35 to 44 years
2,626
21.2%
2,409
20.5%
5,035
20.9%
72
16.3%
45 to 54 years
2,566
20.7%
2,432
20.7%
4,998
20.7%
95
21.5%
55 to 64 years
2,994
24.2%
3,089
26.3%
6,083
25.2%
110
24.9%
65+ years
1,770
14.3%
1,578
13.4%
3,348
13.9%
72
16.3%
Unknown
*
*
*
*
*
*
48
10.9%
Region
Eastern/ Central/Western UP
815
6.6%
849
7.2%
1,664
6.9%
23
5.2%
Northwest LP
363
2.9%
305
2.6%
668
2.8%
15
3.4%
Northeast LP
399
3.2%
376
3.2%
775
3.2%
*
*
West/West Central
1,937
15.6%
1,926
16.4%
3,863
16.0%
67
15.2%
East Central
805
6.5%
853
7.3%
1,658
6.9%
19
4.3%
East
1,177
9.5%
1,084
9.2%
2,261
9.4%
34
7.7%
South Central
385
3.1%
368
3.1%
753
3.1%
15
3.4%
Southwest
916
7.4%
839
7.1%
1,755
7.3%
27
6.1%
Southeast
1,176
9.5%
1,010
8.6%
2,186
9.1%
34
7.7%
Detroit Metro
3,648
29.4%
3,516
29.9%
7,164
29.7%
122
27.6%
MI, Unknown Region
–
–
–
–
–
–
19
4.3%
Outside of MI
768
618
5.3%
1,386
21
4.8%
Unknown
–
–
–
–
–
0.0%
37
8.4%
All percentages reported in the table are presented as weighted estimates that reflect Michigan’s overall nurse population. For example, of RNs who responded to the survey, 27.7% are 55 to 64 years old compared to 24.0% of RNs in the 2018 nursing populations overall.
* Data are suppressed if count is less than 10 or sample population was less than 20.
– Data are not available/data are not applicable.EducationHighest Level of Nursing-Related Education
Education Level
RN = 3,681
LPN = 442
Estimate
95% CI
Estimate
95% CI
LPN diploma/certificate
*
*
93.2%
(90.5%, 95.2%)
RN diploma in nursing
7.4%
(6.6%, 8.3%)
*
*
Associate’s degree in nursing
35.0%
(33.5%, 36.6%)
6.1%
(4.2%, 8.7%)
Bachelor’s degree in nursing
43.8%
(42.2%, 45.4%)
*
*
Master’s degree in nursing
11.8%
(10.8%, 12.9%)
*
*
Doctorate in Nursing Practice (DNP)
1.0%
(0.8%, 1.4%)
*
*
Doctor of Philosophy in Nursing (PhD)
0.7%
(0.4%, 1.0%)
*
*
Other doctoral degree in nursing
0.1%
(0.0%, 0.3%)
*
*
All percentages reported in the table are presented as weighted estimates that reflect Michigan’s overall nurse population. For example, of RNs who responded to the survey, 7.4% had a RN diploma as their highest level of education.
* Data are suppressed if count is less than 10 or sample population was less than 20. Highest Level of Non-Nursing Education
Education Level
RN = 3,580
LPN = 438
Estimate
95% CI
Estimate
95% CI
Non-nursing associate’s degree
12.7%
(11.6%, 13.8%)
25.3%
(21.5%, 29.6%)
Non-nursing bachelor’s degree
15.7%
(14.6%, 16.9%)
6.6%
(4.7%, 9.3%)
Non-nursing master’s degree
6.4%
(5.7%, 7.3%)
*
*
Non-nursing doctoral degree
0.7%
(0.5%, 1.1%)
*
*
Not applicable
64.5%
(62.9%, 66.0%)
67.1%
(62.6%, 71.3%)
All percentages reported in the table are presented as weighted estimates that reflect Michigan’s overall nurse population. For example, of RNs who responded to the survey, 12.7% has a non-nursing associate degree as their highest level of education.
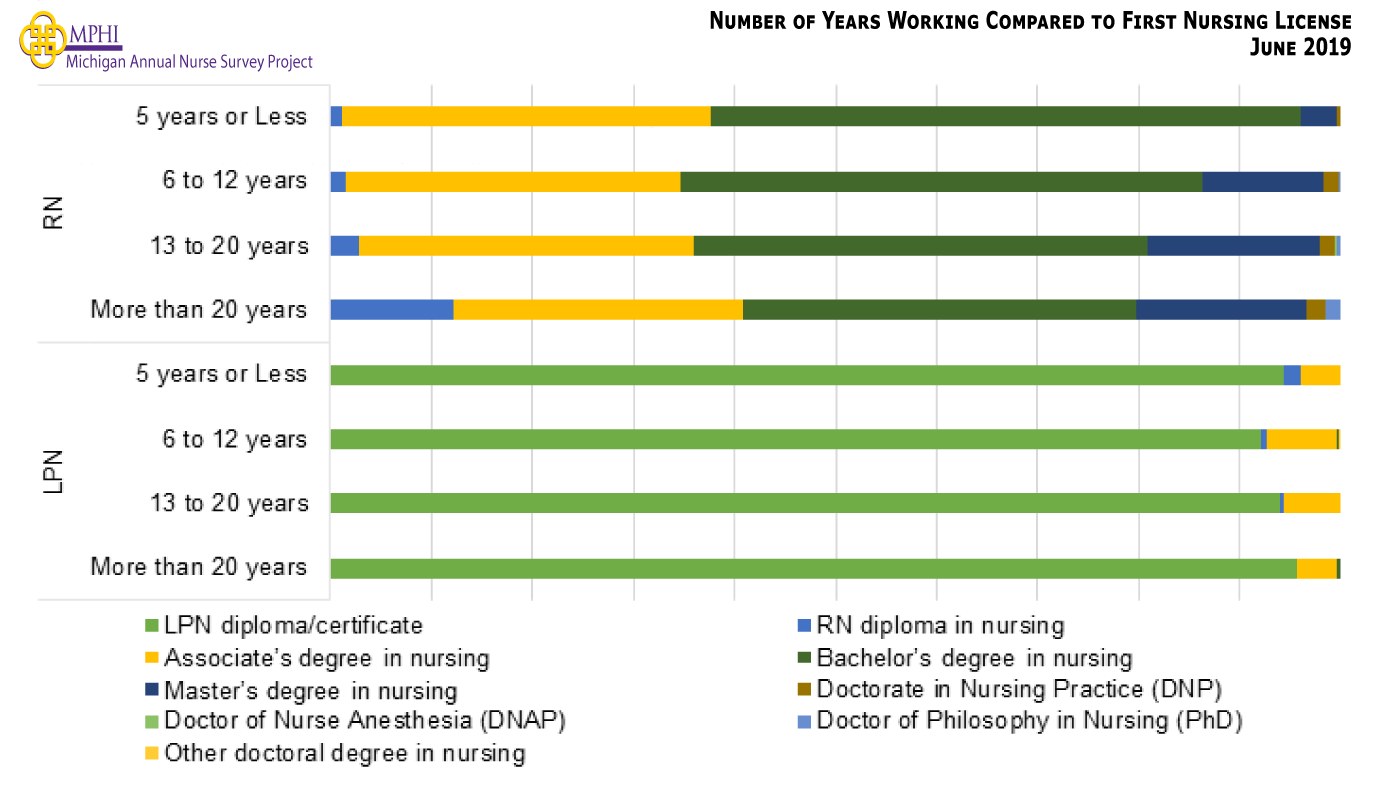
* Data are suppressed if count is less than 10 or sample population was less than 20. Educational Background that Qualified for First Nursing License
Education Level
RN = 3,689
LPN = 438
Estimate
95% CI
Estimate
95% CI
LPN diploma/certificate
4.5%
(3.9%, 5.2%)
95.4%
(93.1%, 97.0%)
RN diploma in nursing
11.5%
(10.6%, 12.6%)
–
–
Associate’s degree in nursing
37.7%
(36.2%, 39.3%)
4.6%
(3.0%, 6.9%)
Bachelor’s degree in nursing
40.8%
(39.2%, 42.4%)
–
–
Master’s degree in nursing
4.7%
(4.0%, 5.4%)
–
–
Doctorate in nursing
0.7%
(0.5%, 1.1%)
–
–
All percentages reported in the table are presented as weighted estimates that reflect Michigan’s overall nurse population. For example, of RNs who responded to the survey, 11.5% had attained a RN diploma as their first nursing licensure.
– Survey respondents were not given these education levels because they had previously indicated they were LPNs.Number of Years Working Compared to First Nursing LicenseCurrent Specialty Certifications in Michigan
Certification
n = 3,695
Estimate
95% CI
Nurse Practitioner
4.9%
(4.2%, 5.6%)
Nurse Anesthetist
0.8%
(0.6%, 1.2%)
Nurse Midwife
0.6%
(0.4%, 0.9%)
Clinical Nurse Specialist
0.7%
(0.5%, 1.0%)
All percentages reported in the table are presented as weighted estimates that reflect Michigan’s overall nurse population. For example, of RNs who responded to the survey, 4.9% are certified as a Nurse Practitioner.Current Enrollment in Nursing Educational Programs
Degree
RN = 3,695
LPN = 442
Estimate
95% CI
Estimate
95% CI
Associate’s Degree in Nursing (ADN)
0.3%
(0.2%, 0.5%)
13.3%
(10.5%, 16.8%)
Bachelor of Science in Nursing (BSN)
5.1%
(4.4%, 5.9%)
2.0%
(1.1%, 3.8%)
Master of Science in Nursing (MSN)
3.4%
(2.9%, 4.1%)
*
*
Doctor of Nursing Practice (DNP)
1.1%
(0.8%, 1.5%)
*
*
Doctor of Philosophy in Nursing (PhD)
0.3%
(0.1%, 0.5%)
*
*
Not Enrolled
89.8%
(88.8%, 90.8%)
84.6%
(81.0%, 87.7%)
All percentages reported in the table are presented as weighted estimates that reflect Michigan’s overall nurse population. For example, of RNs who responded to the survey, 5.1% are currently enrolled in a Bachelor of Science in Nursing (BSN) program.
* Data are suppressed if count is less than 10 or sample population was less than 20. Educational Preparation to Earn Specialty Certification
Certification
RN = 131
Estimate
95% CI
Nurse Practitioner
76.4%
(68.4%, 82.8%)
Nurse Midwife
6.8%
(3.6%, 12.5%)
Nurse Anesthetist
7.6%
(4.2%, 13.5%)
Clinical Nurse Specialist
9.2%
(5.3%, 15.4%)
All percentages reported in the table are presented as weighted estimates that reflect Michigan’s overall nurse population. For example, of RNs who responded they are currently enrolled in an AP associated program, 76.4% are currently enrolled in a Nurse Practitioner program.EmploymentCurrent Employment Status
Employment
RN = 3,695
LPN = 442
Estimate
95% CI
Estimate
95% CI
Actively employed in nursing
or a position that requires a
nurse license full-time
63.3%
(61.8%, 64.9%)
62.2%
(57.6%, 66.6%)
Actively employed in nursing
or a position that requires
a nurse license part-time
12.6%
(11.6%, 13.7%)
11.8%
(9.1%, 15.1%)
Actively employed in nursing
or a position that requires
a nurse license on a per-diem basis
4.7%
(4.0%, 5.4%)
4.8%
(3.1%, 7.2%)
On temporary medical leave
from a position that requires
a nurse license
0.6%
(0.4%, 0.9%)
*
*
On temporary non-medical leave
from a position that requires
a nurse license
0.2%
(0.1%, 0.4%)
*
*
Actively employed in a field
other than nursing
2.5%
(2.0%, 3.0%)
4.3%
(2.8%, 6.6%)
Working in nursing only as
a volunteer
1.5%
(1.2%, 1.9%)
*
*
Unemployed, seeking
work as a nurse
1.8%
(1.4%, 2.2%)
3.4%
(2.1%, 5.5%)
Unemployed, not seeking
work as a nurse
3.4%
(2.8%, 4.0%)
3.4%
(2.1%, 5.5%)
Retired
9.6%
(8.7%, 10.6%)
7.9%
(5.7%, 10.8%)
All percentages reported in the table are presented as weighted estimates that reflect Michigan’s overall nurse population. For example, of RNs who responded to the survey, 63.3% were actively employed in nursing or in a position that requires a nurse license full-time.
* Data are suppressed if count is less than 10 or sample population was less than 20. Percentage of Nurses Who are Employed by Demographic Characteristics
Demographics
RN
LPN
n
Estimate
95% CI
n
Estimate
95% CI
Total
3,695
83.3%
(82.1%, 84.5%)
442
79.0%
(75.2%, 82.8%)
Age
18 to 24 years
33
97.0%
(91.1%, 100.0%)
*
*
*
25 to 34 years
496
94.2%
(92.1%, 96.3%)
41
87.8%
(77.8%, 97.8%)
35 to 44 years
552
92.0%
(89.8%, 94.3%)
72
87.5%
(79.9%, 95.1%)
45 to 54 years
696
90.7%
(88.5%, 92.8%)
95
86.3%
(79.4%, 93.2%)
55 to 64 years
1,024
79.9%
(77.4%, 82.3%)
110
73.6%
(65.4%, 81.9%)
65+ years
606
44.2%
(40.2%, 48.1%)
72
51.4%
(39.8%, 62.9%)
Gender
Female
3,203
83.1%
(81.8%, 84.4%)
381
80.0%
(75.9%, 84.0%)
Male
274
85.9%
(81.8%, 90.0%)
21
61.3%
(40.5%, 82.1%)
Race
White
3,039
82.7%
(81.4%, 84.1%)
290
74.2%
(69.2%, 79.2%)
Black or African American
233
86.1%
(81.6%, 90.5%)
89
92.3%
(86.8%, 97.9%)
Other
249
88.0%
(83.9%, 92.0%)
25
92.3%
(81.8%, 100.0%)
Ethnicity
Hispanic or Latino
69
94.6%
(89.3%, 99.9%)
*
*
*
Not Hispanic or Latino
3,362
83.1%
(81.8%, 84.4%)
387
79.0%
(74.9%, 83.0%)
Residency
Upper Peninsula
91
83.9%
(76.4%, 91.5%)
23
69.4%
(50.6%, 88.2%)
Northwest LP
123
79.9%
(72.9%, 87.0%)
15
75.2%
(53.4%, 97.1%)
Northeast LP
50
79.2%
(68.0%, 90.5%)
*
*
*
West/West Central
473
86.5%
(83.4%, 89.6%)
67
75.1%
(64.8%, 85.5%)
East Central
164
83.8%
(78.1%, 89.4%)
19
82.7%
(65.7%, 99.7%)
East
222
79.7%
(74.4%, 85.0%)
34
69.2%
(53.7%, 84.7%)
South Central
132
85.8%
(79.8%, 91.7%)
15
64.4%
(40.1%, 88.6%)
Southwest
233
89.0%
(85.0%, 93.0%)
27
97.6%
(91.8%, 100.0%)
Southeast
362
79.4%
(75.2%, 83.6%)
34
78.9%
(65.2%, 92.6%)
Detroit Metro
1,128
85.0%
(82.9%, 87.1%)
122
85.5%
(79.2%, 91.7%)
Outside MI
378
76.3%
(72.0%, 80.6%)
21
62.0%
(41.3%, 82.8%)
All percentages reported in the table are presented as weighted estimates that reflect Michigan’s overall nurse population. For example, of RNs 25 years or younger who responded to the survey, 97.0% are employed.
* Data are suppressed if count is less than 10 or sample population was less than 20. Demographic Characteristics of Employed Nurses
Demographics
RN = 2,796
LPN = 311
Estimate
95% CI
Estimate
95% CI
Age
18 to 24 years
2.1%
(1.6%, 2.7%)
2.4%
(1.2%, 4.8%)
25 to 34 years
21.5%
(20.0%, 23.0%)
19.4%
(15.4%, 24.1%)
35 to 44 years
22.3%
(20.8%, 23.8%)
23.1%
(18.8%, 28.1%)
45 to 54 years
24.1%
(22.5%, 25.7%)
22.6%
(18.3%, 27.6%)
55 to 64 years
23.5%
(22.0%, 25.1%)
23.5%
(19.1%, 28.5%)
65+ years
6.6%
(5.7%, 7.6%)
9.0%
(6.3%, 12.7%)
Gender
Female
92.0%
(90.9%, 92.9%)
96.2%
(93.4%, 97.8%)
Male
8.0%
(7.1%, 9.1%)
3.8%
(2.2%, 6.6%)
Race
White
87.7%
(86.4%, 88.8%)
68.6%
(63.3%, 73.5%)
Black
6.8%
(5.9%, 7.8%)
26.2%
(21.6%, 31.4%)
Other
7.7%
(6.8%, 8.8%)
7.3%
(4.9%, 10.7%)
Hispanic or Latino
Hispanic or Latino
2.4%
(1.9%, 3.0%)
2.2%
(1.0%, 4.5%)
Not Hispanic or Latino
97.6%
(97.0%, 98.1%)
97.8%
(95.5%, 99.0%)
All percentages reported in the table are presented as weighted estimates that reflect Michigan’s overall nurse population. For example, of RNs who responded to the survey that they are employed, 21.5% are 25 to 34 years old. Prosperity Region of Residency & Employment among Michigan Nurses
Prosperity Region
RNs
LPNs
Place of Residency
Place of Employment
Place of Residency
Place of Employment
Estimate
95% CI
Estimate
95% CI
Estimate
95% CI
Estimate
95% CI
Upper Peninsula
2.7%
(2.2%, 3.4%)
2.8%
(2.2%, 3.4%)
5.3%
(3.3%, 8.5%)
5.1%
(3.1%, 8.2%)
Northwest LP
3.5%
(2.9%, 4.3%)
3.7%
(3.0%, 4.5%)
3.5%
(1.9%, 6.2%)
3.1%
(1.7%, 5.8%)
Northeast LP
1.4%
(1.0%, 2.0%)
1.3%
(1.0%, 1.9%)
2.0%
(0.9%, 4.3%)
2.0%
(0.9%, 4.3%)
West/West Central
15.4%
(14.1%, 16.8%)
15.2%
(13.9%, 16.6%)
17.2%
(13.3%, 21.9%)
18.9%
(14.8%, 23.7%)
East Central
5.1%
(4.3%, 6.0%)
5.0%
(4.2%, 5.9%)
5.5%
(3.4%, 8.7%)
6.3%
(4.1%, 9.6%)
East
6.5%
(5.6%, 7.5%)
5.1%
(4.3%, 6.0%)
7.2%
(4.8%, 10.7%)
5.7%
(3.6%, 8.9%)
South Central
4.0%
(3.3%, 4.8%)
4.1%
(3.4%, 4.9%)
3.3%
(1.8%, 6.0%)
4.1%
(2.4%, 7.0%)
Southwest
7.5%
(6.5%, 8.5%)
7.7%
(6.8%, 8.8%)
10.3%
(7.3%, 14.2%)
8.7%
(6.0%, 12.4%)
Southeast
10.3%
(9.2%, 11.5%)
11.7%
(10.6%, 13.0%)
9.1%
(6.3%, 12.9%)
7.7%
(5.2%, 11.3%)
Detroit Metro
33.9%
(32.2%, 35.7%)
34.4%
(32.6%, 36.2%)
32.4%
(27.4%, 38.0%)
35.0%
(29.8%, 40.6%)
Outside MI
9.7%
(8.7%, 10.9%)
9.0%
(8.0%, 10.2%)
4.2%
(2.5%, 7.2%)
3.4%
(1.9%, 6.2%)
All percentages reported in the table are presented as weighted estimates that reflect Michigan’s overall nurse population. For example, of RNs who responded to the survey, 2.7% live in the Upper Peninsula.Reasons for Not Working as a Nurse Full-Time
Reason
RN = 609
LPN = 69
Estimate
95% CI
Estimate
95% CI
Taking care of home and family
55.1%
(51.1%, 59.0%)
46.1%
(34.8%, 57.7%)
School
10.7%
(8.4%, 13.4%)
26.8%
(17.7%, 38.2%)
Difficulty finding a full-time nursing position
4.3%
(2.9%, 6.2%)
*
*
Prefer to work part-time or per diem basis
0.4%
(0.1%, 1.3%)
*
*
Semi-retired
20.7%
(17.7%, 24.1%)
26.7%
(17.7%, 38.1%)
Burned Out
12.5%
(10.1%, 15.4%)
7.9%
(3.5%, 16.7%)
Other
12.2%
(9.8%, 15.0%)
11.9%
(6.2%, 21.6%)
All percentages reported in the table are presented as weighted estimates that reflect Michigan’s overall nurse population. For example, of RNs who are not working full-time, 55.1% indicated that it is because they are taking care of their home and family.
* Data are suppressed if count is less than 10 or sample population was less than 20. Unemployed and Seeking Work as a Nurse
Unemployed and seeking work as a nurse
RN = 61
LPN = 14
Estimate
95% CI
Estimate
95% CI
Taking care of home and family
47.6%
(35.6%, 59.9%)
45.2%
(23.2%, 69.4%)
Difficulty finding a full-time nursing position
13.2%
(6.8%, 23.8%)
5.6%
(0.8%, 29.5%)
Difficulty finding a part-time or on a per-diem basis nursing position
9.6%
(4.4%, 19.6%)
12.3%
(3.1%, 37.6%)
Semi-retired
19.8%
(11.7%, 31.4%)
30.1%
(12.7%, 56.1%)
Burned out
11.8%
(5.9%, 22.2%)
12.4%
(3.2%, 37.8%)
Other
24.9%
(15.7%, 37.0%)
24.5%
(9.3%, 50.7%)
All percentages reported in the table are presented as weighted estimates that reflect Michigan’s overall nurse population. For example, of RNs who are unemployed and seeking work, 47.6% indicated that the reason they are not working is because they are taking care of home and family.Unemployed and Not Seeking Work as a Nurse
Unemployed and NOT seeking work as a nurse
RN = 120
LPN = 15
Estimate
95% CI
Estimate
95% CI
Taking care of home and family
64.7%
(52.2%, 75.5%)
29.9%
(12.6%, 55.9%)
School
6.2%
(2.4%, 15.2%)
13.1%
(3.5%, 38.6%)
Difficulty finding a full-time nursing position
1.6%
(0.3%, 8.7%)
0.0%
(0.0%, 21.5%)
Difficulty finding a part-time or on a per-diem basis nursing position
5.4%
(1.9%, 14.2%)
7.5%
(1.4%, 31.9%)
Semi-retired
19.6%
(11.6%, 31.3%)
16.8%
(5.2%, 42.7%)
Burned out
9.3%
(4.2%, 19.2%)
19.0%
(6.3%, 45.1%)
Other (please specify)
12.4%
(6.3%, 22.9%)
47.6%
(25.0%, 71.3%)
All percentages reported in the table are presented as weighted estimates that reflect Michigan’s overall nurse population. For example, of RNs who are unemployed and seeking work, 64.7% indicated that the reason they are not working nor seeking work is because they are taking care of home and family.Nurses Licensed Out of State or Country
Region
RN = 3,695
LPN = 442
Estimate
95% CI
Estimate
95% CI
Michigan Only
81.9%
(80.6%, 83.1%)
84.4%
(80.7%, 87.5%)
Other U.S. State**
16.9%
(15.7%, 18.1%)
15.2%
(12.1%, 18.8%)
Ohio
18.1%
(15.2%, 21.3%)
26.9%
(23.0%, 31.2%)
Indiana
14.1%
(11.6%, 17.1%)
13.4%
(10.6%, 16.9%)
Illinois
15.2%
(12.6%, 18.2%)
9.0%
(6.6%, 12.0%)
Wisconsin
11.9%
(9.6%, 14.7%)
13.4%
(10.6%, 16.9%)
Florida
22.6%
(19.5%, 26.0%)
23.9%
(20.1%, 28.1%)
Other Country**
1.8%
(1.4%, 2.3%)
*
*
Canada
45.8%
(34.5%, 57.5%)
*
*
Other State & Country
0.6%
(0.4%, 0.9%)
*
*
All percentages reported in the table are presented as weighted estimates that reflect Michigan’s overall nurse population. For example, of RNs who have licenses in another state or county, 18.1% indicated that their license is in Ohio.
* Data are suppressed if count is less than 10 or sample population was less than 20.
**Percentages include nurses who also reported being licensed in the Other U.S. States and Other Countries category.Current Employment StatusNumber of Currently Employed Nursing Positions
Number of Positions
RN = 2,961
LPN = 344
Estimate
95% CI
Estimate
95% CI
1 Position
87.8%
(86.6%, 88.9%)
82.2%
(77.8%, 85.9%)
2 Position
10.7%
(9.7%, 11.9%)
12.6%
(9.5%, 16.5%)
3+ Positions
1.5%
(1.1%, 2.0%)
5.3%
(3.4%, 8.1%)
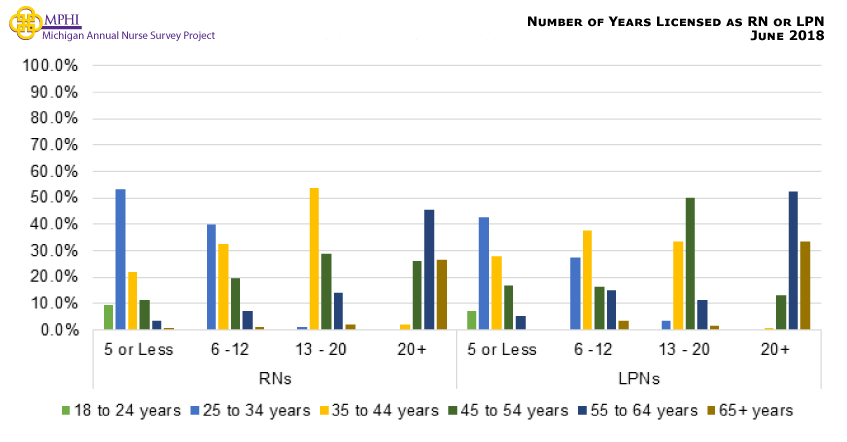
All percentages reported in the table are presented as weighted estimates that reflect Michigan’s overall nurse population. For example, of RNs who responded to the survey, 87.8% have one nursing position.Number of Years Been a Licensed Nurse (RN and LPN)
Years
RN = 3,583
LPN = 412
Estimate
95% CI
Estimate
95% CI
5 years or Less
15.9%
(14.7%, 17.1%)
23.3%
(19.2%, 27.4%)
6 to 12 years
18.0%
(16.8%, 19.3%)
21.4%
(17.4%, 25.3%)
13 to 20 years
13.5%
(12.4%, 14.7%)
13.3%
(10.1%, 16.6%)
More than 20 years
52.5%
(50.8%, 54.1%)
42.0%
(37.2%, 46.8%)
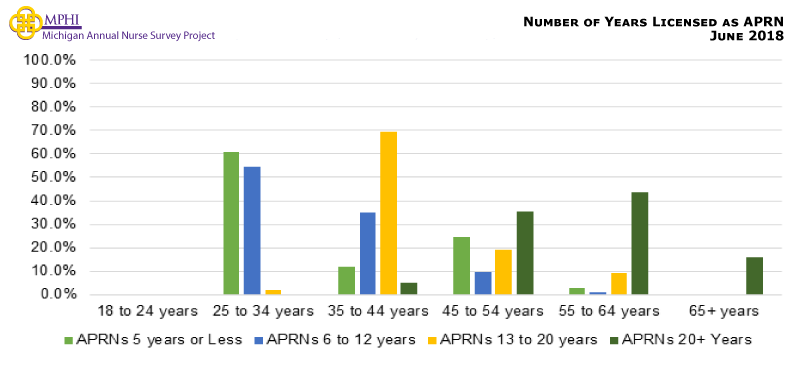
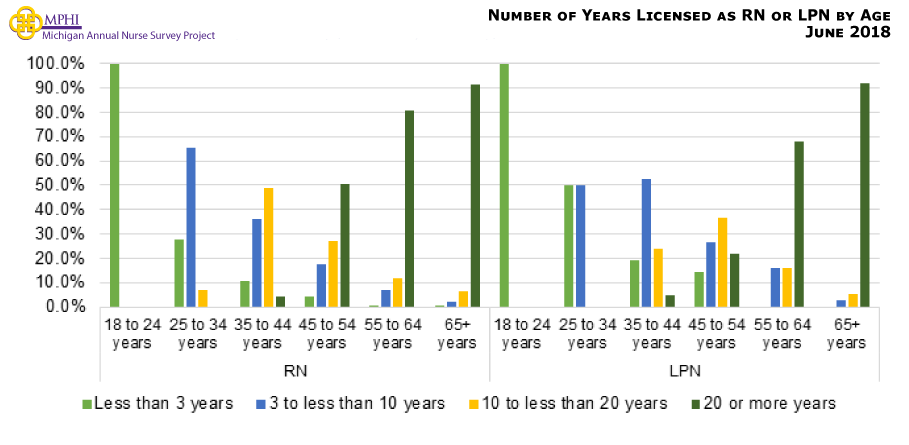
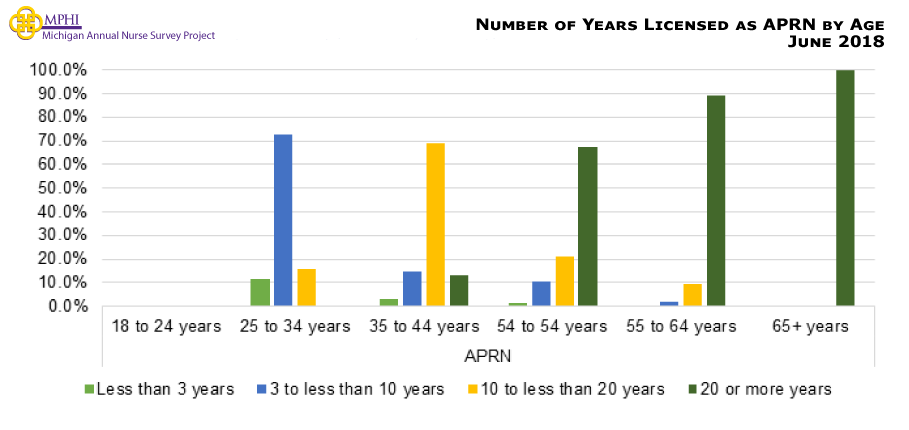
All percentages reported in the table are presented as weighted estimates that reflect Michigan’s overall nurse population. For example, of RNs who responded to the survey, 15.9% have been licensed as a nurse for less than 5 years.Number of Years been a Licensed Nurse Compared to Age (RN and LPN)Number of Years Been a Licensed Nurse (APRN)
Years
APRN = 371
Estimate
95% CI
5 years or less
5.9%
(3.5%, 8.3%)
6 to 12 years
17.5%
(13.7%, 21.4%)
13 to 20 years
16.2%
(12.4%, 19.9%)
More than 20 years
60.4%
(55.4%, 65.4%)
All percentages reported in the table are presented as weighted estimates that reflect Michigan’s overall nurse population. For example, of APNs who responded to the survey, 5.9% have been licensed as a nurse for less than 5 years.Number of Years been a Licensed Nurse Compared to Age (APRN)Number of Years Working as a Nurse (RN and LPN)
Years
RN = 2,871
LPN = 321
Estimate
95% CI
Estimate
95% CI
Less than 3 years
11.7%
(10.5%, 12.8%)
19.8%
(15.4%, 24.1%)
3 to less than 10 years
28.2%
(26.5%, 29.8%)
31.9%
(26.8%, 37.0%)
10 to less than 20 years
22.1%
(20.6%, 23.6%)
18.0%
(13.8%, 22.2%)
20 or more years
38.1%
(36.3%, 39.8%)
30.3%
(25.3%, 35.3%)
All percentages reported in the table are presented as weighted estimates that reflect Michigan’s overall nurse population. For example, of RNs who responded to the survey, 11.7% have worked as a nurse for less than 3 years. Number of Years Working as a Nurse Compared to Age (RN and LPN)Number of Years Working as a Nurse (APRN)
Years
APRN = 1,479
Estimate
95% CI
Less than 3 years
2.5%
(01.7%, 03.3%)
3 to less than 10 years
24.5%
(22.3%, 26.7%)
10 to less than 20 years
31.4%
(29.0%, 33.7%)
20 or more years
41.7%
(39.1%, 44.2%)
All percentages reported in the table are presented as weighted estimates that reflect Michigan’s overall nurse population. For example, of RNs who responded to the survey, 2.5% have worked as a nurse for less than 3 years.Number of Years Working as a Nurse Compared to Age (APRN)Preparedness for Entering Nursing Workforce
Level of Preparedness
RN = 260
LPN = 49
Estimate
95% CI
Estimate
95% CI
Adequately prepared
62.1%
(56.1%, 67.8%)
68.7%
(54.8%, 79.9%)
Not enough classroom time
0.8%
(0.2%, 2.8%)
*
*
Not enough clinical time
25.2%
(20.3%, 30.8%)
*
*
Not enough skills lab/simulation time
13.3%
(9.7%, 18.0%)
12.7%
(6.0%, 24.8%)
Not enough critical thinking/ prioritization practice
18.7%
(14.4%, 23.9%)
17.3%
(9.2%, 30.2%)
Other
3.2%
(1.7%, 6.1%)
*
*
All percentages reported in the table are presented as weighted estimates that reflect Michigan’s overall nurse population. For example, of RNs who were new nurses, 62.1% felt adequately prepared.
* Data are suppressed if count is less than 10 or sample population was less than 20. Number of Years Worked as a Nurse for Retired Nurses
Years
RN = 341
LPN = 35
Estimate
95% CI
Estimate
95% CI
Less than 3 years
0.3%
(0.1%, 1.6%)
3.2%
(0.6%, 15.0%)
4 to 9 years
3.5%
(2.0%, 6.1%)
11.7%
(4.7%, 26.3%)
10 years or more
96.2%
(93.6%, 97.7%)
85.1%
(69.9%, 93.4%)
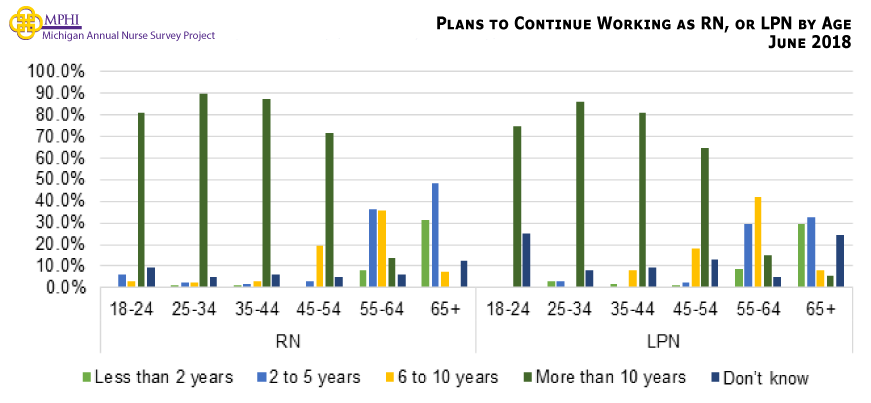
All percentages reported in the table are presented as weighted estimates that reflect Michigan’s overall nurse population. For example, of RNs who responded to the survey that they were retired, 0.3% have worked as a nurse for less than 3 years.Plans to Continue Working as a Nurse (RN and LPN)
Years
RN = 2,867
LPN = 320
Estimate
95% CI
Estimate
95% CI
Less than 2 years
4.5%
(3.8%, 5.3%)
5.9%
(3.3%, 8.5%)
2 to 5 years
13.7%
(12.4%, 14.9%)
11.0%
(07.5%, 14.4%)
6 to 10 years
14.8%
(13.5%, 16.1%)
16.6%
(12.5%, 20.6%)
More than 10 years
60.9%
(59.1%, 62.7%)
55.8%
(50.3%, 61.2%)
Don’t know
6.1%
(5.2%, 6.9%)
10.8%
(7.4%, 14.2%)
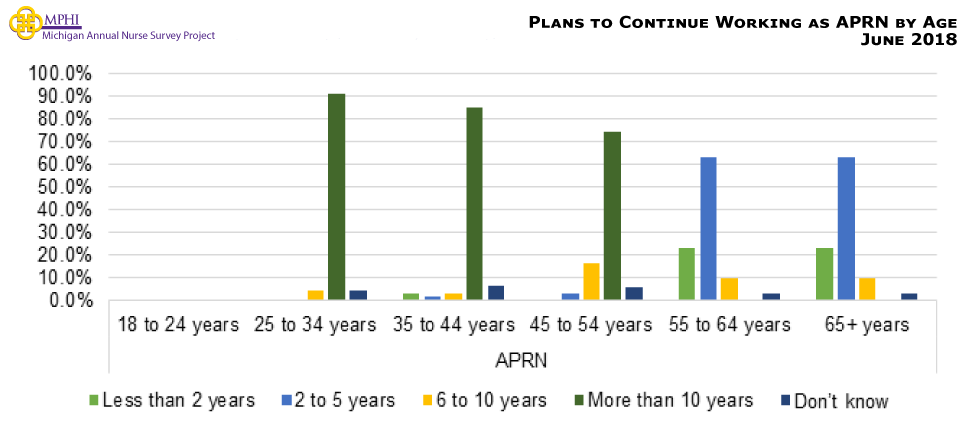
All percentages reported in the table are presented as weighted estimates that reflect Michigan’s overall nurse population. For example, of RNs who responded to the survey, 4.5% were planning to continue to work as a nurse for less than 2 years.Plans to Continue to Practice Nursing (in years) by Age (RN and LPN)Plans to Continue Working as a Nurse (APRN)
Years
APRN = 334
Estimate
95% CI
Less than 2 years
3.8%
(3.1%, 4.5%)
2 to 5 years
13.2%
(12.0%, 14.5%)
6 to 10 years
16.1%
(14.8%, 17.5%)
More than 10 years
60.5%
(58.7%, 62.3%)
Don’t know
6.3%
(5.4%, 7.2%)
All percentages reported in the table are presented as weighted estimates that reflect Michigan’s overall nurse population. For example, of APNs who responded to the survey, 3.8% were planning to continue to work as a nurse for less than 2 years.Plans to Continue to Practice Nursing (in years) by Age (APRN)Direct CareHours per Week Spent Providing Direct Care Services
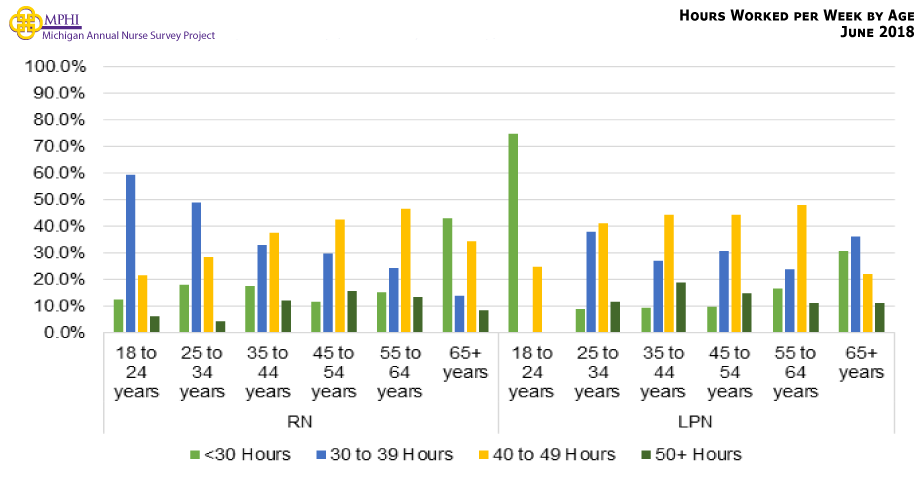
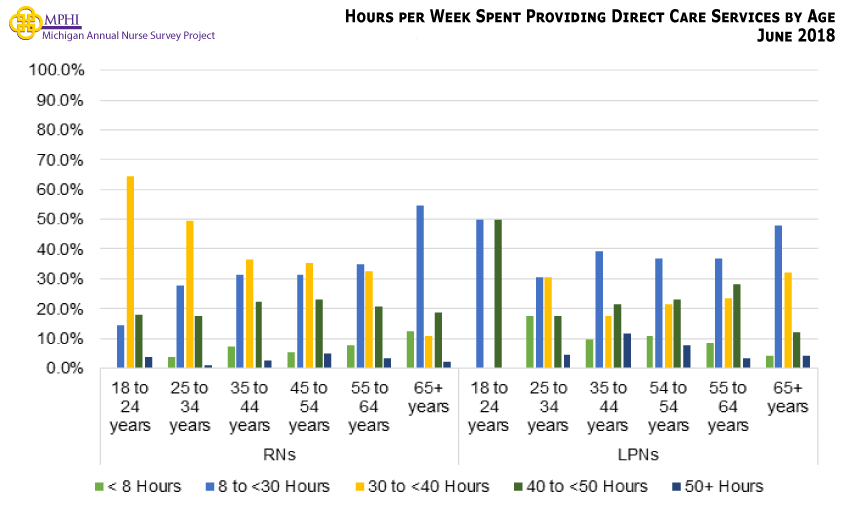
Hours
RN = 1,990
LPN = 244
Estimate
95% CI
Estimate
95% CI
<8 Hours
6.0%
(04.9%, 07.0%)
10.3%
(06.5%, 14.1%)
8 to <30 Hours
31.8%
(29.7%, 33.8%)
37.5%
(31.4%, 43.6%)
30 to <40 Hours
38.3%
(36.2%, 40.4%)
23.0%
(17.7%, 28.3%)
40 to <50 Hours
20.7%
(18.9%, 22.5%)
22.5%
(17.3%, 27.7%)
50+ Hours
2.8%
(2.1%, 3.6%)
6.7%
(3.6%, 9.8%)
All percentages reported in the table are presented as weighted estimates that reflect Michigan’s overall nurse population. For example, of RNs who provide direct care services, 6.0% work less than 8 hours per week providing direct care services.Hours per Week Spent Providing Direct Care Services by AgePlans to Stop Working in the Next Five Years by Nurses who Provide Direct Care
Provides Direct Care for 8+ Hours/Week
RNs
LPNs
n
Estimate
95% CI
n
Estimate
95% CI
Yes
1,116
12.8%
(11.2%, 14.3%)
109
13.0%
(7.7%, 18.2%)
No
653
28.8%
(26.7%, 30.9%)
49
23.5%
(16.8%, 30.1%)
All percentages reported in the table are presented as weighted estimates that reflect Michigan’s overall nurse population. For example, of RNs who provide direct care for less than 8 hours per week, 12.8% plan to leave nursing in the next five years compared to 28.8% of RNs who provide direct care for more than 8 hours per week. Inpatient & Outpatient Practice Settings Providing Direct Care ServicesMain Role Outside of Direct Patient CarePractice SettingWorkplace Setting (Inpatient, Outpatient, and Both)
Workplace Setting
RN = 2,979
LPN = 345
Estimate
95% CI
Estimate
95% CI
Inpatient
51.4%
(49.6%, 53.2%)
52.3%
(47.0%, 57.5%)
Outpatient
33.4%
(31.7%, 35.1%)
34.8%
(29.8%, 39.8%)
Both inpatient and outpatient
15.2%
(13.9%, 16.4%)
12.9%
(09.4%, 16.5%)
All percentages reported in the table are presented as weighted estimates that reflect Michigan’s overall nurse population. For example, of RNs who responded to the survey, 51.4% worked in an inpatient setting.Inpatient Settings
Inpatient Settings
RN = 1,879
LPN = 220
Estimate
95% CI
Estimate
95% CI
Hospital (acute care & acute rehabilitation
86.1%
(84.4%, 87.5%)
16.4%
(12.1%, 21.9%)
Nursing home/long-term care facility
11.0%
(9.6%, 12.5%)
79.0%
(73.1%, 83.9%)
Correctional system
0.4%
(0.2%, 0.8%)
4.1%
(2.2%, 7.6%)
Traveling/staffing agency
1.4%
(0.9%, 2.0%)
3.6%
(1.8%, 7.0%)
Other
3.5%
(2.8%, 4.5%)
7.0%
(4.3%, 11.2%)
All percentages reported in the table are presented as weighted estimates that reflect Michigan’s overall nurse population. For example, of RNs who responded to the survey, 86.1% worked in hospital setting.Outpatient Practice SettingThe Number of Interprofessional Activities
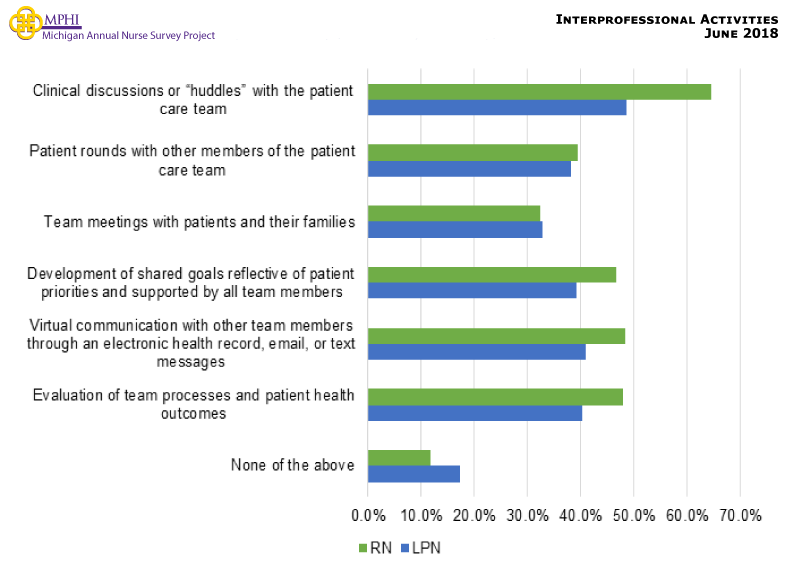
Number of Interprofessional Activities
RN = 2,819
LPN = 315
Estimate
95% CI
Estimate
95% CI
0
11.8%
(10.6%, 13.0%)
17.4%
(13.6%, 21.9%)
1
12.9%
(11.7%, 14.2%)
17.2%
(13.5%, 21.8%)
2
13.8%
(12.5%, 15.1%)
12.4%
(9.2%, 16.4%)
3
14.0%
(12.7%, 15.3%)
14.8%
(11.3%, 19.1%)
4
13.3%
(12.0%, 14.6%)
10.3%
(7.4%, 14.1%)
5
12.7%
(11.5%, 14.0%)
10.6%
(7.7%, 14.5%)
6
9.3%
(8.3%, 10.4%)
8.7%
(6.0%, 12.3%)
7
12.3%
(11.2%, 13.6%)
8.7%
(6.1%, 12.3%)
All percentages reported in the table are presented as weighted estimates that reflect Michigan’s overall nurse population. For example, of RNs who responded to the survey, 11.8% indicated they had no interprofessional activities.Participation in Interprofessional ActivitiesChange in Employment Setting
Change in Employment Setting
RN = 2,642
LPN = 301
Estimate
95% CI
Estimate
95% CI
Did not make a change
56.9%
(53.9%, 59.8%)
54.7%
(46.2%, 62.9%)
Made a change
43.1%
(40.2%, 46.1%)
45.3%
(37.1%, 53.8%)
Of those who made a change:
I did not make an employment change in the past three years.
0.8%
(0.4%, 1.6%)
0.0%
(0.0%, 2.8%)
An inpatient setting to an outpatient setting?
17.8%
(15.6%, 20.1%)
13.8%
(8.9%, 20.7%)
An outpatient setting to an inpatient setting?
5.4%
(4.2%, 6.9%)
5.8%
(3.0%, 11.2%)
A primary care setting (e.g., family practice, general medicine) to a specialty care setting?
4.5%
(3.4%, 5.9%)
9.8%
(5.8%, 16.1%)
A specialty care setting to a primary care setting?
3.0%
(2.1%, 4.2%)
3.4%
(1.4%, 8.0%)
A sub-acute care setting to an acute care setting?
4.9%
(3.7%, 6.3%)
1.9%
(0.6%, 5.9%)
An acute care setting to a sub-acute care setting?
2.6%
(1.8%, 3.7%)
3.2%
(1.3%, 7.8%)
A direct patient care setting to a non-direct patient care setting?
14.1%
(12.1%, 16.3%)
9.5%
(5.6%, 15.7%)
A non-direct patient care setting to a direct patient care setting?
4.5%
(3.4%, 5.9%)
1.2%
(0.3%, 4.9%)
I changed locations but stayed in the same care setting.
28.9%
(26.3%, 31.7%)
43.7%
(35.6%, 52.3%)
Some other type of change in employment.
26.1%
(23.6%, 28.8%)
20.9%
(14.8%, 28.6%)
All percentages reported in the table are presented as weighted estimates that reflect Michigan’s overall nurse population. For example, of RNs who made a change in employment, 17.8% indicated they changed from an inpatient setting to an outpatient setting.Plans to Stop Working in the Next Five Years by Employment Setting
Plans to Stop Working in Next 5 Years
RN = 2,673
LPN = 279
Estimate
95% CI
Estimate
95% CI
Inpatient
15.6%
(14.2%, 17.0%)
16.6%
(12.2%, 21.0%)
Outpatient
24.9%
(23.3%, 26.5%)
21.7%
(16.9%, 26.6%)
Both inpatient and outpatient
20.0%
(18.5%, 21.5%)
20.2%
(15.5%, 24.9%)
All percentages reported in the table are presented as weighted estimates that reflect Michigan’s overall nurse population. For example, of RNs who plan to work for five years or less, 15.6% were in an inpatient setting.