Analysis of the survey responses are presented in tables and charts below:
Survey Respondents & Response RatesDemographic Characteristics of Survey Respondents
Demographics
RN = 33,154
LPN = 5,772
n
Estimate
95% CI
n
Estimate
95% CI
Age
<25 years
433
1.3%
(1.2%, 1.4%)
55
1.0%
(0.7%, 1.2%)
25 to 34 years
4,277
12.9%
(12.5%, 13.3%)
650
11.3%
(10.5%, 12.1%)
35 to 44 years
5,308
16.0%
(15.6%, 16.4%)
966
16.7%
(15.8%, 17.7%)
45 to 54 years
7,121
21.5%
(21.0%, 21.9%)
1,147
19.9%
(18.9%, 20.9%)
55 to 64 years
9,375
28.3%
(27.8%, 28.8%)
1,703
29.5%
(28.3%, 30.7%)
65+ years
4,438
13.4%
(13.0%, 13.8%)
801
13.9%
(13.0%, 14.8%)
Unknown
2,202
6.6%
(6.4%, 6.9%)
450
7.8%
(7.1%, 8.5%)
Gender
Female
29,026
87.5%
(87.2%, 87.9%)
5,061
87.7%
(86.8%, 88.5%)
Male
2,509
7.6%
(7.3%, 7.9%)
342
5.9%
(5.3%, 6.6%)
Unknown
1,619
4.9%
(4.7%, 5.1%)
369
6.4%
(5.8%, 7.1%)
Race
White
27,589
83.2%
(82.8%, 83.6%)
4,114
71.3%
(70.1%, 72.4%)
Black or African American
2,091
6.3%
(6.1%, 6.6%)
1,073
18.6%
(17.6%, 19.6%)
American Indian or Alaska Native
393
1.2%
(1.1%, 1.3%)
115
2.0%
(1.7%, 2.4%)
Asian
1,095
3.3%
(3.1%, 3.5%)
88
1.5%
(1.2%, 1.9%)
Native Hawaiian or Pacific Islander
82
0.2%
(0.2%, 0.3%)
11
0.2%
(0.1%, 0.3%)
Middle Eastern (Arab/Chaldean/Other)
175
0.5%
(0.5%, 0.6%)
*
*
*
Other
437
1.3%
(1.2%, 1.4%)
92
1.6%
(1.3%, 2.0%)
Unknown
1,952
5.9%
(5.6%, 6.1%)
444
7.7%
(7.0%, 8.4%)
Ethnicity
Hispanic or Latino
544
1.6%
(1.5%, 1.8%)
108
1.9%
(1.6%, 2.3%)
Not Hispanic or Latino
30,269
91.3%
(91.0%, 91.6%)
5,081
88.0%
(87.2%, 88.8%)
Unknown
2,341
7.1%
(6.8%, 7.3%)
583
10.1%
(9.3%, 10.9%)
Region
Upper Peninsula
898
2.7%
(2.5%, 2.9%)
390
6.8%
(6.1%, 7.4%)
Northwest LP
1,171
3.5%
(3.3%, 3.7%)
148
2.6%
(2.2%, 3.0%)
Northeast LP
554
1.7%
(1.5%, 1.8%)
173
3.0%
(2.6%, 3.5%)
West/West Central
4,264
12.9%
(12.5%, 13.2%)
892
15.5%
(14.5%, 16.4%)
East Central
1,624
4.9%
(4.7%, 5.1%)
403
7.0%
(6.4%, 7.7%)
East
2,561
7.7%
(7.4%, 8.0%)
511
8.9%
(8.1%, 9.6%)
South Central
1,180
3.6%
(3.4%, 3.8%)
165
2.9%
(2.5%, 3.3%)
Southwest
2,096
6.3%
(6.1%, 6.6%)
388
6.7%
(6.1%, 7.4%)
Southeast
3,151
9.5%
(9.2%, 9.8%)
479
8.3%
(7.6%, 9.0%)
Detroit Metro
9,986
30.1%
(29.6%, 30.6%)
1,445
25.0%
(23.9%, 26.2%)
MI, Unknown Region
1,416
4.3%
(4.1%, 4.5%)
210
3.6%
(3.2%, 4.2%)
Outside MI
2,910
8.8%
(8.5%, 9.1%)
242
4.2%
(3.7%, 4.7%)
Unknown
1,343
4.1%
(3.8%, 4.3%)
326
5.6%
(5.1%, 6.3%)
All percentages reported in the table are presented as weighted estimates that reflect Michigan’s overall nurse population. For example, of RNs who responded to the survey, 28.3% are 55 to 64 years old.
* Data are suppressed if count is less than 10 or sample population was less than 20.Comparison of Survey Respondents to All Nurses Licensed in Michigan
Characteristics
Nurse Population (Licensure Data)
Survey Data
2017
2018
Total
2017
#
%
#
%
#
%
#
%
Total
86,080
–
82,533
–
168,613
–
38,926
–
RNs
73,218
85.1%
70,916
85.9%
144,134
85.5%
33,154
85.2%
Nurse Practitioners
3,242
4.4%
3,088
4.4%
6,330
4.4%
916
2.8%
Nurse Anesthetists
1,399
1.9%
1,208
1.7%
2,607
1.8%
188
0.6%
Nurse Midwives
195
0.3%
168
0.2%
363
0.3%
55
0.2%
Age
<25 years
884
1.2%
1,181
1.7%
2,065
1.4%
433
1.3%
25 to 34 years
13,045
17.8%
13,231
18.7%
26,276
18.2%
4,277
12.9%
35 to 44 years
14,606
19.9%
14,485
20.4%
29,091
20.2%
5,308
16.0%
45 to 54 years
16,395
22.4%
16,324
23.0%
32,719
22.7%
7,121
21.5%
55 to 64 years
19,140
26.1%
17,682
24.9%
36,822
25.5%
9,375
28.3%
65+ years
9,135
12.5%
7,995
11.3%
17,130
11.9%
4,438
13.4%
Unknown
13
0.0%
18
0.0%
31
0.0%
2,202
6.6%
Region
Upper Peninsula
2,004
2.7%
1,997
2.8%
4,001
2.8%
898
2.7%
Northwest LP
2,491
3.4%
2,291
3.2%
4,782
3.3%
1,171
3.5%
Northeast LP
1,209
1.7%
1,121
1.6%
2,330
1.6%
554
1.7%
West/West Central
9,330
12.7%
9,309
13.1%
18,639
12.9%
4,264
12.9%
East Central
3,637
5.0%
3,722
5.2%
7,359
5.1%
1,624
4.9%
East
5,889
8.0%
5,751
8.1%
11,640
8.1%
2,561
7.7%
South Central
2,711
3.7%
2,521
3.6%
5,232
3.6%
1,180
3.6%
Southwest
4,761
6.5%
4,580
6.5%
9,341
6.5%
2,096
6.3%
Southeast
7,435
10.2%
7,220
10.2%
14,655
10.2%
3,151
9.5%
Detroit Metro
24,589
33.6%
24,195
34.1%
48,784
33.8%
9,986
30.1%
MI, Unknown Region
–
–
–
–
–
–
1,416
–
Outside of MI
9,162
12.5%
8,209
11.6%
17,371
12.1%
2,910
8.8%
Unknown
–
–
–
–
–
–
1,343
–
LPNs
12,862
14.9%
11,617
14.1%
24,479
14.5%
5,772
14.8%
Age
<25 years
222
1.7%
190
1.6%
412
1.7%
55
1.0%
25 to 34 years
2,281
17.7%
2,036
17.5%
4,317
17.6%
650
11.3%
35 to 44 years
2,574
20.0%
2,455
21.1%
5,029
20.5%
966
16.7%
45 to 54 years
2,608
20.3%
2,483
21.4%
5,091
20.8%
1,147
19.9%
55 to 64 years
3,362
26.1%
2,987
25.7%
6,349
25.9%
1,703
29.5%
65+ years
1,810
14.1%
1,462
12.6%
3,272
13.4%
801
13.9%
Unknown
*
*
*
*
*
*
450
7.8%
Region
Upper Peninsula
957
7.4%
799
6.9%
1,756
7.2%
390
6.8%
Northwest LP
348
2.7%
334
2.9%
682
2.8%
148
2.6%
Northeast LP
455
3.5%
370
3.2%
825
3.4%
173
3.0%
West/West Central
2,139
16.6%
1,838
15.8%
3,977
16.2%
892
15.5%
East Central
971
7.5%
788
6.8%
1,759
7.2%
403
7.0%
East
1,175
9.1%
1,136
9.8%
2,311
9.4%
511
8.9%
South Central
398
3.1%
339
2.9%
737
3.0%
165
2.9%
Southwest
953
7.4%
840
7.2%
1,793
7.3%
388
6.7%
Southeast
1,078
8.4%
1,117
9.6%
2,195
9.0%
479
8.3%
Detroit Metro
3,682
28.6%
3,423
29.5%
7,105
29.0%
1,445
25.0%
MI, Unknown Region
–
–
–
–
–
–
210
–
Outside of MI
706
633
5.4%
1,339
–
242
–
Unknown
–
–
–
–
–
0.0%
326
5.6%
All percentages reported in the table are presented as weighted estimates that reflect Michigan’s overall nurse population. For example, of RNs who responded to the survey, 28.3% are 55 to 64 years old compared to 26.1% of RNs in the 2017 nursing populations overall.
* Data are suppressed if count is less than 10 or sample population was less than 20.
– Data are not available/data are not applicable.EducationHighest Level of Nursing-Related Education
Education Level
RN = 33,007
LPN = 5,743
Estimate
95% CI
Estimate
95% CI
LPN diploma/certificate
0.0%
(0.0%, 0.0%)
93.6%
(92.9%, 94.2%)
RN diploma in nursing
8.9%
(8.6%, 9.2%)
0.8%
(0.6%, 1.0%)
Associate’s degree in nursing
38.2%
(37.7%, 38.7%)
4.6%
(4.1%, 5.1%)
Bachelor’s degree in nursing
40.9%
(40.4%, 41.5%)
0.9%
(0.7%, 1.1%)
Master’s degree in nursing
10.9%
(10.5%, 11.2%)
0.1%
(0.1%, 0.3%)
Doctorate in Nursing Practice (DNP)
0.6%
(0.5%, 0.7%)
*
*
Doctor of Philosophy in Nursing (PhD)
0.4%
(0.4%, 0.5%)
*
*
Other doctoral degree in nursing
0.1%
(0.1%, 0.1%)
*
*
All percentages reported in the table are presented as weighted estimates that reflect Michigan’s overall nurse population. For example, of RNs who responded to the survey, 8.9% had a RN diploma as their highest level of education.
* Data are suppressed if count is less than 10 or sample population was less than 20. Highest Level of Non-Nursing Education
Education Level
RN = 32,476
LPN = 5,669
Estimate
95% CI
Estimate
95% CI
Non-nursing associate’s degree
13.6%
(13.2%, 13.9%)
22.8%
(21.7%, 23.9%)
Non-nursing bachelor’s degree
13.9%
(13.5%, 14.2%)
6.6%
(6.0%, 7.3%)
Non-nursing master’s degree
5.2%
(5.0%, 5.5%)
1.5%
(1.2%, 1.9%)
Non-nursing doctoral degree
0.8%
(0.7%, 0.8%)
0.3%
(0.2%, 0.5%)
Not applicable
66.6%
(66.1%, 67.1%)
68.8%
(67.6%, 70.0%)
All percentages reported in the table are presented as weighted estimates that reflect Michigan’s overall nurse population. For example, of RNs who responded to the survey, 13.6% has a non-nursing associate degree as their highest level of education.Educational Background that Qualified for First Nursing License
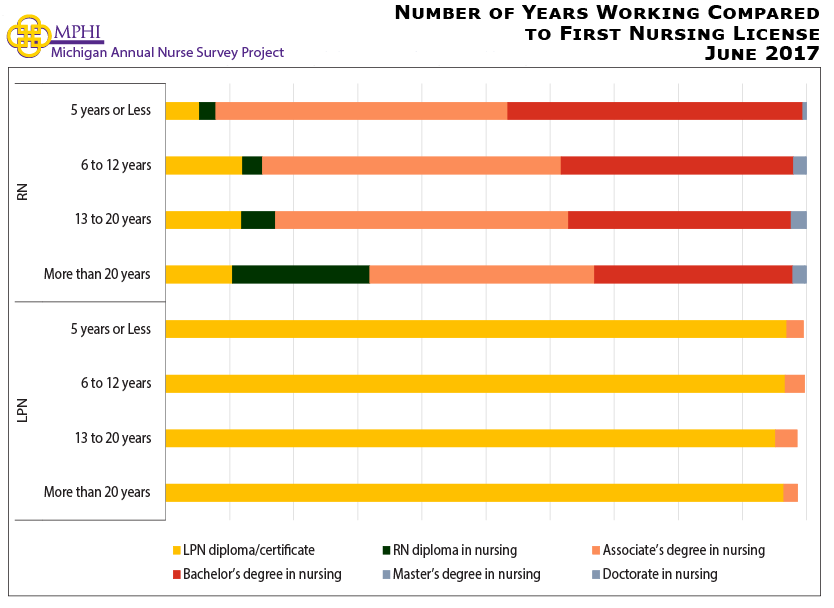
Education Level
RN = 3,689
LPN = 438
Estimate
95% CI
Estimate
95% CI
LPN diploma/certificate
4.5%
(3.9%, 5.2%)
95.4%
(93.1%, 97.0%)
RN diploma in nursing
11.5%
(10.6%, 12.6%)
–
–
Associate’s degree in nursing
37.7%
(36.2%, 39.3%)
4.6%
(3.0%, 6.9%)
Bachelor’s degree in nursing
40.8%
(39.2%, 42.4%)
–
–
Master’s degree in nursing
4.7%
(4.0%, 5.4%)
–
–
Doctorate in nursing
0.7%
(0.5%, 1.1%)
–
–
All percentages reported in the table are presented as weighted estimates that reflect Michigan’s overall nurse population. For example, of RNs who responded to the survey, 11.5% had attained a RN diploma as their first nursing licensure.
– Survey respondents were not given these education levels because they had previously indicated they were LPNs.Number of Years Working Compared to First Nursing LicenseCurrent Specialty Certifications in Michigan
Certification
n = 33,154
Estimate
95% CI
Nurse Anesthetist
1.0%
(0.9%, 1.2%)
Nurse Midwife
0.3%
(0.3%, 0.4%)
Nurse Practitioner
5.1%
(4.9%, 5.3%)
Clinical Nurse Specialist
1.2%
(1.1%, 1.3%)
All percentages reported in the table are presented as weighted estimates that reflect Michigan’s overall nurse population. For example, of RNs who responded to the survey, 5.1% are certified as a Nurse Practitioner.Current Enrollment in Nursing Educational Programs
Degree
RN = 32,997
LPN = 5,082
Estimate
95% CI
Estimate
95% CI
Associate’s Degree in Nursing (ADN)
0.5%
(0.4%, 0.5%)
12.0%
(11.1%, 12.9%)
Bachelor of Science in Nursing (BSN)
5.8%
(5.5%, 6.0%)
2.5%
(2.1%, 3.0%)
Master of Science in Nursing (MSN)
3.6%
(3.4%, 3.8%)
0.1%
(0.0%, 0.2%)
Doctor of Nursing Practice (DNP)
0.7%
(0.7%, 0.8%)
0.0%
(0.0%, 0.1%)
Doctor of Philosophy in Nursing (PhD)
0.2%
(0.1%, 0.2%)
0.0%
(0.0%, 0.1%)
All percentages reported in the table are presented as weighted estimates that reflect Michigan’s overall nurse population. For example, of RNs who responded to the survey, 5.8% are currently enrolled in a Bachelor of Science in Nursing (BSN) program.Educational Preparation to Earn Specialty Certification
Certification
RN = 1,210
LPN = 47
Estimate
95% CI
Estimate
95% CI
Nurse Practitioner
79.0%
(76.6%, 81.2%)
66.7%
(52.4%, 78.4%)
Nurse Midwife
2.4%
(1.7%, 3.5%)
*
*
Nurse Anesthetist
5.7%
(4.5%, 7.1%)
*
*
Clinical Nurse Specialist
9.8%
(8.2%, 11.6%)
33.3%
(21.6%, 47.6%)
Advanced Public Health Nurse
3.1%
(2.3%, 4.2%)
*
*
All percentages reported in the table are presented as weighted estimates that reflect Michigan’s overall nurse population. For example, of RNs who responded they are currently enrolled in an AP associated program, 79.0% are currently enrolled in a Nurse Practitioner program.
* Data are suppressed if count is less than 10 or sample population was less than 20.EmploymentDemographic Characteristics of Employed Nurses
Demographics
RN
LPN
n
Estimate
95% CI
n
Estimate
95% CI
Total
33,154
84.0%
(83.6%, 84.4%)
5,772
79.8%
(78.8%, 80.9%)
Age
18 to 24 years
433
98.6%
(97.5%, 99.7%)
55
89.1%
(80.8%, 97.3%)
25 to 34 years
4,277
94.6%
(93.9%, 95.3%)
650
93.1%
(91.1%, 95.0%)
35 to 44 years
5,308
92.8%
(92.1%, 93.5%)
966
90.7%
(88.9%, 92.5%)
45 to 54 years
7,121
92.0%
(91.4%, 92.6%)
1,147
87.5%
(85.6%, 89.4%)
55 to 64 years
9,375
80.9%
(80.1%, 81.6%)
1,703
73.2%
(71.1%, 75.3%)
65+ years
4,438
42.6%
(41.1%, 44.0%)
801
45.4%
(42.0%, 48.9%)
Gender
Female
29,026
83.5%
(83.1%, 83.9%)
5,061
79.5%
(78.4%, 80.6%)
Male
2,509
89.9%
(88.8%, 91.1%)
342
85.1%
(81.3%, 88.8%)
Race
White
27,589
83.5%
(83.0%, 83.9%)
4,114
77.2%
(75.9%, 78.5%)
Black or African American
2,091
87.5%
(86.1%, 88.9%)
1,073
89.2%
(87.4%, 91.1%)
Other
2,113
89.4%
(88.1%, 90.7%)
299
79.1%
(74.5%, 83.7%)
Ethnicity
Hispanic or Latino
544
89.9%
(87.4%, 92.5%)
108
87.0%
(80.6%, 93.3%)
Not Hispanic or Latino
30,269
83.9%
(83.5%, 84.4%)
5,081
79.8%
(78.7%, 80.9%)
Residency
Upper Peninsula
898
82.6%
(80.1%, 85.1%)
390
78.2%
(74.1%, 82.3%)
Northwest LP
1,171
80.7%
(78.4%, 82.9%)
148
65.5%
(57.8%, 73.1%)
Northeast LP
554
78.6%
(75.2%, 82.0%)
173
79.6%
(73.6%, 85.6%)
West/West Central
4,264
84.7%
(83.6%, 85.7%)
892
78.4%
(75.7%, 81.1%)
East Central
1,624
83.6%
(81.8%, 85.4%)
403
76.8%
(72.7%, 80.9%)
East
2,561
82.4%
(80.9%, 83.9%)
511
78.9%
(75.3%, 82.4%)
South Central
1,180
83.4%
(81.2%, 85.5%)
165
79.6%
(73.5%, 85.8%)
Southwest
2,096
84.2%
(82.6%, 85.7%)
388
82.3%
(78.5%, 86.1%)
Southeast
3,151
82.9%
(81.6%, 84.2%)
479
81.0%
(77.5%, 84.5%)
Detroit Metro
9,986
85.5%
(84.8%, 86.2%)
1,445
83.6%
(81.7%, 85.5%)
Outside MI
2,910
80.5%
(79.1%, 81.9%)
242
69.4%
(63.5%, 75.2%)
All percentages reported in the table are presented as weighted estimates that reflect Michigan’s overall nurse population. For example, of RNs 25 years or younger who responded to the survey, 94.6% are employed.Current Employment Status
Employment
RN = 33,154
LPN = 5,772
Estimate
95% CI
Estimate
95% CI
Actively employed in nursing
or a position that requires a
nurse license full-time
65.1%
(64.6%, 65.6%)
61.3%
(60.1%, 62.6%)
Actively employed in nursing
or a position that requires
a nurse license part-time
13.2%
(12.8%, 13.6%)
15.0%
(14.1%, 16.0%)
Actively employed in nursing
or a position that requires
a nurse license on a per-diem basis
6.6%
(6.4%, 6.9%)
5.9%
(5.3%, 6.5%)
Actively employed in a field
other than nursing full-time
2.1%
(2.0%, 2.3%)
3.4%
(3.0%, 3.9%)
Actively employed in a field
other than nursing part-time
1.3%
(1.2%, 1.4%)
2.6%
(2.3%, 3.1%)
Actively employed in a field
other than nursing on a
per-diem basis
0.5%
(0.5%, 0.6%)
0.5%
(0.3%, 0.7%)
Working in nursing only as
a volunteer
1.4%
(1.3%, 1.6%)
1.5%
(1.2%, 1.9%)
Unemployed, seeking
work as a nurse
2.0%
(1.9%, 2.2%)
3.5%
(3.0%, 4.0%)
Unemployed, not seeking
work as a nurse
3.3%
(3.1%, 3.5%)
4.2%
(3.7%, 4.8%)
Retired
10.1%
(9.8%, 10.4%)
9.8%
(9.0%, 10.5%)
All percentages reported in the table are presented as weighted estimates that reflect Michigan’s overall nurse population. For example, of RNs who responded to the survey, 65.1% were actively employed in nursing or in a position that requires a nurse license full-time.Prosperity Region of Residency & Employment among Michigan Nurses
Prosperity Region
RNs
LPNs
Place of Residency
Place of Employment
Place of Residency
Place of Employment
Estimate
95% CI
Estimate
95% CI
Estimate
95% CI
Estimate
95% CI
Upper Peninsula
2.7%
(2.5%, 3.0%)
2.9%
(2.7%, 3.1%)
7.1%
(6.3%, 7.9%)
7.6%
(6.8%, 8.5%)
Northwest LP
3.2%
(3.0%, 3.4%)
3.4%
(3.1%, 3.6%)
2.3%
(1.9%, 2.8%)
2.6%
(2.1%, 3.1%)
Northeast LP
1.5%
(1.4%, 1.7%)
1.4%
(1.3%, 1.6%)
3.3%
(2.8%, 3.9%)
3.3%
(2.7%, 3.9%)
West/West Central
13.1%
(12.7%, 13.5%)
12.9%
(12.5%, 13.3%)
16.1%
(15.0%, 17.2%)
15.3%
(14.2%, 16.5%)
East Central
5.1%
(4.8%, 5.4%)
5.4%
(5.1%, 5.7%)
6.9%
(6.2%, 7.7%)
7.0%
(6.2%, 7.8%)
East
8.0%
(7.6%, 8.3%)
6.6%
(6.3%, 6.9%)
9.3%
(8.5%, 10.2%)
7.9%
(7.1%, 8.8%)
South Central
3.6%
(3.4%, 3.9%)
3.9%
(3.6%, 4.1%)
3.0%
(2.5%, 3.6%)
2.9%
(2.4%, 3.5%)
Southwest
6.5%
(6.2%, 6.8%)
6.8%
(6.5%, 7.1%)
7.6%
(6.8%, 8.4%)
8.1%
(7.3%, 9.1%)
Southeast
10.1%
(9.7%, 10.5%)
11.0%
(10.6%, 11.4%)
9.2%
(8.3%, 10.1%)
9.3%
(8.4%, 10.3%)
Detroit Metro
34.6%
(34.0%, 35.2%)
34.2%
(33.6%, 34.8%)
30.6%
(29.2%, 32.0%)
30.9%
(29.5%, 32.4%)
Outside MI
11.6%
(11.2%, 12.0%)
11.6%
(11.2%, 12.0%)
4.8%
(4.2%, 5.5%)
5.1%
(4.4%, 5.8%)
All percentages reported in the table are presented as weighted estimates that reflect Michigan’s overall nurse population. For example, of RNs who responded to the survey, 2.7% live in the Upper Peninsula.Nurses Licensed Out of State or Country
Region
RN = 33,154
LPN = 5,772
Estimate
95% CI
Estimate
95% CI
Michigan Only
84.2%
(83.8%, 84.6%)
88.9%
(88.1%, 89.7%)
Other U.S. State
14.2%
(13.8%, 14.6%)
10.8%
(10.1%, 11.7%)
Ohio
20.7%
(19.6%, 21.9%)
24.2%
(23.1%, 25.3%)
Indiana
13.9%
(13.0%, 15.0%)
11.7%
(10.9%, 12.5%)
Illinois
12.0%
(11.1%, 13.0%)
4.9%
(4.4%, 5.5%)
Wisconsin
11.5%
(10.6%, 12.4%)
9.1%
(8.4%, 9.9%)
Florida
18.1%
(17.0%, 19.2%)
12.8%
(11.9%, 13.7%)
Other Country
2.2%
(2.1%, 2.4%)
0.4%
(0.3%, 0.7%)
Canada
53.6%
(50.0%, 57.2%)
27.0%
(25.9%, 28.2%)
Other State & Country
0.6%
(0.6%, 0.7%)
0.2%
(0.1%, 0.3%)
All percentages reported in the table are presented as weighted estimates that reflect Michigan’s overall nurse population. For example, of RNs who have licenses in another state or county, 20.7% indicated that their license is in Ohio.
*Please note the percentages reported for specific states and countries are a percentage of the Other U.S. State and Other Country categories, respectively.Reasons for Working as a Nurse Part-Time or on a Per Diem Basis
Reason
RN = 5,514
LPN = 925
Estimate
95% CI
Estimate
95% CI
Taking care of home and family
47.8%
(46.5%, 49.1%)
35.7%
(32.7%, 38.9%)
School
9.3%
(8.5%, 10.1%)
24.9%
(22.2%, 27.8%)
Difficulty finding a full-time nursing position
3.0%
(2.6%, 3.5%)
5.1%
(3.9%, 6.7%)
Prefer to work part-time or per diem basis
45.3%
(44.0%, 46.6%)
32.4%
(29.4%, 35.5%)
Semi-retired
15.4%
(14.5%, 16.4%)
20.6%
(18.1%, 23.3%)
Other
10.6%
(9.8%, 11.4%)
11.4%
(9.5%, 13.6%)
All percentages reported in the table are presented as weighted estimates that reflect Michigan’s overall nurse population. For example, of RNs who are working as a nurse part-time or on a per diem basis, 47.8% indicated that it is because they are taking care of their home and family.Current Employment StatusNumber of Currently Employed Nursing Positions
Number of Positions
RN = 27,108
LPN = 4,496
Estimate
95% CI
Estimate
95% CI
1 Position
87.3%
(86.9%, 87.7%)
84.2%
(83.1%, 85.3%)
2 Position
11.0%
(10.6%, 11.4%)
13.7%
(12.8%, 14.8%)
3+ Positions
1.7%
(1.5%, 1.8%)
2.0%
(1.6%, 2.5%)
All percentages reported in the table are presented as weighted estimates that reflect Michigan’s overall nurse population. For example, of RNs who responded to the survey, 87.3% have one nursing position.Number of Years Been a Licensed Nurse (RN and LPN)
Years
RN = 32,680
LPN = 5,643
Estimate
95% CI
Estimate
95% CI
5 years or Less
16.2%
(15.8%, 16.6%)
23.0%
(21.9%, 24.1%)
6 to 12 years
16.2%
(15.8%, 16.6%)
18.0%
(17.0%, 19.0%)
13 to 20 years
14.5%
(14.1%, 14.8%)
12.2%
(11.3%, 13.0%)
More than 20 years
53.2%
(52.6%, 53.7%)
46.9%
(45.6%, 48.2%)
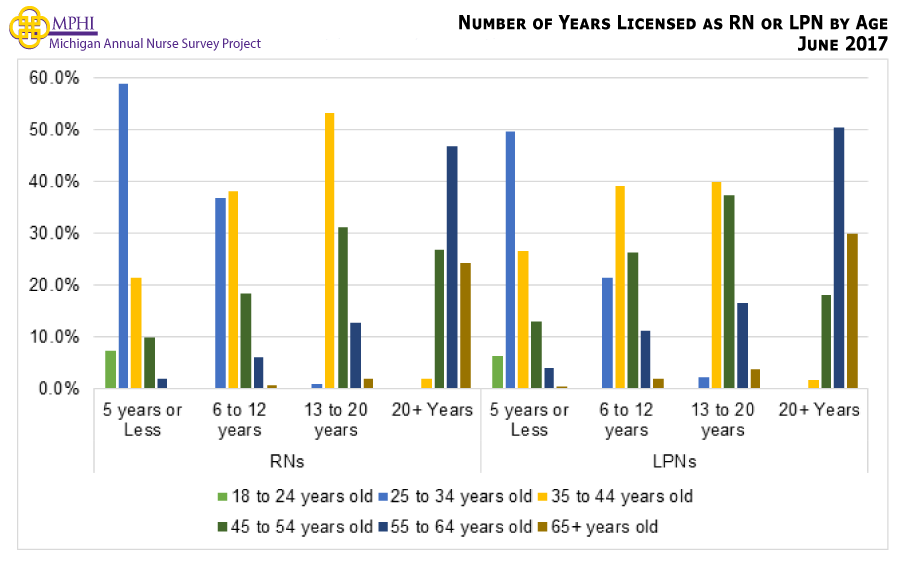
All percentages reported in the table are presented as weighted estimates that reflect Michigan’s overall nurse population. For example, of RNs who responded to the survey, 16.2% have been licensed as a nurse for less than 5 years.Number of Years been a Licensed Nurse Compared to Age (RN and LPN)Number of Years Been a Licensed Nurse (APRN)
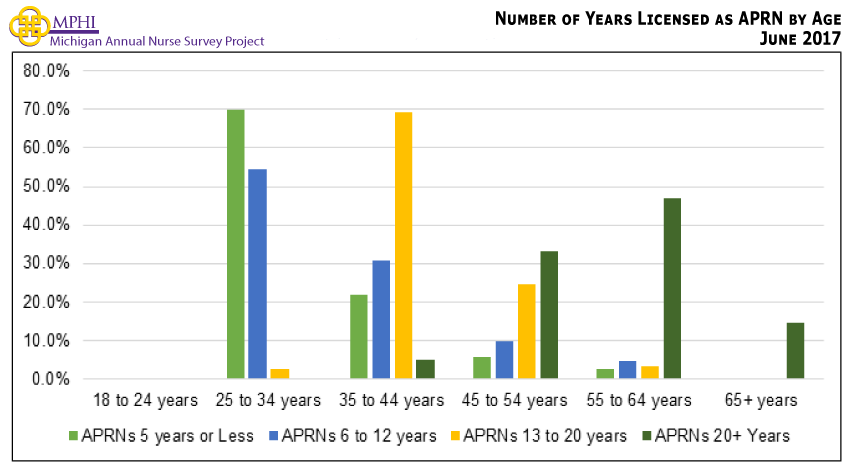
Years
APRN = 1,139
Estimate
95% CI
5 years or less
2.8%
(1.9%, 3.8%)
6 to 12 years
19.8%
(17.4%, 22.1%)
13 to 20 years
19.0%
(16.7%, 21.2%)
More than 20 years
58.5%
(55.6%, 61.3%)
All percentages reported in the table are presented as weighted estimates that reflect Michigan’s overall nurse population. For example, of APNs who responded to the survey, 2.8% have been licensed as a nurse for less than 5 years.Number of Years been a Licensed Nurse Compared to Age (APRN)Number of Years Working as a Nurse (RN and LPN)
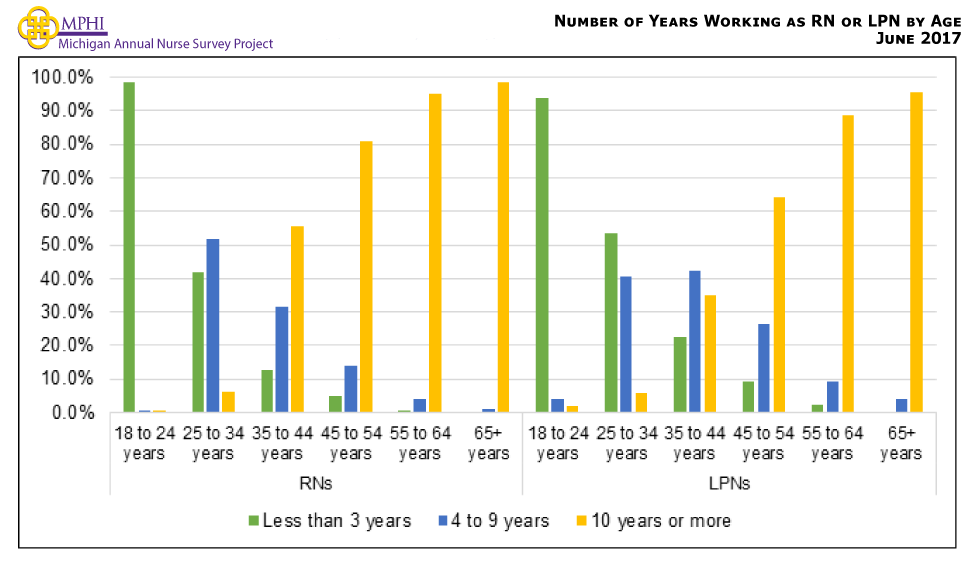
Years
RN = 26,009
LPN = 4,234
Estimate
95% CI
Estimate
95% CI
Less than 3 years
14.6%
(14.2%, 15.0%)
20.7%
(19.5%, 21.9%)
4 to 9 years
22.3%
(21.8%, 22.8%)
26.8%
(25.5%, 28.1%)
10 years or more
63.1%
(62.5%, 63.7%)
52.5%
(51.0%, 54.0%)
All percentages reported in the table are presented as weighted estimates that reflect Michigan’s overall nurse population. For example, of RNs who responded to the survey, 14.6% have worked as a nurse for less than 3 years.Number of Years Working as a Nurse Compared to Age (RN and LPN)Number of Years Working as a Nurse (APRN)
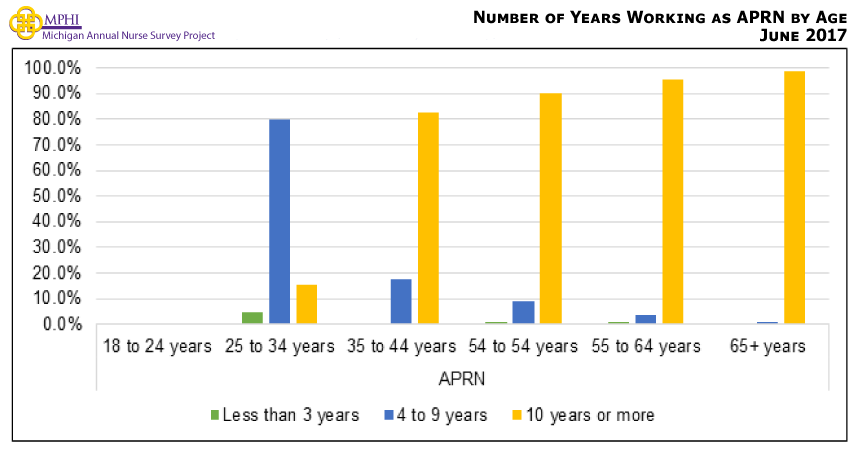
Years
APRN = 1,013
Estimate
95% CI
Less than 3 years
1.1%
(0.5%, 1.8%)
4 to 9 years
21.1%
(18.6%, 23.6%)
10 years or more
77.8%
(75.2%, 80.4%)
All percentages reported in the table are presented as weighted estimates that reflect Michigan’s overall nurse population. For example, of RNs who responded to the survey, 1.1% have worked as a nurse for less than 3 years.Number of Years Working as a Nurse Compared to Age (APRN)Plans to Continue Working as a Nurse (RN and LPN)
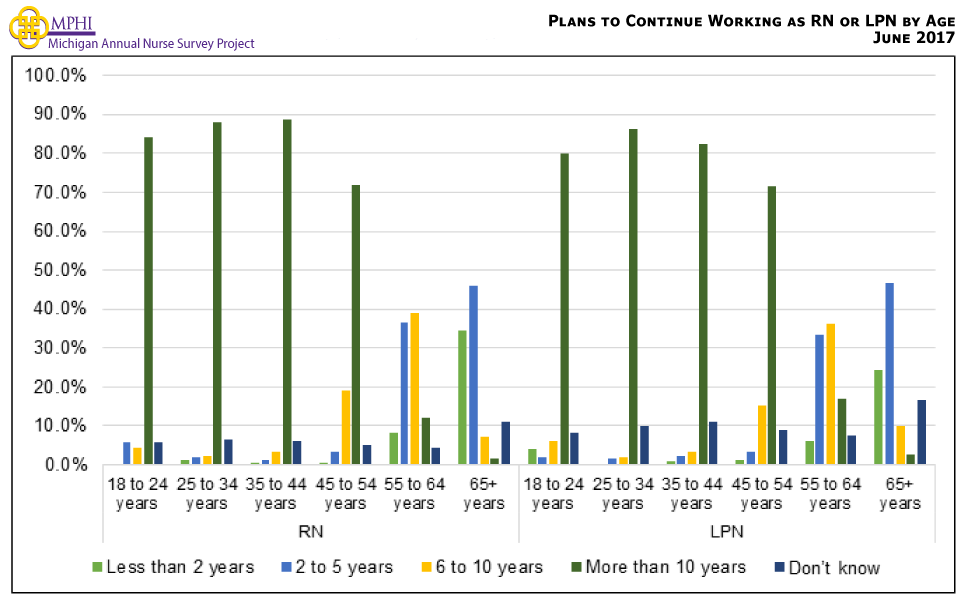
Years
RN = 26,150
LPN = 4,251
Estimate
95% CI
Estimate
95% CI
Less than 2 years
4.6%
(4.4%, 4.9%)
3.9%
(3.3%, 4.5%)
2 to 5 years
13.4%
(12.9%, 13.8%)
13.1%
(12.1%, 14.1%)
6 to 10 years
16.0%
(15.6%, 16.5%)
14.1%
(13.0%, 15.1%)
More than 10 years
60.2%
(59.7%, 60.8%)
59.0%
(57.6%, 60.5%)
Don’t know
5.7%
(5.5%, 6.0%)
9.9%
(9.0%, 10.8%)
All percentages reported in the table are presented as weighted estimates that reflect Michigan’s overall nurse population. For example, of RNs who responded to the survey, 4.6% were planning to continue to work as a nurse for less than 2 years.Plans to Continue to Practice Nursing (in years) by Age (RN and LPN)Plans to Continue Working as a Nurse (APRN)
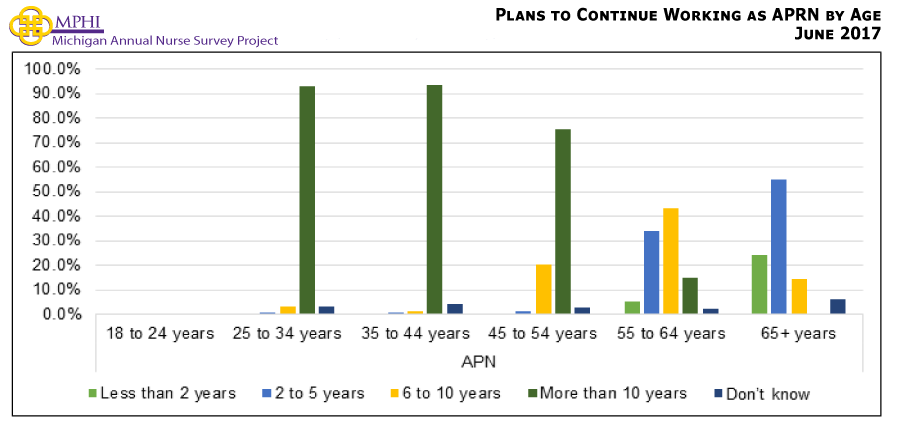
Years
APRN = 1,026
Estimate
95% CI
Less than 2 years
2.8%
(1.8%, 3.8%)
2 to 5 years
12.5%
(10.5%, 14.6%)
6 to 10 years
17.9%
(15.6%, 20.2%)
More than 10 years
63.4%
(60.5%, 66.4%)
Don’t know
3.3%
(2.2%, 4.4%)
All percentages reported in the table are presented as weighted estimates that reflect Michigan’s overall nurse population. For example, of APNs who responded to the survey, 2.8% were planning to continue to work as a nurse for less than 2 years.Plans to Continue to Practice Nursing (in years) by Age (APRN)Plans to Continue Practice Nursing (in years) by Prosperity Region
Prosperity Region
RN
LPN
Less than 2 years
2 to 5 years
6 to 10 years
More than 10 years
Don’t Know
Less than 2 years
2 to 5 years
6 to 10 years
More than 10 years
Don’t Know
Upper Peninsula
4.3%
14.7%
15.6%
59.6%
5.9%
4.7%
12.4%
15.3%
61.5%
6.1%
Northwest LP
5.2%
17.3%
18.7%
53.9%
5.0%
8.9%
20.8%
19.5%
43.7%
7.1%
Northeast LP
3.8%
14.4%
15.0%
60.5%
6.2%
2.3%
13.8%
15.9%
60.8%
7.2%
West/West Central
4.4%
12.2%
14.6%
64.8%
4.0%
4.3%
17.6%
16.1%
53.9%
8.1%
East Central
4.6%
12.2%
14.8%
63.6%
4.8%
3.9%
15.0%
15.6%
56.1%
9.4%
East
3.7%
12.5%
15.1%
63.8%
5.0%
4.1%
16.0%
15.1%
55.1%
9.7%
South Central
4.5%
15.6%
14.9%
61.0%
4.1%
5.1%
7.9%
13.8%
65.6%
7.5%
Southwest
5.3%
14.0%
17.1%
59.3%
4.2%
3.3%
12.5%
16.7%
61.1%
6.4%
Southeast
5.2%
13.8%
14.4%
61.1%
5.6%
2.6%
10.7%
12.0%
64.8%
9.8%
Detroit Metro
4.8%
13.2%
16.1%
59.0%
7.0%
3.4%
11.8%
13.0%
59.9%
11.9%
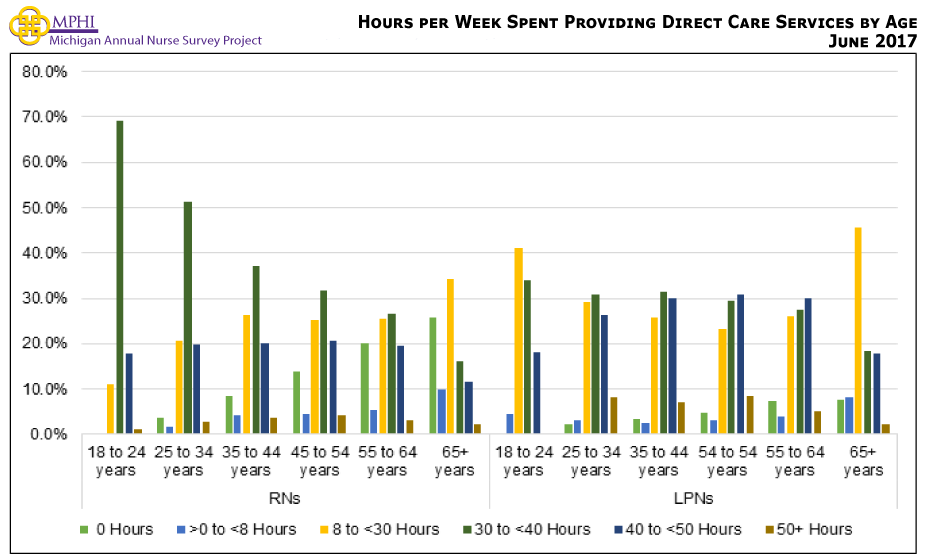
All percentages reported in the table are presented as weighted estimates that reflect Michigan’s overall nurse population. For example, of RNs who indicated live in the Upper Peninsula, 4.3% plan to continue working for less than 2 years.Direct CareHours per Week Spent Providing Direct Care Services
Hours
RN = 26,583
LPN = 4,351
Estimate
95% CI
Estimate
95% CI
0 Hours
12.6%
(12.2%, 13.0%)
4.7%
(4.1%, 5.3%)
>0 to <8 Hours
4.3%
(04.1%, 04.5%)
3.7%
(03.1%, 04.2%)
8 to <30 Hours
24.9%
(24.3%, 25.4%)
27.6%
(26.3%, 29.0%)
30 to <40 Hours
35.4%
(34.8%, 36.0%)
28.9%
(27.6%, 30.3%)
40 to <50 Hours
19.5%
(19.0%, 19.9%)
28.3%
(27.0%, 29.7%)
50+ Hours
3.4%
(3.2%, 3.7%)
6.7%
(6.0%, 7.5%)
All percentages reported in the table are presented as weighted estimates that reflect Michigan’s overall nurse population. For example, of RNs who provide direct care services, 12.6% work 0 hours per week providing direct care services.Hours per Week Spent Providing Direct Care Services by AgePlans to Stop Working in the Next 5 Years
Plans to Stop Working in Next 5 Years
RNs
LPNs
n
Estimate
95% CI
n
Estimate
95% CI
Provides Direct Patient Care
13,644
13.5%
(13.0%, 14.0%)
2,373
14.2%
(12.9%, 15.6%)
Does Not Provide Direct Patient Care
4,510
31.2%
(30.6%, 31.9%)
323
31.3%
(29.6%, 33.1%)
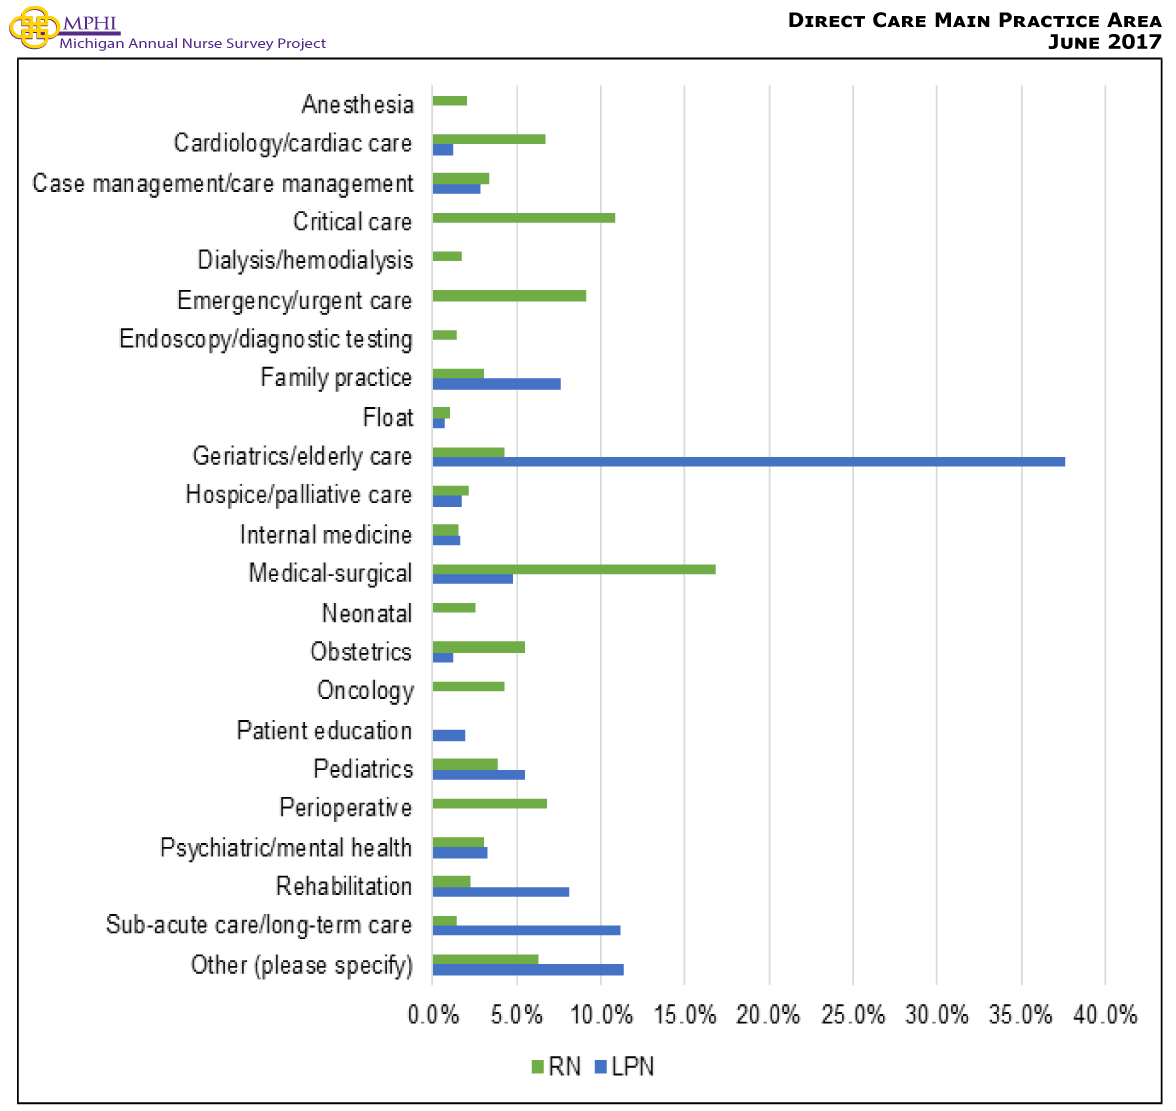
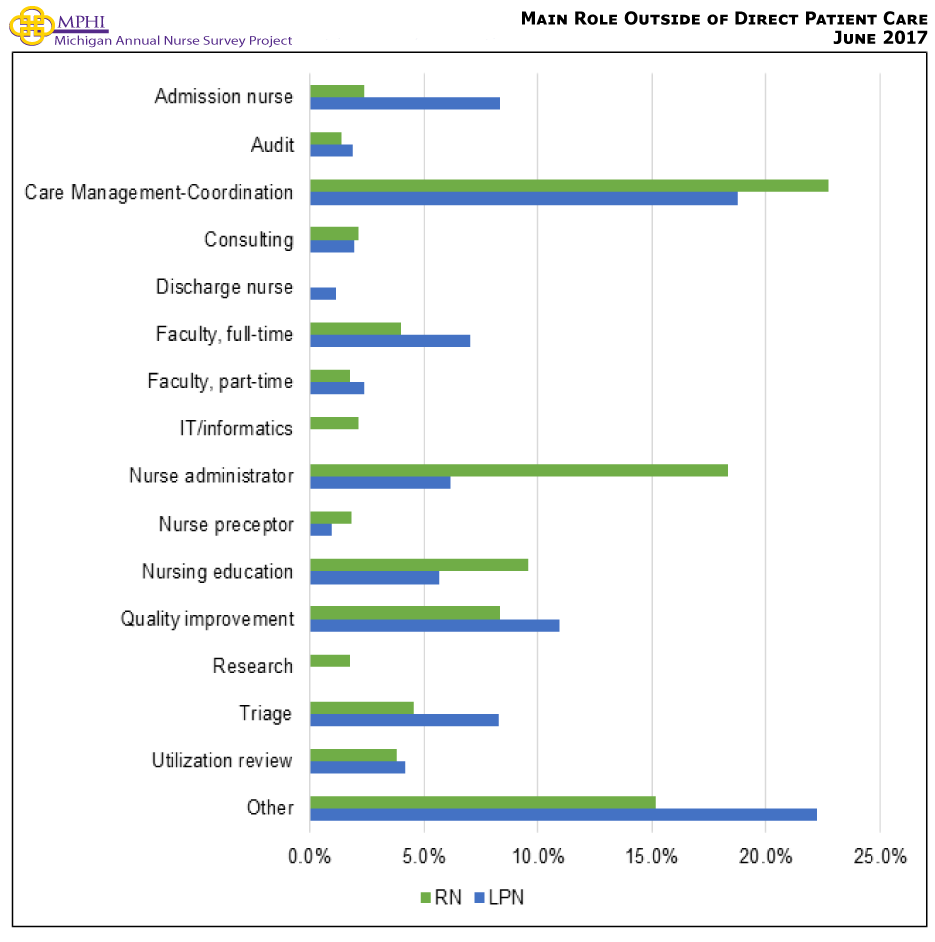
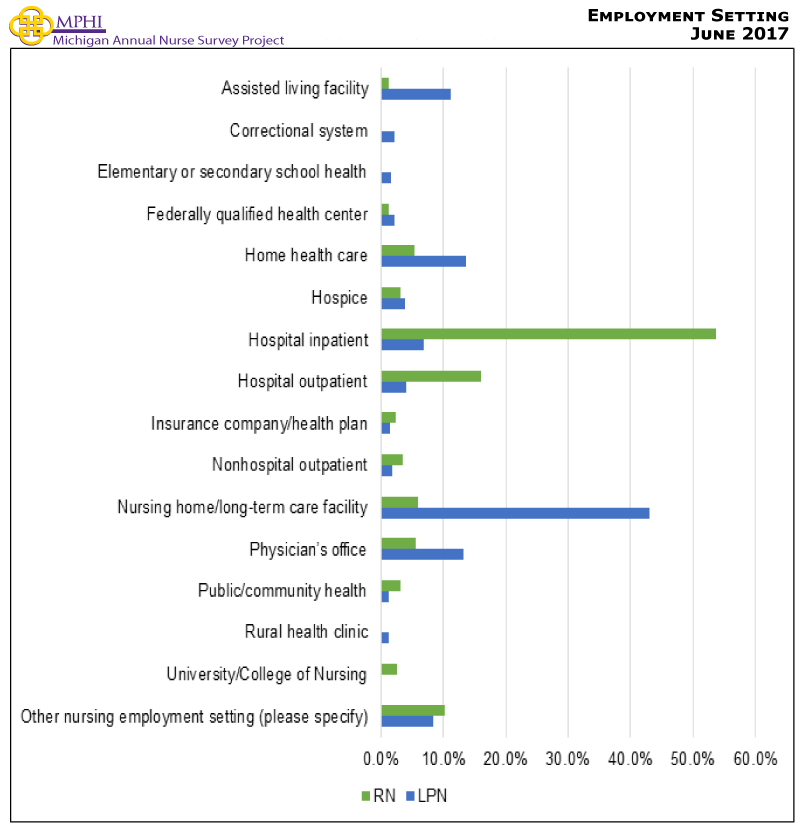
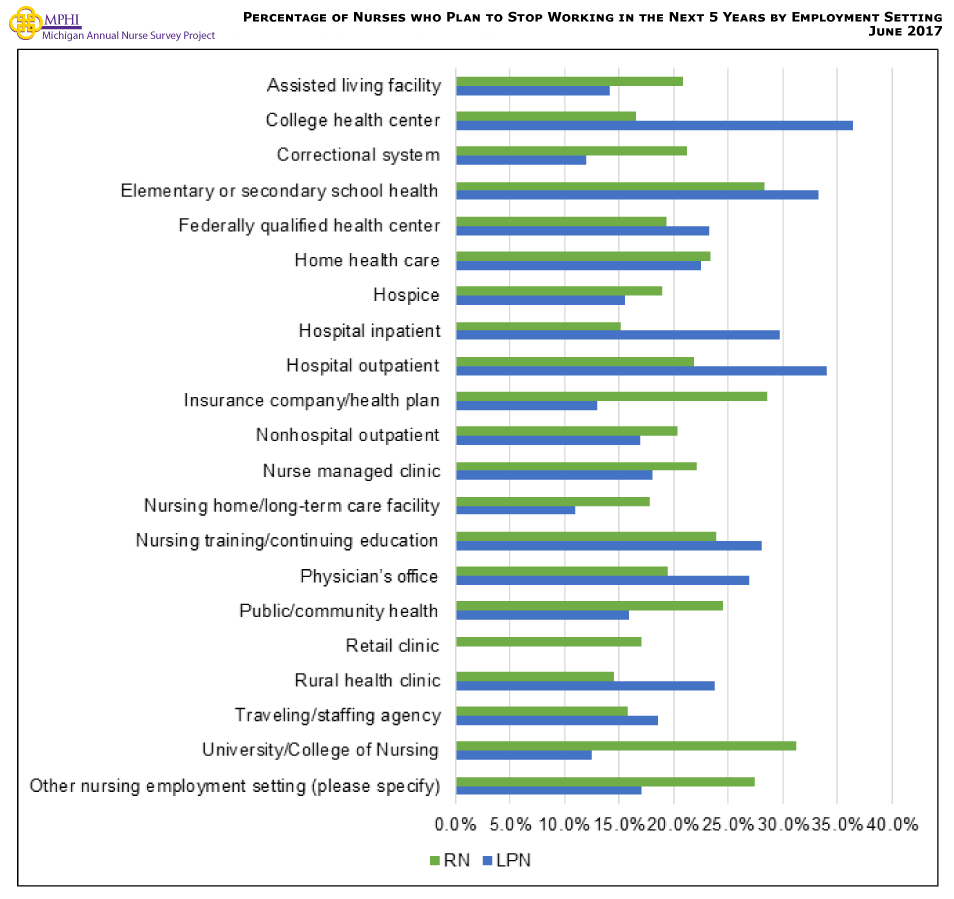
All percentages reported in the table are presented as weighted estimates that reflect Michigan’s overall nurse population. For example, of RNs who provide direct patient care, 13.5% plan to leave nursing in the next five years.Direct Care Main Practice AreaMain Role Outside of Direct Patient CarePractice SettingEmployment SettingPercentage of Nurses who Plan to Stop Working in the Next 5 Years by Employment SettingThe Number of Interprofessional Activities
Number of Interprofessional Activities
RN = 25,604
LPN = 4,161
Estimate
95% CI
Estimate
95% CI
0
9.6%
(9.2%, 10.0%)
17.6%
(16.5%, 18.8%)
1
13.4%
(13.0%, 13.9%)
19.3%
(18.1%, 20.5%)
2
13.8%
(13.4%, 14.2%)
15.0%
(14.0%, 16.1%)
3
14.0%
(13.6%, 14.4%)
14.1%
(13.1%, 15.2%)
4
13.3%
(12.8%, 13.7%)
10.9%
(10.0%, 11.9%)
5
12.1%
(11.7%, 12.5%)
9.0%
(8.1%, 9.9%)
6
10.1%
(9.7%, 10.4%)
6.2%
(5.5%, 7.0%)
7
13.7%
(13.3%, 14.2%)
7.9%
(7.1%, 8.8%)
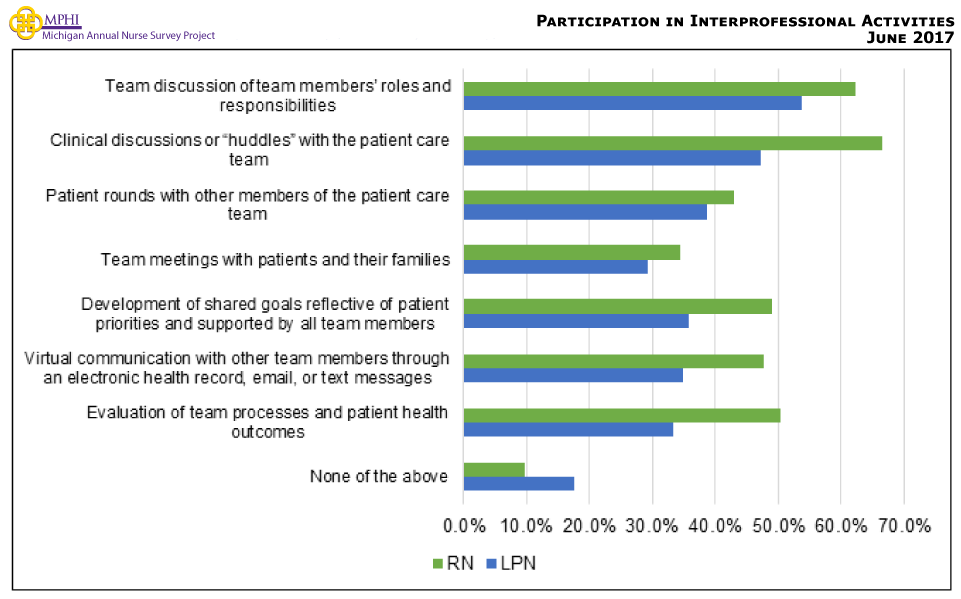
All percentages reported in the table are presented as weighted estimates that reflect Michigan’s overall nurse population. For example, of RNs who responded to the survey, 9.6% indicated they had no interprofessional activities.Participation in Interprofessional ActivitiesChange in Employment Setting
Change in Employment Setting
RN = 27,232
LPN = 4,528
Estimate
95% CI
Estimate
95% CI
Did not make a change
80.1%
(79.6%, 80.5%)
81.8%
(80.7%, 82.9%)
Made a change
19.9%
(19.5%, 20.4%)
18.2%
(17.1%, 19.3%)
Of those who made a change:
An inpatient setting to an outpatient setting?
32.7%
(31.4%, 34.0%)
23.7%
(20.8%, 26.9%)
An outpatient setting to an inpatient setting?
12.1%
(11.2%, 13.0%)
10.5%
(8.5%, 12.9%)
A primary care setting (e.g., family practice, general medicine)?
10.4%
(9.6%, 11.3%)
16.8%
(14.3%, 19.7%)
A specialty care setting to a primary care setting?
6.1%
(5.5%, 6.8%)
11.9%
(9.8%, 14.5%)
A sub-acute care setting to an acute care setting?
9.8%
(9.0%, 10.7%)
10.8%
(8.7%, 13.2%)
An acute care setting to a sub-acute care setting?
7.0%
(6.3%, 7.7%)
8.6%
(6.8%, 10.8%)
A direct patient care setting to a non-direct patient care setting?
25.9%
(24.7%, 27.1%)
22.4%
(19.6%, 25.5%)
A non-direct patient care setting to a direct patient care setting?
8.9%
(8.2%, 9.7%)
12.2%
(10.0%, 14.8%)
All percentages reported in the table are presented as weighted estimates that reflect Michigan’s overall nurse population. For example, of RNs who made a change in employment, 32.7% indicated they changed from an inpatient setting to an outpatient setting.Prosperity RegionsNumber of Hours Worked Each Week for Each Prosperity Region
Hours per Week
RN
LPN
Estimate
95% CI
Estimate
95% CI
Total
n = 26,923
n = 4,441
<30 Hours
16.1%
(15.6%, 16.5%)
17.6%
(16.5%, 18.7%)
30 to 39 Hours
33.5%
(33.0%, 34.1%)
25.4%
(24.2%, 26.7%)
40 to 49 Hours
38.4%
(37.8%, 39.0%)
45.0%
(43.5%, 46.5%)
50+ Hours
12.0%
(11.6%, 12.4%)
11.9%
(11.0%, 12.9%)
Upper Peninsula
n = 721
n = 292
<30 Hours
16.4%
(13.9%, 19.3%)
16.5%
(12.7%, 21.2%)
30 to 39 Hours
33.9%
(30.5%, 37.4%)
21.6%
(17.3%, 26.7%)
40 to 49 Hours
39.3%
(35.8%, 43.0%)
57.7%
(52.0%, 63.2%)
50+ Hours
10.4%
(8.4%, 12.8%)
4.2%
(2.4%, 7.1%)
Northwest LP
n = 921
n = 96
<30 Hours
16.8%
(14.6%, 19.4%)
15.3%
(9.5%, 23.9%)
30 to 39 Hours
40.0%
(36.9%, 43.2%)
37.3%
(28.3%, 47.3%)
40 to 49 Hours
32.1%
(29.2%, 35.2%)
40.0%
(30.8%, 50.0%)
50+ Hours
11.0%
(9.1%, 13.2%)
7.3%
(3.6%, 14.3%)
Northeast LP
n = 420
n = 137
<30 Hours
10.6%
(8.0%, 13.9%)
12.4%
(7.9%, 19.0%)
30 to 39 Hours
27.2%
(23.2%, 31.7%)
31.6%
(24.4%, 39.8%)
40 to 49 Hours
47.3%
(42.5%, 52.1%)
45.9%
(37.8%, 54.2%)
50+ Hours
14.9%
(11.8%, 18.6%)
10.1%
(6.1%, 16.3%)
West/West Central
n = 3,498
n = 675
<30 Hours
21.3%
(19.9%, 22.6%)
22.1%
(19.2%, 25.4%)
30 to 39 Hours
36.9%
(35.3%, 38.5%)
25.5%
(22.4%, 28.9%)
40 to 49 Hours
31.9%
(30.4%, 33.5%)
42.9%
(39.2%, 46.7%)
50+ Hours
9.9%
(9.0%, 10.9%)
9.4%
(7.4%, 11.9%)
East Central
n = 1,332
n = 297
<30 Hours
13.0%
(11.3%, 14.9%)
16.9%
(13.1%, 21.6%)
30 to 39 Hours
33.7%
(31.2%, 36.3%)
27.0%
(22.3%, 32.4%)
40 to 49 Hours
41.8%
(39.2%, 44.5%)
44.4%
(38.8%, 50.1%)
50+ Hours
11.4%
(9.8%, 13.3%)
11.7%
(8.5%, 15.8%)
East
n = 2,033
n = 391
<30 Hours
14.5%
(13.0%, 16.1%)
19.5%
(15.9%, 23.7%)
30 to 39 Hours
30.7%
(28.7%, 32.7%)
26.3%
(22.2%, 30.9%)
40 to 49 Hours
43.7%
(41.6%, 45.9%)
40.8%
(36.0%, 45.7%)
50+ Hours
11.1%
(9.8%, 12.5%)
13.4%
(10.4%, 17.2%)
South Central
n = 956
n = 118
<30 Hours
16.0%
(13.8%, 18.5%)
20.3%
(14.0%, 28.4%)
30 to 39 Hours
35.4%
(32.5%, 38.5%)
18.7%
(12.7%, 26.7%)
40 to 49 Hours
36.0%
(33.0%, 39.1%)
46.6%
(37.8%, 55.6%)
50+ Hours
12.5%
(10.6%, 14.8%)
14.4%
(9.2%, 21.9%)
Southwest
n = 1,709
n = 313
<30 Hours
16.7%
(15.0%, 18.5%)
19.9%
(15.9%, 24.7%)
30 to 39 Hours
32.2%
(30.1%, 34.5%)
20.7%
(16.6%, 25.6%)
40 to 49 Hours
38.8%
(36.5%, 41.1%)
46.9%
(41.4%, 52.4%)
50+ Hours
12.3%
(10.8%, 14.0%)
12.5%
(9.3%, 16.6%)
Southeast
n = 2,546
n = 376
<30 Hours
16.5%
(15.1%, 18.0%)
14.5%
(11.3%, 18.5%)
30 to 39 Hours
35.1%
(33.3%, 37.0%)
22.3%
(18.4%, 26.8%)
40 to 49 Hours
38.7%
(36.8%, 40.6%)
51.2%
(46.2%, 56.2%)
50+ Hours
9.6%
(8.5%, 10.8%)
11.9%
(9.0%, 15.6%)
Detroit Metro
n = 8,332
n = 1,185
<30 Hours
16.4%
(15.6%, 17.2%)
14.1%
(12.2%, 16.2%)
30 to 39 Hours
33.8%
(32.8%, 34.8%)
28.1%
(25.6%, 30.7%)
40 to 49 Hours
38.2%
(37.1%, 39.2%)
43.5%
(40.7%, 46.3%)
50+ Hours
11.7%
(11.0%, 12.4%)
14.4%
(12.5%, 16.5%)
All percentages reported in the table are presented as weighted estimates that reflect Michigan’s overall nurse population. For example, of RNs who live in the Upper Peninsula, 16.4% indicated they work for less than 30 hours per week.