2019 Annual Survey of Nurses
Survey Data Tables
Analysis of the survey responses are presented in tables and charts below:
Survey Respondents & Response Rates
Demographic Characteristics of Survey Respondents
| Demographics | RN = 15,896 | LPN = 1,818 | ||
|---|---|---|---|---|
| n | Estimate | n | Estimate | |
| Age | ||||
| <25 years | 224 | 1.4% | 17 | 0.9% |
| 25 to 34 years | 2,548 | 16.0% | 240 | 13.2% |
| 35 to 44 years | 2,725 | 17.1% | 328 | 18.0% |
| 45 to 54 years | 2,827 | 17.8% | 344 | 18.9% |
| 55 to 64 years | 3,946 | 24.8% | 466 | 25.6% |
| 65 to 74 years | 2,221 | 14.0% | 203 | 11.2% |
| 75+ years | 269 | 1.7% | 20 | 1.1% |
| Unknown | 1,136 | 7.1% | 200 | 11.0% |
| Gender | ||||
| Female | 13,791 | 86.8% | 1,548 | 85.1% |
| Male | 1,306 | 8.2% | 105 | 5.8% |
| Unknown | 799 | 5.0% | 165 | 9.1% |
| Race | ||||
| White | 13,593 | 85.5% | 1,259 | 69.3% |
| Black or African American | 780 | 4.9% | 323 | 17.8% |
| American Indian or Alaska Native | 163 | 1.0% | 29 | 1.6% |
| Asian | 409 | 2.6% | 29 | 1.6% |
| Native Hawaiian or Pacific Islander | 42 | 0.3% | * | * |
| Middle Eastern | 118 | 0.7% | * | * |
| Other | 215 | 1.4% | 43 | 2.4% |
| Unknown | 914 | 5.7% | 174 | 9.6% |
| Ethnicity | ||||
| Hispanic or Latino | 299 | 1.9% | 41 | 2.3% |
| Not Hispanic or Latino | 14,610 | 91.9% | 1,583 | 87.1% |
| Unknown | 987 | 6.2% | 194 | 10.7% |
| Prosperity Region | ||||
| Upper Peninsula | 344 | 2.2% | 94 | 5.2% |
| Northwest LP | 584 | 3.7% | 54 | 3.0% |
| Northeast LP | 244 | 1.5% | 45 | 2.5% |
| West/West Central | 2,390 | 15.0% | 324 | 17.8% |
| East Central | 690 | 4.3% | 101 | 5.6% |
| East | 1,048 | 6.6% | 144 | 7.9% |
| South Central | 572 | 3.6% | 42 | 2.3% |
| Southwest | 928 | 5.8% | 105 | 5.8% |
| Southeast | 1,473 | 9.3% | 123 | 6.8% |
| Detroit Metro | 4,529 | 28.5% | 467 | 25.7% |
| MI, Unknown Region | 665 | 4.2% | 66 | 3.6% |
| Outside MI | 665 | 4.2% | 66 | 3.6% |
| Unknown | 1,755 | 11.0% | 97 | 5.3% |
* Data are suppressed if count is less than 10 or sample population was less than 20.
Comparison of Survey Respondents to All Nurses Licensed in Michigan
| Characteristics | RNs | LPNs | ||||||
|---|---|---|---|---|---|---|---|---|
| Nurse Population | Survey Participants | Nurse Population | Survey Participants | |||||
| # | % | # | % | # | % | # | % | |
| Total | 155,199 | – | 15,896 | – | 22,434 | – | 1,818 | – |
| Age | ||||||||
| <25 years | 3,493 | 2.3% | 224 | 1.4% | 393 | 1.8% | 17 | 0.9% |
| 25 to 34 years | 31,067 | 20.0% | 2,548 | 16.0% | 3,859 | 17.2% | 240 | 13.2% |
| 35 to 44 years | 32,312 | 20.8% | 2,725 | 17.1% | 4,967 | 22.1% | 328 | 18.0% |
| 45 to 54 years | 32,678 | 21.1% | 2,827 | 17.8% | 4,692 | 20.9% | 344 | 18.9% |
| 55 to 64 years | 35,113 | 22.6% | 3,946 | 24.8% | 5,275 | 23.5% | 466 | 25.6% |
| 65 to 74 years | 17,952 | 11.6% | 2,221 | 14.0% | 2,870 | 12.8% | 203 | 11.2% |
| 75+ years | 2,560 | 1.6% | 269 | 1.7% | 372 | 1.7% | 20 | 1.1% |
| Unknown | 24 | 0.0% | 1,136 | 7.1% | * | * | 200 | 11.0% |
| Prosperity Region | ||||||||
| Eastern/Central/Western UP | 4,130 | 2.7% | 344 | 2.2% | 1,491 | 6.6% | 94 | 5.2% |
| Northwest LP | 4,954 | 3.2% | 584 | 3.7% | 582 | 2.6% | 54 | 3.0% |
| Northeast LP | 2,504 | 1.6% | 244 | 1.5% | 681 | 3.0% | 45 | 2.5% |
| West/West Central | 20,214 | 13.0% | 2,390 | 15.0% | 3,399 | 15.2% | 324 | 17.8% |
| East Central | 7,826 | 5.0% | 690 | 4.3% | 1,450 | 6.5% | 101 | 5.6% |
| East | 11,883 | 7.7% | 1,048 | 6.6% | 2,012 | 9.0% | 144 | 7.9% |
| South Central | 5,468 | 3.5% | 572 | 3.6% | 652 | 2.9% | 42 | 2.3% |
| Southwest | 9,737 | 6.3% | 928 | 5.8% | 1,519 | 6.8% | 105 | 5.8% |
| Southeast | 16,499 | 10.6% | 1,473 | 9.3% | 2,111 | 9.4% | 123 | 6.8% |
| Detroit Metro | 51,467 | 33.2% | 4,529 | 28.5% | 7,270 | 32.4% | 467 | 25.7% |
| MI, Unknown Region | – | – | 665 | 4.2% | – | – | 66 | 3.6% |
| Non-Michigan | 20,517 | 13.2% | 1,755 | 11.0% | 1,267 | 5.6% | 97 | 5.3% |
| Unknown Region | – | – | 674 | 4.2% | – | – | 156 | 8.6% |
| APRN | ||||||||
| Nurse Practitioner | 9,478 | 6.1% | 1,098 | 6.9% | – | – | – | – |
| Anesthetist | 2,830 | 1.8% | 210 | 1.3% | – | – | – | – |
| Midwife | 453 | 0.3% | 89 | 0.6% | – | – | – | – |
| Clinical Specialist | 222 | 0.1% | 408 | 2.6% | – | – | – | – |
* Data are suppressed if count is less than 10 or sample population was less than 20.
– Data are not available/data are not applicable.
Education
Highest Level of Nursing-Related Education
| Education Level | RN = 15,865 | LPN = 1,812 | ||
|---|---|---|---|---|
| Estimate | 95% CI | Estimate | 95% CI | |
| LPN diploma/certificate | * | * | 94.2% | (93.0%, 95.1%) |
| RN diploma in nursing | 6.7% | (6.3%, 7.0%) | * | * |
| Associate’s degree in nursing | 32.0% | (31.3%, 32.8%) | 5.0% | (4.1%, 6.1%) |
| Bachelor’s degree in nursing | 46.0% | (45.2%, 46.8%) | * | * |
| Master’s degree in nursing | 13.1% | (12.5%, 13.6%) | * | * |
| Doctorate in Nursing Practice (DNP) | 1.4% | (1.2%, 1.6%) | * | * |
| Doctor of Nurse Anesthesia (DNAP) | 0.0% | (0.0%, 0.1%) | * | * |
| Doctor of Philosophy in Nursing (PhD) | 0.8% | (0.6%, 0.9%) | * | * |
| Other doctoral degree in nursing | 0.1% | (0.0%, 0.1%) | * | * |
* Data are suppressed if count is less than 10 or sample population was less than 20.
Highest Level of Non-Nursing Education
| Education Level | RN = | 15,381 | LPN = | 1,795 |
|---|---|---|---|---|
| Estimate | 95% CI | Estimate | 95% CI | |
| Non-nursing associate’s degree | 13.4% | (12.8%, 13.9%) | 24.3% | (22.4%, 26.3%) |
| Non-nursing bachelor’s degree | 15.9% | (15.4%, 16.5%) | 6.4% | (5.4%, 7.6%) |
| Non-nursing master’s degree | 6.8% | (6.5%, 7.2%) | 2.1% | (1.5%, 2.9%) |
| Non-nursing doctoral degree | 1.0% | (0.9%, 1.2%) | 0.4% | (0.2%, 0.8%) |
| Not applicable | 62.9% | (62.1%, 63.6%) | 66.8% | (64.6%, 68.9%) |
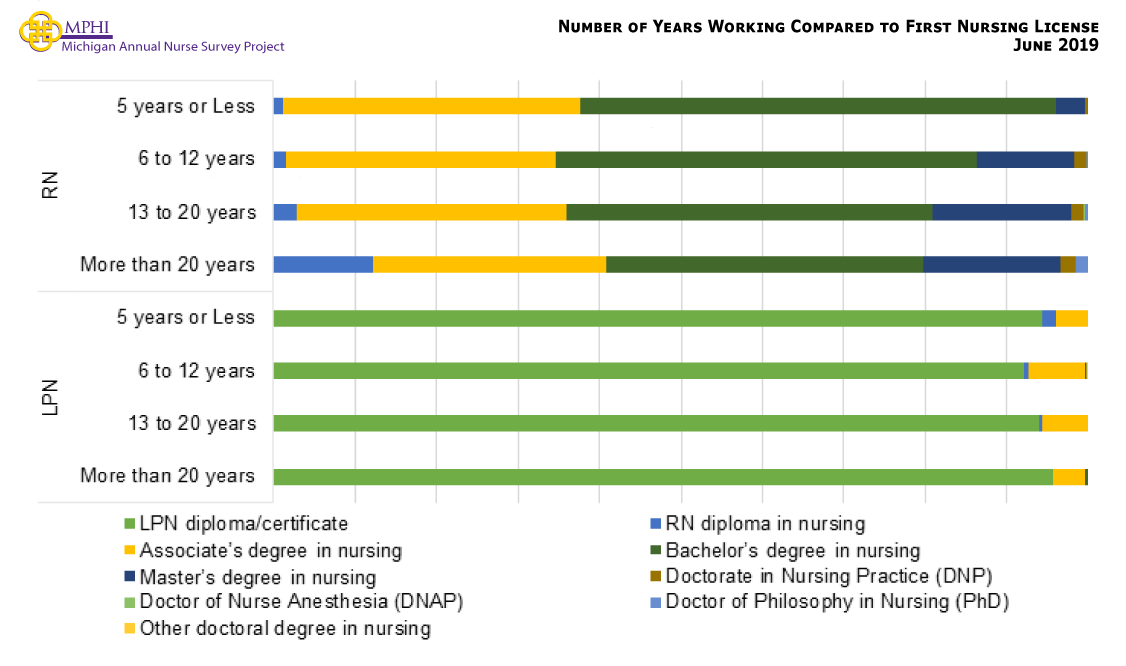
Educational Background that Qualified for First Nursing License
| Education Level | RN = 15,865 | LPN = 1,812 | ||
|---|---|---|---|---|
| Estimate | 95% CI | Estimate | 95% CI | |
| LPN diploma/certificate | 0.0% | (0.0%, 0.0%) | 94.2% | (93.0%, 95.1%) |
| RN diploma in nursing | 6.7% | (6.3%, 7.0%) | * | * |
| Associate’s degree in nursing | 32.0% | (31.3%, 32.8%) | 5.0% | (4.1%, 6.1%) |
| Bachelor’s degree in nursing | 46.0% | (45.2%, 46.8%) | * | * |
| Master’s degree in nursing | 13.1% | (12.5%, 13.6%) | * | * |
| Doctorate in Nursing Practice (DNP) | 1.4% | (1.2%, 1.6%) | * | * |
| Doctorate of Nurse Anesthesia (DNAP) | 0.0% | (0.0%, 0.1%) | * | * |
| Doctor of Philosophy in Nursing (PhD) | 0.8% | (0.6%, 0.9%) | * | * |
| Other doctorate degree in nursing | 0.1% | (0.0%, 0.1%) | * | * |
* Data are suppressed if count is less than 10 or sample population was less than 20.
Number of Years Working Compared to First Nursing License
Current Specialty Certifications in Michigan
| Certification | n = 15,896 | |
|---|---|---|
| Estimate | 95% CI | |
| Nurse Anesthetist | 1.0% | (0.9%, 1.2%) |
| Nurse Midwife | 0.4% | (0.3%, 0.5%) |
| Nurse Practitioner | 5.2% | (4.9%, 5.6%) |
| Clinical Nurse Specialist | 1.9% | (1.7%, 2.2%) |
Current Enrollment in Nursing Educational Programs
| Degree | RN = 15,896 | LPN = 1,818 | ||
|---|---|---|---|---|
| Estimate | 95% CI | Estimate | 95% CI | |
| Associate’s Degree in Nursing (ADN) | 0.1% | (0.0%, 0.1%) | 12.3% | (10.9%, 13.9%) |
| Bachelor of Science in Nursing (BSN) | 5.4% | (5.0%, 5.7%) | 2.0% | (1.4%, 2.7%) |
| Master of Science in Nursing (MSN) | 3.8% | (3.5%, 4.1%) | * | * |
| Doctor of Nursing Practice (DNP) | 1.5% | (1.3%, 1.7%) | * | * |
| Doctor of Philosophy in Nursing (PhD) | 0.2% | (0.1%, 0.2%) | * | * |
| Not Enrolled | 0.2% | (0.2%, 0.3%) | 0.1% | (0.0%, 0.3%) |
* Data are suppressed if count is less than 10 or sample population was less than 20.
Educational Preparation to Earn Specialty Certification
| Certification | RN = 631 | |
|---|---|---|
| Estimate | 95% CI | |
| Nurse Practitioner | 79.7% | (76.4%, 82.7%) |
| Nurse Midwife | 3.7% | (2.5%, 5.4%) |
| Nurse Anesthetist | 6.9% | (5.2%, 9.1%) |
| Clinical Nurse Specialist | 9.7% | (7.6%, 12.2%) |
Employment
Current Employment Status
| Employment | RN = 15,896 | LPN = 1,818 | ||
|---|---|---|---|---|
| Estimate | 95% CI | Estimate | 95% CI | |
| Actively employed in nursing or a position that requires a nurse license full-time | 64.1% | (63.4%, 64.9%) | 62.6% | (60.4%, 64.8%) |
| Actively employed in nursing or a position that requires a nurse license part-time | 12.1% | (11.6%, 12.6%) | 11.9% | (10.5%, 13.5%) |
| Actively employed in nursing or a position that requires a nurse license on a per-diem basis | 5.0% | (4.7%, 5.3%) | 3.5% | (2.7%, 4.4%) |
| On temporary medical leave from a position that requires a nurse license | 0.8% | (0.7%, 1.0%) | * | * |
| On temporary non-medical leave from a position that requires a nurse license | 0.3% | (0.2%, 0.3%) | * | * |
| Actively employed in a field other than nursing | 2.7% | (2.4%, 2.9%) | 4.7% | (3.8%, 5.8%) |
| Working in nursing only as a volunteer | 0.9% | (0.8%, 1.1%) | * | * |
| Unemployed, seeking work as a nurse | 1.8% | (1.6%, 2.0%) | 3.7% | (2.9%, 4.6%) |
| Unemployed, not seeking work as a nurse | 2.7% | (2.5%, 3.0%) | 3.0% | (2.3%, 3.8%) |
| Retired | 9.6% | (9.1%, 10.0%) | 8.3% | (7.1%, 9.7%) |
* Data are suppressed if count is less than 10 or sample population was less than 20.
Percentage of Nurses Who are Employed by Demographic Characteristics
| Demographics | RN | LPN | ||||
|---|---|---|---|---|---|---|
| n | Estimate | 95% CI | n | Estimate | 95% CI | |
| Total | 15,896 | 81.3% | (80.7%, 81.9%) | 1,818 | 78.0% | (76.1%, 79.9%) |
| Age | ||||||
| <25 years | 224 | 96.4% | (94.0%, 98.8%) | 17 | 82.4% | (64.3%, 100.5%) |
| 25 to 34 years | 2,548 | 92.9% | (91.9%, 93.9%) | 240 | 89.6% | (85.7%, 93.4%) |
| 35 to 44 years | 2,725 | 91.6% | (90.6%, 92.7%) | 328 | 87.8% | (84.3%, 91.3%) |
| 45 to 54 years | 2,827 | 90.3% | (89.3%, 91.4%) | 344 | 85.5% | (81.7%, 89.2%) |
| 55 to 64 years | 3,946 | 76.8% | (75.4%, 78.1%) | 466 | 72.1% | (68.0%, 76.2%) |
| 65+ years | 2,490 | 38.0% | (36.1%, 39.9%) | 223 | 47.6% | (41.0%, 54.1%) |
| Gender | ||||||
| Female | 13,791 | 80.7% | (80.0%, 81.4%) | 1,548 | 77.9% | (75.9%, 80.0%) |
| Male | 1,306 | 87.2% | (85.3%, 89.0%) | 105 | 79.8% | (72.2%, 87.5%) |
| Race | ||||||
| White | 13,593 | 80.7% | (80.1%, 81.4%) | 1,259 | 75.7% | (73.3%, 78.1%) |
| Black or African American | 780 | 85.9% | (83.4%, 88.3%) | 323 | 88.2% | (84.6%, 91.7%) |
| Other | 895 | 86.0% | (83.8%, 88.3%) | 106 | 79.5% | (71.8%, 87.2%) |
| Ethnicity | ||||||
| Hispanic or Latino | 299 | 88.2% | (84.6%, 91.9%) | 41 | 82.8% | (71.3%, 94.4%) |
| Not Hispanic or Latino | 14,610 | 81.1% | (80.5%, 81.7%) | 1,583 | 78.1% | (76.0%, 80.1%) |
| Residency | ||||||
| Upper Peninsula | 344 | 79.5% | (75.3%, 83.8%) | 94 | 80.1% | (72.1%, 88.2%) |
| Northwest LP | 584 | 75.8% | (72.3%, 79.3%) | 54 | 69.7% | (57.4%, 81.9%) |
| Northeast LP | 244 | 76.5% | (71.2%, 81.8%) | 45 | 70.5% | (57.2%, 83.9%) |
| West/West Central | 2,390 | 84.0% | (82.5%, 85.5%) | 324 | 76.9% | (72.3%, 81.5%) |
| East Central | 690 | 82.6% | (79.8%, 85.4%) | 101 | 73.5% | (64.9%, 82.1%) |
| East | 1,048 | 82.7% | (80.4%, 85.0%) | 144 | 76.4% | (69.5%, 83.4%) |
| South Central | 572 | 82.1% | (79.0%, 85.2%) | 42 | 72.7% | (59.2%, 86.2%) |
| Southwest | 928 | 80.4% | (77.8%, 82.9%) | 105 | 79.6% | (71.9%, 87.3%) |
| Southeast | 1,473 | 79.8% | (77.8%, 81.9%) | 123 | 83.4% | (76.8%, 90.0%) |
| Detroit Metro | 4,529 | 82.2% | (81.1%, 83.3%) | 467 | 80.7% | (77.1%, 84.3%) |
| Michigan Resident* | 13,467 | 79.3% | (78.6%, 80.0%) | 1,565 | 78.2% | (76.2%, 80.3%) |
| Non-Michigan Resident | 1,755 | 75.6% | (73.6%, 77.6%) | 97 | 65.0% | (55.5%, 74.5%) |
*Includes individuals who indicated they live in Michigan but did not provide a zip code.
Demographic Characteristics of Employed Nurses
| Demographics | RN = 11,936 | LPN = 1,283 | ||
|---|---|---|---|---|
| Estimate | 95% CI | Estimate | 95% CI | |
| Age | ||||
| <25 years | 2.7% | (2.4%, 3.0%) | 1.8% | (1.2%, 2.7%) |
| 25 to 34 years | 22.9% | (22.1%, 23.6%) | 19.8% | (17.7%, 22.0%) |
| 35 to 44 years | 23.5% | (22.7%, 24.3%) | 24.9% | (22.6%, 27.4%) |
| 45 to 54 years | 23.4% | (22.7%, 24.2%) | 22.9% | (20.7%, 25.3%) |
| 55 to 64 years | 21.4% | (20.6%, 22.1%) | 21.7% | (19.6%, 24.1%) |
| 65+ years | 6.2% | (5.8%, 6.6%) | 8.8% | (7.4%, 10.5%) |
| Gender | ||||
| Female | 90.6% | (90.1%, 91.1%) | 93.5% | (92.1%, 94.8%) |
| Male | 9.4% | (8.9%, 9.9%) | 6.5% | (5.2%, 7.9%) |
| Race | ||||
| White | 90.2% | (89.6%, 90.7%) | 73.9% | (71.5%, 76.3%) |
| Black | 5.5% | (5.1%, 5.9%) | 22.7% | (20.5%, 25.1%) |
| Other | 6.4% | (6.0%, 6.9%) | 6.4% | (5.2%, 7.8%) |
| Hispanic or Latino | 2.3% | (2.0%, 2.6%) | 2.7% | (1.9%, 3.7%) |
| Not Hispanic or Latino | 97.7% | (97.4%, 98.0%) | 97.3% | (96.3%, 98.1%) |
Prosperity Region of Residency & Employment among Michigan Nurses
| Prosperity Region | RNs | LPNs | ||||||
|---|---|---|---|---|---|---|---|---|
| Place of Residency | Place of Employment | Place of Residency | Place of Employment | |||||
| Estimate | 95% CI | Estimate | 95% CI | Estimate | 95% CI | Estimate | 95% CI | |
| Upper Peninsula | 2.6% | (2.3%, 2.9%) | 2.7% | (2.4%, 3.0%) | 7.2% | (5.9%, 8.8%) | 7.0% | (5.7%, 8.5%) |
| Northwest LP | 3.0% | (2.7%, 3.3%) | 2.9% | (2.6%, 3.3%) | 2.4% | (1.7%, 3.4%) | 2.8% | (2.0%, 3.8%) |
| Northeast LP | 1.5% | (1.3%, 1.8%) | 1.4% | (1.2%, 1.6%) | 2.9% | (2.1%, 4.0%) | 2.4% | (1.7%, 3.4%) |
| West/West Central | 13.4% | (12.8%, 14.1%) | 13.5% | (12.8%, 14.1%) | 15.7% | (13.7%, 17.8%) | 14.9% | (13.0%, 17.0%) |
| East Central | 5.1% | (4.7%, 5.5%) | 5.3% | (4.9%, 5.8%) | 6.4% | (5.2%, 7.9%) | 5.6% | (4.5%, 7.0%) |
| East | 7.8% | (7.3%, 8.3%) | 6.3% | (5.9%, 6.8%) | 9.2% | (7.7%, 11.0%) | 8.1% | (6.8%, 9.8%) |
| South Central | 3.5% | (3.2%, 3.9%) | 3.8% | (3.4%, 4.1%) | 2.9% | (2.1%, 4.0%) | 3.1% | (2.3%, 4.2%) |
| Southwest | 6.2% | (5.8%, 6.6%) | 6.2% | (5.8%, 6.7%) | 7.1% | (5.8%, 8.7%) | 7.3% | (6.0%, 8.9%) |
| Southeast | 10.4% | (9.9%, 11.0%) | 12.2% | (11.6%, 12.8%) | 10.7% | (9.1%, 12.5%) | 10.6% | (9.0%, 12.4%) |
| Detroit Metro | 33.4% | (32.6%, 34.3%) | 33.4% | (32.5%, 34.3%) | 35.6% | (32.9%, 38.3%) | 37.0% | (34.4%, 39.7%) |
| Outside MI | 13.0% | (12.4%, 13.6%) | 12.4% | (11.8%, 13.0%) | 0.0% | (0.0%, 0.3%) | 1.2% | (0.7%, 1.9%) |
Reasons for Not Working as a Nurse Full-Time
| Reason | RN = 2,644 | LPN = 269 | ||
|---|---|---|---|---|
| Estimate | 95% CI | Estimate | 95% CI | |
| Taking care of home and family | 53.9% | (52.0%, 55.7%) | 36.2% | (30.7%, 42.1%) |
| Enrolled in education program | 11.8% | (10.6%, 13.1%) | 22.8% | (18.2%, 28.1%) |
| Difficulty finding a full-time nursing position | 3.8% | (3.1%, 4.6%) | * | * |
| Prefer to work part-time or per diem basis | 1.1% | (0.8%, 1.6%) | * | * |
| Semi-retired | 22.2% | (20.7%, 23.8%) | 30.6% | (25.4%, 36.4%) |
| Burned Out/Too Stressful | 17.7% | (16.3%, 19.2%) | 22.2% | (17.6%, 27.5%) |
| Disabled | 0.4% | (0.2%, 0.7%) | 1.8% | (0.7%, 4.1%) |
| Inadequate Salary | 4.8% | (4.0%, 5.6%) | 7.2% | (4.7%, 11.0%) |
| Other | 9.8% | (8.8%, 11.0%) | 8.6% | (5.8%, 12.6%) |
* Data are suppressed if count is less than 10 or sample population was less than 20.
Unemployed and Seeking Work as a Nurse
| Unemployed and seeking work as a nurse | RN = 287 | LPN = 59 | ||
|---|---|---|---|---|
| Estimate | 95% CI | Estimate | 95% CI | |
| Taking care of home and family | 35.4% | (30.1%, 41.1%) | 39.1% | (27.7%, 51.9%) |
| Difficulty finding a full-time nursing position | 21.5% | (17.1%, 26.6%) | 11.7% | (5.8%, 22.4%) |
| Difficulty finding a part-time or on a per-diem basis nursing position | 24.8% | (20.1%, 30.1%) | 14.9% | (8.0%, 26.1%) |
| Semi-retired | 13.6% | (10.1%, 18.0%) | 3.1% | (0.8%, 11.1%) |
| Burned out/too stressful | 10.2% | (7.2%, 14.2%) | 5.5% | (2.0%, 14.5%) |
| Disabled | 4.1% | (2.4%, 7.1%) | 9.2% | (4.1%, 19.2%) |
| Inadequate salary | 5.5% | (3.4%, 8.8%) | 14.4% | (7.6%, 25.5%) |
| Other | 21.3% | (17.0%, 26.4%) | 23.5% | (14.5%, 35.8%) |
Unemployed and Not Seeking Work as a Nurse
| Unemployed and NOT seeking work as a nurse | RN = 408 | LPN = 52 | ||
|---|---|---|---|---|
| Estimate | 95% CI | Estimate | 95% CI | |
| Taking care of home and family | 61.0% | (55.3%, 66.5%) | 50.2% | (37.8%, 62.5%) |
| Enrolled in education program | 8.0% | (5.4%, 11.7%) | 0.0% | (0.0%, 6.1%) |
| Difficulty finding a full-time nursing position | 0.5% | (0.1%, 2.2%) | 0.0% | (0.0%, 6.1%) |
| Difficulty finding a part-time or on a per-diem basis nursing position | 4.6% | (2.7%, 7.7%) | 4.7% | (1.5%, 13.4%) |
| Semi-retired | 14.8% | (11.2%, 19.4%) | 9.4% | (4.2%, 19.5%) |
| Burned out/too stressful | 19.2% | (15.1%, 24.2%) | 16.0% | (8.8%, 27.4%) |
| Disabled | 12.4% | (9.0%, 16.7%) | 31.5% | (21.1%, 44.1%) |
| Inadequate salary | 6.4% | (4.1%, 9.8%) | 4.1% | (1.2%, 12.5%) |
| Other | 6.0% | (3.8%, 9.4%) | 8.6% | (3.8%, 18.5%) |
Nurses Licensed Out of State or Country
| Location | RN = 15,896 | LPN = 1,818 | ||
|---|---|---|---|---|
| Estimate | 95% CI | Estimate | 95% CI | |
| Michigan Only | 79.7% | (79.1%, 80.4%) | 85.6% | (84.0%, 87.2%) |
| Other U.S. State** | 18.7% | (18.1%, 19.3%) | 14.0% | (12.5%, 15.6%) |
| Ohio | 22.9% | (21.4%, 24.4%) | 29.1% | (27.1%, 31.3%) |
| Indiana | 18.3% | (16.9%, 19.7%) | 13.0% | (11.5%, 14.6%) |
| Illinois | 16.5% | (15.2%, 17.9%) | 4.7% | (3.8%, 5.8%) |
| Wisconsin | 11.8% | (10.7%, 13.0%) | 10.2% | (8.9%, 11.7%) |
| Florida | 20.3% | (18.9%, 21.8%) | 14.1% | (12.6%, 15.8%) |
| Other Country** | 2.3% | (2.0%, 2.5%) | * | * |
| Canada | 53.0% | (47.9%, 58.1%) | * | * |
| Other State & Country | 0.7% | (0.6%, 0.8%) | * | * |
* Data are suppressed if count is less than 10 or sample population was less than 20.
**Percentages include nurses who also reported being licensed in the Other U.S. States and Other Countries category.
Current Employment Status

Number of Currently Employed Nursing Positions
| Number of Positions | RN = 12,599 | LPN = 1,413 | ||
|---|---|---|---|---|
| Estimate | 95% CI | Estimate | 95% CI | |
| 1 Position | 86.2% | (85.5%, 86.7%) | 82.8% | (80.8%, 84.7%) |
| 2 Position | 11.9% | (11.4%, 12.5%) | 14.7% | (13.0%, 16.7%) |
| 3+ Positions | 1.9% | (1.7%, 2.2%) | 2.5% | (1.8%, 3.4%) |
Number of Years Been a Licensed Nurse (RN and LPN)
| Years | RN = 15,290 | LPN = 1,667 | ||
|---|---|---|---|---|
| Estimate | 95% CI | Estimate | 95% CI | |
| 5 years or Less | 18.9% | (18.3%, 19.5%) | 26.8% | (24.6%, 28.9%) |
| 6 to 12 years | 20.3% | (19.6%, 20.9%) | 24.1% | (22.1%, 26.2%) |
| 13 to 20 years | 12.8% | (12.2%, 13.3%) | 11.8% | (10.3%, 13.4%) |
| More than 20 years | 48.1% | (47.3%, 48.9%) | 37.3% | (35.0%, 39.6%) |
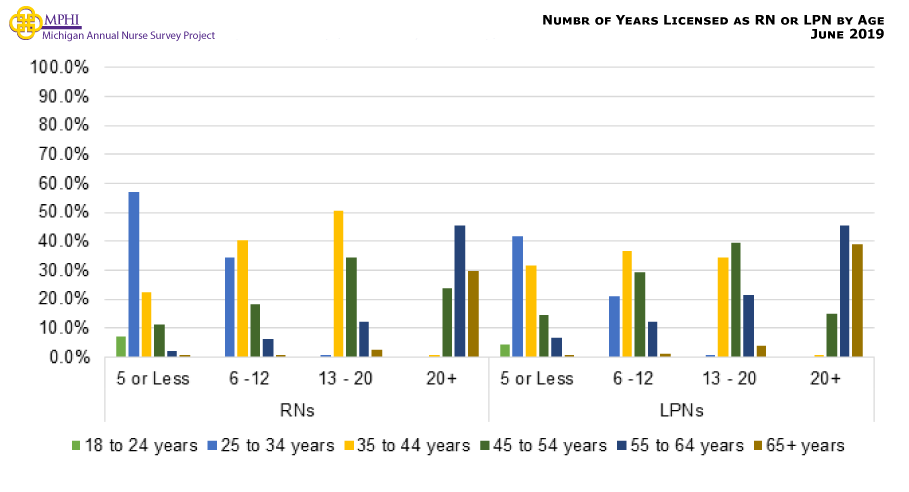
Number of Years been a Licensed Nurse Compared to Age (RN and LPN)
Number of Years Been a Licensed Nurse (APRN)
| Years | APRN = 1,703 | |
|---|---|---|
| Estimate | 95% CI | |
| 5 years or less | 8.7% | (7.4%, 10.0%) |
| 6 to 12 years | 24.1% | (22.0%, 26.1%) |
| 13 to 20 years | 16.3% | (14.6%, 18.1%) |
| More than 20 years | 50.9% | (48.5%, 53.3%) |
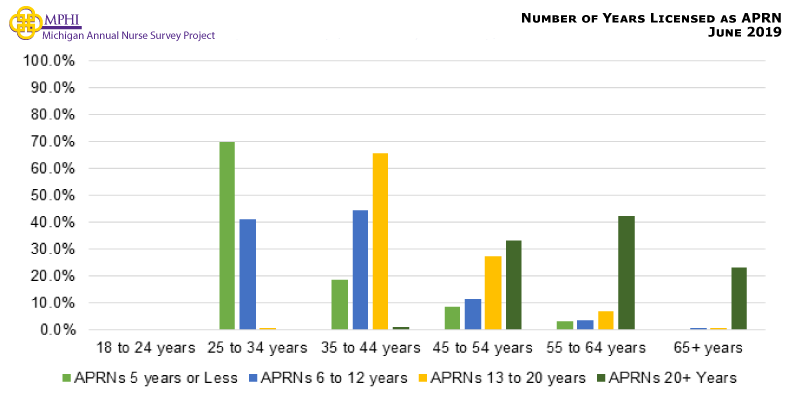
Number of Years been a Licensed Nurse Compared to Age (APRN)
Number of Years Working as a Nurse (RN and LPN)
| Years | RN = 12,224 | LPN = 1,317 | ||
|---|---|---|---|---|
| Estimate | 95% CI | Estimate | 95% CI | |
| Less than 3 years | 11.1% | (10.5%, 11.7%) | 15.8% | (13.8%, 17.7%) |
| 3 to less than 10 years | 30.0% | (29.2%, 30.8%) | 34.7% | (32.1%, 37.2%) |
| 10 to less than 20 years | 21.8% | (21.1%, 22.5%) | 20.2% | (18.0%, 22.4%) |
| 20 or more years | 37.1% | (36.2%, 37.9%) | 29.4% | (26.9%, 31.8%) |
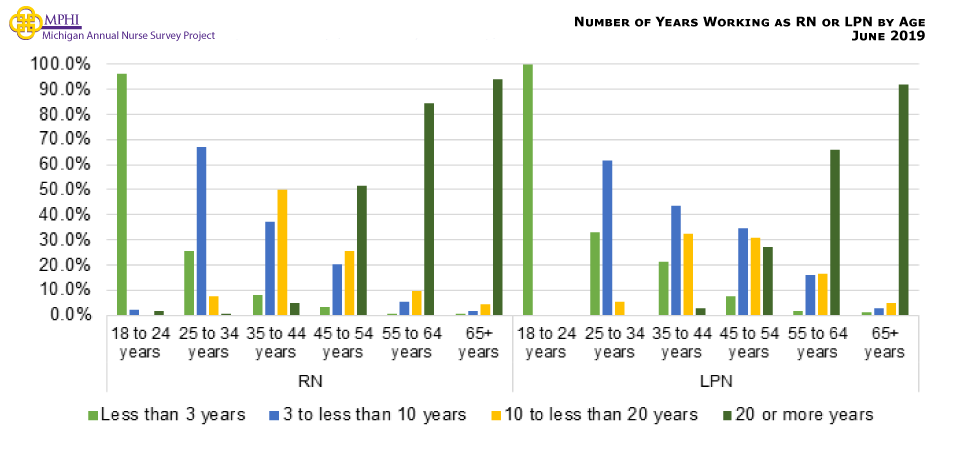
Number of Years Working as a Nurse Compared to Age (RN and LPN)
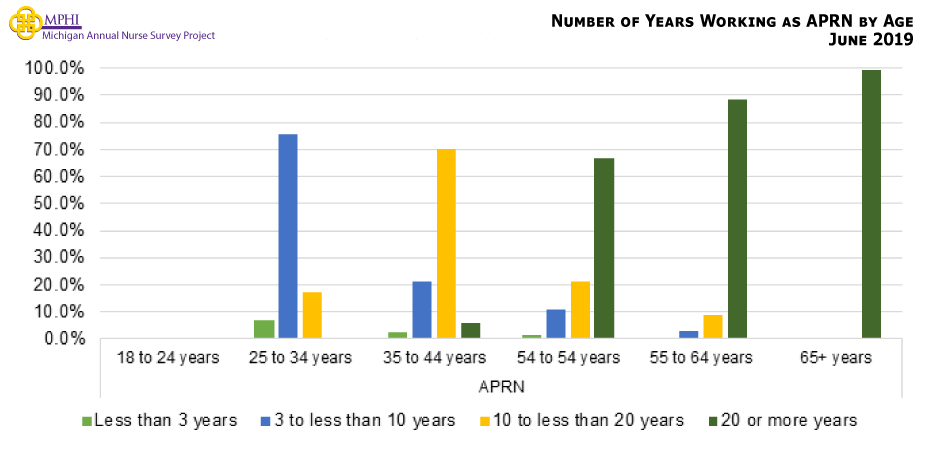
Number of Years Working as a Nurse (APRN)
| Years | APRN = 1,479 | |
|---|---|---|
| Estimate | 95% CI | |
| Less than 3 years | 2.5% | (01.7%, 03.3%) |
| 3 to less than 10 years | 24.5% | (22.3%, 26.7%) |
| 10 to less than 20 years | 31.4% | (29.0%, 33.7%) |
| 20 or more years | 41.7% | (39.1%, 44.2%) |
Number of Years Working as a Nurse Compared to Age (APRN)
Number of Years Worked as a Nurse for Retired Nurses
| Years | RN = 1,773 | LPN = 143 | ||
|---|---|---|---|---|
| Estimate | 95% CI | Estimate | 95% CI | |
| Less than 3 years | 0.4% | (0.2%, 0.8%) | 2.4% | (0.9%, 6.4%) |
| 4 to 9 years | 2.5% | (1.9%, 3.4%) | 4.4% | (2.1%, 9.1%) |
| 10 years or more | 97.1% | (96.2%, 97.7%) | 93.2% | (87.8%, 96.3%) |
New Nurse Experience
Preparedness for Entering Nursing Workforce
| Level of Preparedness | RN = 1,158 | LPN = 190 | ||
|---|---|---|---|---|
| Estimate | 95% CI | Estimate | 95% CI | |
| Adequately prepared | 51.6% | (48.7%, 54.4%) | 64.7% | (57.7%, 71.2%) |
| Not enough classroom time | 2.5% | (1.7%, 3.5%) | * | * |
| Not enough clinical time | 32.9% | (30.3%, 35.7%) | 18.3% | * |
| Not enough skills lab/simulation time | 17.9% | (15.8%, 20.2%) | 18.0% | (13.2%, 24.0%) |
| Not enough critical thinking/ prioritization practice | 25.5% | (23.1%, 28.1%) | 11.0% | (7.3%, 16.2%) |
| Other | 3.7% | (2.8%, 5.0%) | * | * |
* Data are suppressed if count is less than 10 or sample population was less than 20.
Adequately Preparedness for Entering Nursing Workforce by Prosperity Region
| Prosperity Region | RNs | LPNs | ||||
|---|---|---|---|---|---|---|
| N | % | 95% CI | N | % | 95% CI | |
| Upper Peninsula | 28 | 43.6% | (27.1%, 61.6%) | 11 | 73.4% | (44.0%, 90.6%) |
| Northwest LP | 35 | 51.4% | (35.5%, 66.9%) | * | * | * |
| Northeast LP | 12 | 50.7% | (25.9%, 75.2%) | * | * | * |
| West/West Central | 195 | 49.2% | (42.3%, 56.2%) | 21 | 57.0% | (36.4%, 75.4%) |
| East Central | 60 | 60.7% | (48.0%, 72.0%) | * | * | * |
| East | 75 | 51.4% | (40.3%, 62.3%) | * | * | * |
| South Central | 41 | 31.9% | (19.7%, 47.2%) | * | * | * |
| Southwest | 51 | 53.8% | (40.3%, 66.7%) | * | * | * |
| Southeast | 113 | 45.8% | (36.9%, 54.9%) | 17 | 82.4% | (59.0%, 93.8%) |
| Detroit Metro | 390 | 52.6% | (47.7%, 57.5%) | 91 | 67.4% | (57.2%, 76.1%) |
| Lives in Michigan | 1,080 | 50.9% | (47.9%, 53.9%) | 179 | 66.4% | (59.2%, 72.9%) |
| Lives Outside of Michigan | 62 | 63.8% | (51.4%, 74.7%) | * | * | * |
* Data are suppressed if count is less than 10 or sample population was less than 20.
Plans to Continue Working
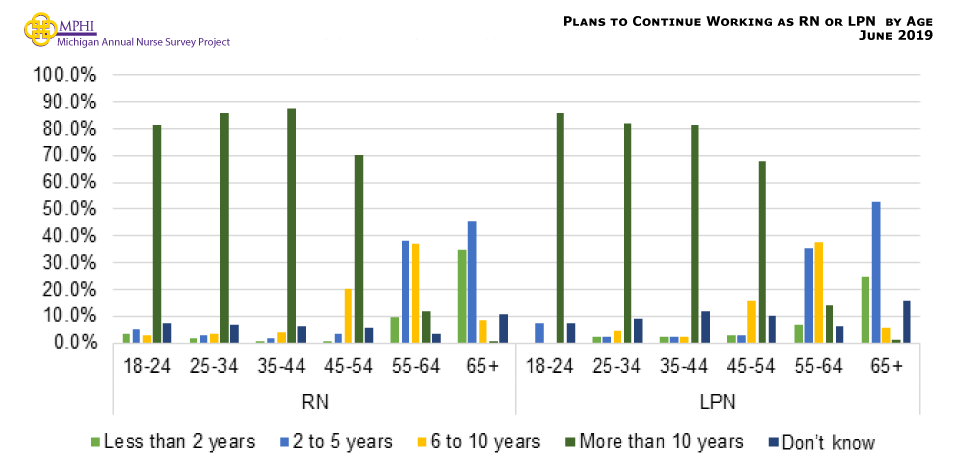
Plans to Continue Working as a Nurse (RN and LPN)
| Years | RN = 12,213 | LPN = 1,314 | ||
|---|---|---|---|---|
| Estimate | 95% CI | Estimate | 95% CI | |
| Less than 2 years | 4.9% | (4.5%, 5.3%) | 5.4% | (4.2%, 6.6%) |
| 2 to 5 years | 13.0% | (12.4%, 13.6%) | 14.2% | (12.3%, 16.1%) |
| 6 to 10 years | 14.9% | (14.3%, 15.5%) | 13.9% | (12.0%, 15.8%) |
| More than 10 years | 61.2% | (60.4%, 62.1%) | 56.7% | (54.0%, 59.4%) |
| Don’t know | 5.9% | (5.5%, 6.3%) | 9.9% | (8.2%, 11.5%) |
Plans to Continue to Practice Nursing (in years) by Age (RN and LPN)
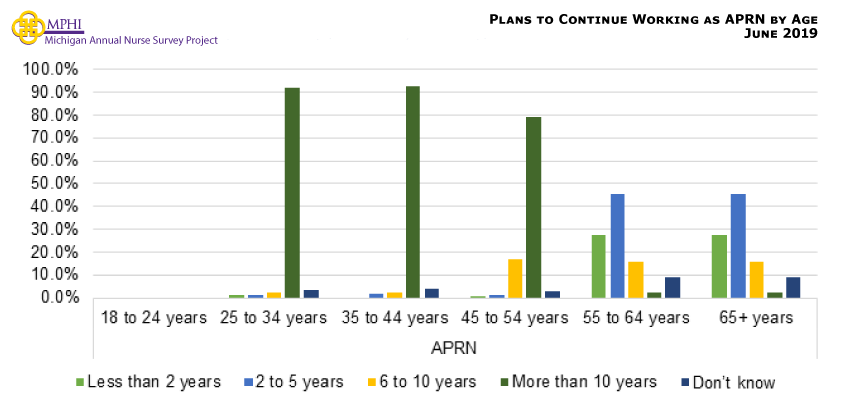
Plans to Continue Working as a Nurse (APRN)
| Years | APRN = 1,478 | |
|---|---|---|
| Estimate | 95% CI | |
| Less than 2 years | 3.9% | (3.5%, 4.2%) |
| 2 to 5 years | 10.0% | (9.5%, 10.5%) |
| 6 to 10 years | 14.3% | (13.6%, 14.9%) |
| More than 10 years | 68.2% | (67.4%, 69.0%) |
| Don’t know | 3.6% | (3.3%, 4.0%) |
Plans to Continue to Practice Nursing (in years) by Age (APRN)
Plans to Work 5 Years or Less by Prosperity Region
| Prosperity Region | RNs | LPNs | ||||
|---|---|---|---|---|---|---|
| N | % | 95% CI | N | % | 95% CI | |
| Upper Peninsula | 250 | 25.0% | (20.0%, 30.7%) | 72 | 21.6% | (13.7%, 32.5%) |
| Northwest LP | 402 | 23.3% | (19.4%, 27.7%) | 37 | 39.9% | (25.8%, 55.9%) |
| Northeast LP | 167 | 17.6% | (12.5%, 24.0%) | 29 | 18.8% | (8.6%, 36.3%) |
| West/West Central | 1,866 | 17.7% | (16.1%, 19.5%) | 237 | 24.7% | (19.6%, 30.5%) |
| East Central | 522 | 15.1% | (12.2%, 18.4%) | 66 | 23.3% | (14.8%, 34.8%) |
| East | 808 | 17.7% | (15.2%, 20.5%) | 103 | 20.0% | (13.4%, 28.8%) |
| South Central | 437 | 19.9% | (16.4%, 23.9%) | 27 | 28.1% | (14.8%, 47.0%) |
| Southwest | 678 | 20.3% | (17.4%, 23.5%) | 76 | 16.9% | (10.1%, 26.8%) |
| Southeast | 1,082 | 20.1% | (17.8%, 22.6%) | 94 | 22.7% | (15.4%, 32.2%) |
| Detroit Metro | 3,363 | 18.6% | (17.4%, 20.0%) | 318 | 18.7% | (14.8%, 23.3%) |
| Lives in Michigan | 10,065 | 19.0% | (18.3%, 19.8%) | 1,101 | 21.6% | (19.3%, 24.1%) |
| Lives Outside of Michigan | 1,250 | 19.5% | (17.4%, 21.8%) | 57 | 22.0% | (13.2%, 34.4%) |
Direct Care
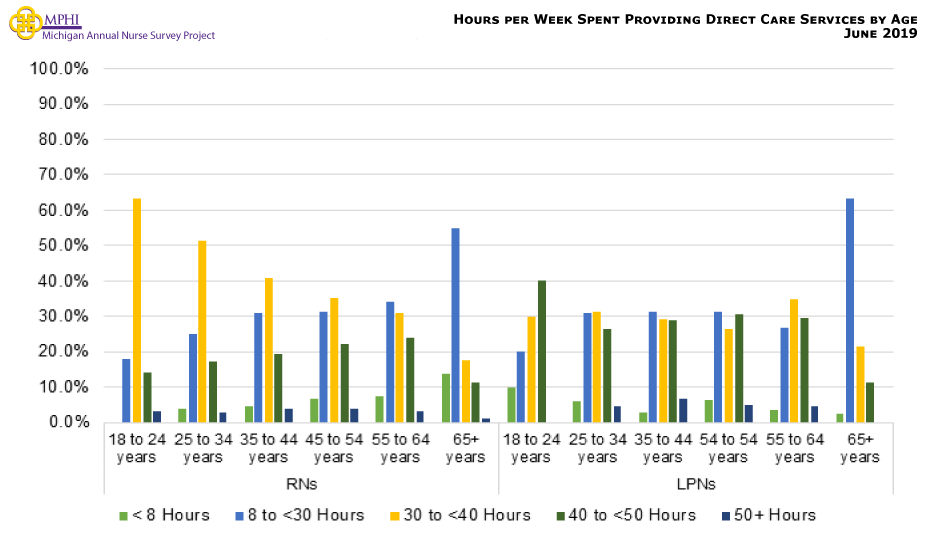
Hours per Week Spent Providing Direct Care Services
| Hours | RN = 8,729 | LPN = 1,059 | ||
|---|---|---|---|---|
| Estimate | 95% CI | Estimate | 95% CI | |
| <8 Hours | 5.6% | (5.2%, 6.1%) | 4.6% | (3.4%, 5.9%) |
| 8 to <30 Hours | 30.6% | (29.6%, 31.6%) | 32.7% | (29.9%, 35.6%) |
| 30 to <40 Hours | 40.3% | (39.3%, 41.3%) | 29.5% | (26.8%, 32.3%) |
| 40 to <50 Hours | 19.7% | (18.9%, 20.5%) | 27.7% | (25.0%, 30.4%) |
| 50+ Hours | 3.3% | (2.9%, 3.7%) | 4.7% | (3.5%, 6.0%) |
Hours per Week Spent Providing Direct Care Services by Age
Plans to Stop Working in the Next Five Years by Nurses who Provide Direct Care
| Provides Direct Care for 8+ Hours/Week | RN = 8,147 | LPN = 778 | ||||
|---|---|---|---|---|---|---|
| n | Estimate | 95% CI | n | Estimate | 95% CI | |
| Yes | 5,039 | 12.4% | (11.7%, 13.2%) | 577 | 16.8% | (14.1%, 19.4%) |
| No | 3,108 | 27.0% | (26.0%, 27.9%) | 201 | 29.9% | (26.7%, 33.1%) |
Inpatient & Outpatient Practice Settings Providing Direct Care Services

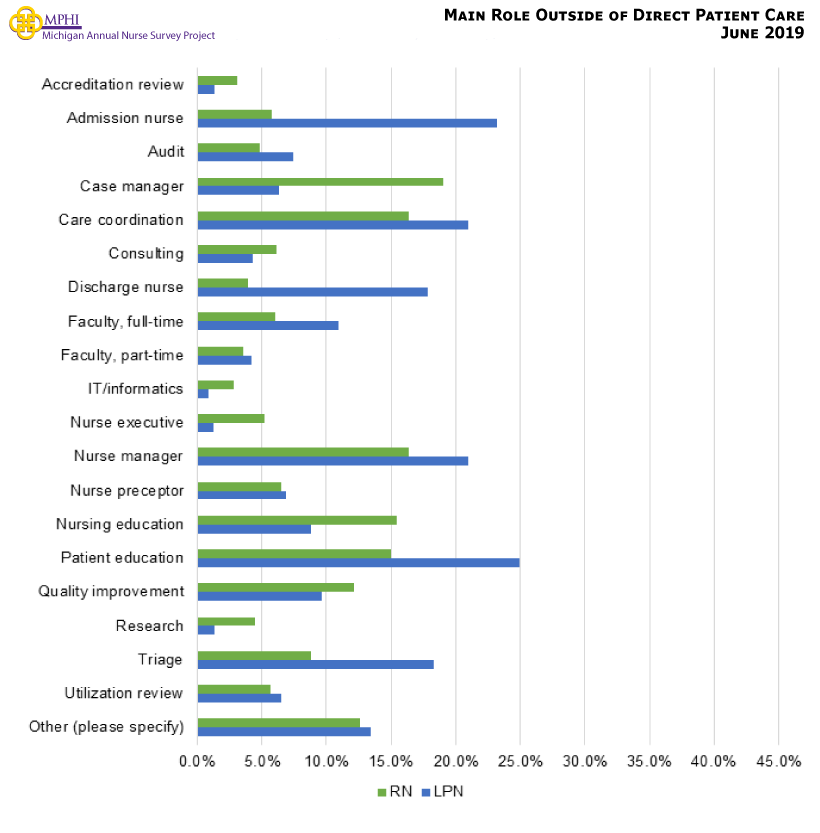
Main Role Outside of Direct Patient Care
Practice Setting
Workplace Setting (Inpatient, Outpatient, and Education)
| Workplace Setting | RN = 12,635 | LPN = 1,420 | ||
|---|---|---|---|---|
| Estimate | 95% CI | Estimate | 95% CI | |
| Inpatient | 58.0% | (57.1%, 58.8%) | 54.7% | (52.1%, 57.3%) |
| Outpatient | 28.6% | (27.9%, 29.4%) | 30.9% | (28.5%, 33.3%) |
| Education | 6.6% | (6.2%, 7.1%) | 3.4% | (2.4%, 4.3%) |
| Other** | 10.9% | (10.4%, 11.5%) | 14.7% | (12.8%, 16.5%) |
*Nurses may work in both inpatient and outpatient settings.
**Other was not a response option and was created from nurses who answered no to each of the above employment settings.
Inpatient Settings
| Inpatient Settings | RN = 7,101 | LPN = 771 | ||
|---|---|---|---|---|
| Estimate | 95% CI | Estimate | 95% CI | |
| Assisted living facility | 1.1% | (0.8%, 1.3%) | 16.2% | (13.7%, 18.9%) |
| Behavioral health facility/psychiatric | 3.8% | (3.4%, 4.3%) | 7.8% | (6.1%, 9.9%) |
| Correctional system | 0.5% | (0.4%, 0.7%) | 2.8% | (1.9%, 4.2%) |
| Hospital (acute care & acute rehabilitation) | 84.5% | (83.6%, 85.3%) | 10.7% | (8.7%, 13.1%) |
| Non-acute hospital | 1.5% | (1.3%, 1.9%) | 3.6% | (2.5%, 5.2%) |
| Nursing home/long-term care facility | 7.5% | (6.9%, 8.2%) | 71.3% | (68.0%, 74.4%) |
| Traveling/staffing agency | 2.0% | (1.7%, 2.3%) | 3.7% | (2.6%, 5.2%) |
| Other | 4.2% | (3.7%, 4.7%) | 8.2% | (6.4%, 10.3%) |
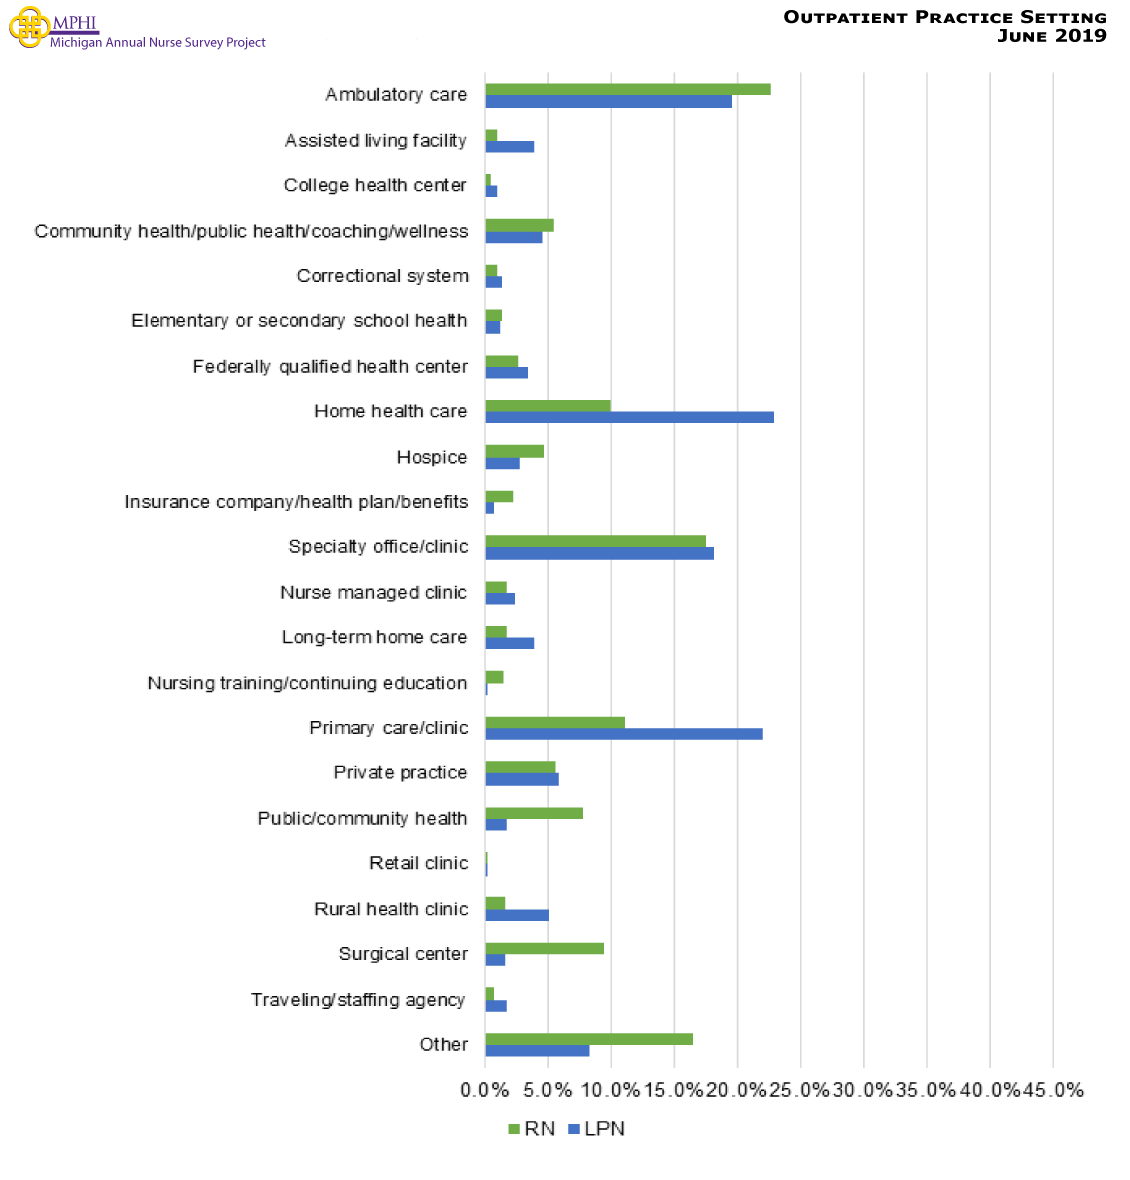
Outpatient Practice Setting
Academia Settings
| Academia Settings | RN = 904 | LPN = 48 | ||
|---|---|---|---|---|
| Estimate | 95% CI | Estimate | 95% CI | |
| ADN Educator | 15.6% | (13.4%, 18.1%) | 0.0% | (0.0%, 7.4%) |
| BSN Educator | 25.9% | (23.1%, 28.8%) | 0.0% | (0.0%, 7.4%) |
| CNS Educator | 1.4% | (0.8%, 2.4%) | 2.5% | (0.5%, 11.5%) |
| NP Educator | 6.9% | (5.4%, 8.8%) | 2.0% | (0.3%, 10.7%) |
| Other Educator | 3.5% | (2.5%, 4.9%) | 6.2% | (2.1%, 16.8%) |
| Simulations | 17.7% | (15.4%, 20.3%) | 7.8% | (3.0%, 18.9%) |
| Clinical/didactic | 30.8% | (27.9%, 33.9%) | 26.9% | (16.4%, 40.8%) |
| Dean/faculty chair | 5.2% | (4.0%, 6.9%) | 0.0% | (0.0%, 7.4%) |
| Faculty | 33.6% | (30.6%, 36.7%) | 9.8% | (4.1%, 21.4%) |
| Adjunct | 19.3% | (16.9%, 22.0%) | 7.6% | (2.9%, 18.7%) |
| Other | 18.1% | (15.7%, 20.8%) | 33.9% | (22.1%, 48.0%) |
The Number of Interprofessional Activities
| Number of Interprofessional Activities | RN = 12,061 | LPN = 1,293 | ||
|---|---|---|---|---|
| Estimate | 95% CI | Estimate | 95% CI | |
| 0 | 12.5% | (11.9%, 13.1%) | 20.0% | (17.9%, 22.3%) |
| 1 | 12.9% | (12.4%, 13.5%) | 16.9% | (15.0%, 19.1%) |
| 2 | 15.1% | (14.5%, 15.8%) | 16.3% | (14.3%, 18.4%) |
| 3 | 14.5% | (13.9%, 15.1%) | 15.6% | (13.7%, 17.7%) |
| 4 | 13.4% | (12.8%, 14.0%) | 9.9% | (8.4%, 11.6%) |
| 5 | 11.6% | (11.0%, 12.2%) | 7.9% | (6.5%, 9.5%) |
| 6 | 8.8% | (8.3%, 9.3%) | 5.3% | (4.2%, 6.7%) |
| 7 | 11.3% | (10.7%, 11.8%) | 8.1% | (6.8%, 9.7%) |
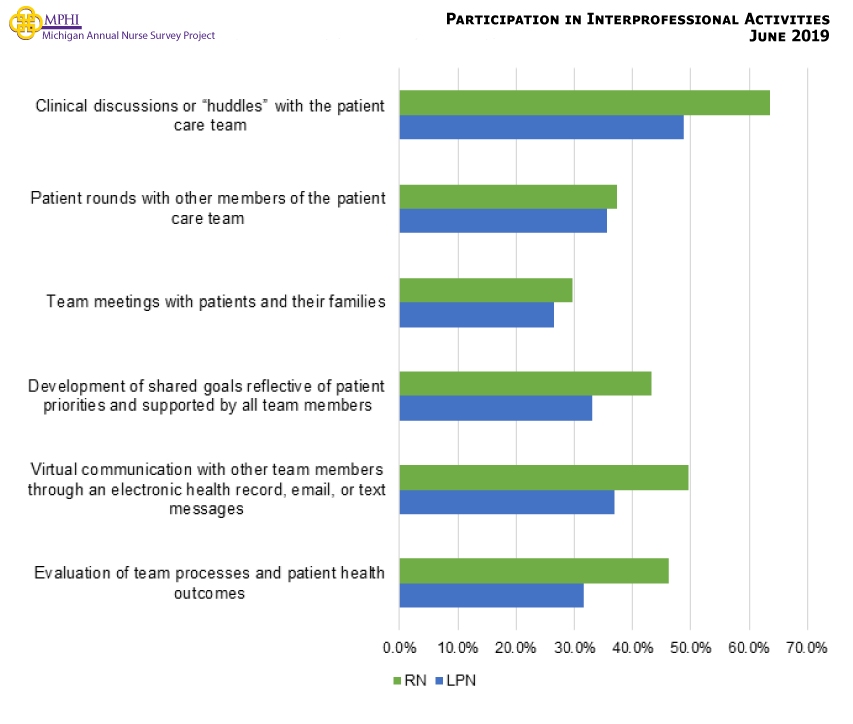
Participation in Interprofessional Activities
Change in Employment Setting
| Change in Employment Setting | RN = 11,605 | LPN = 1,239 | ||
|---|---|---|---|---|
| Estimate | 95% CI | Estimate | 95% CI | |
| Did not make a change | 57.3% | (55.9%, 58.7%) | 53.1% | (49.0%, 57.2%) |
| Made a change | 42.7% | (41.3%, 44.1%) | 46.9% | (42.8%, 51.0%) |
| Of those who made a change: | ||||
| I did not make an employment change in the past three years. | 1.2% | (1.0%, 1.6%) | 1.3% | (0.7%, 2.6%) |
| An inpatient setting to an outpatient setting? | 18.0% | (17.0%, 19.1%) | 13.7% | (11.1%, 16.8%) |
| An outpatient setting to an inpatient setting? | 4.9% | (4.4%, 5.6%) | 6.1% | (4.4%, 8.4%) |
| A primary care setting (e.g., family practice, general medicine) to a specialty care setting? | 4.2% | (3.7%, 4.8%) | 5.8% | (4.2%, 8.1%) |
| A specialty care setting to a primary care setting? | 2.0% | (1.7%, 2.5%) | 3.9% | (2.6%, 5.8%) |
| A sub-acute care setting to an acute care setting? | 3.4% | (2.9%, 4.0%) | 2.5% | (1.5%, 4.2%) |
| An acute care setting to a sub-acute care setting? | 2.1% | (1.8%, 2.6%) | 2.2% | (1.3%, 3.8%) |
| A direct patient care setting to a non-direct patient care setting? | 13.7% | (12.7%, 14.7%) | 9.9% | (7.7%, 12.6%) |
| A non-direct patient care setting to a direct patient care setting? | 4.8% | (4.2%, 5.4%) | 6.9% | (5.1%, 9.3%) |
| I changed locations but stayed in the same care setting. | 27.7% | (26.5%, 29.0%) | 32.8% | (29.1%, 36.8%) |
| Some other type of change in employment. | 29.9% | (28.7%, 31.2%) | 28.8% | (25.2%, 32.6%) |
Plans to Stop Working in the Next Five Years by Employment Setting
| Plans to Stop Working in Next 5 Years | RN = 11,456 | LPN = 1,179 | ||
|---|---|---|---|---|
| Estimate | 95% CI | Estimate | 95% CI | |
| Inpatient | 16.6% | (16.0%, 17.3%) | 24.2% | (21.8%, 26.7%) |
| Outpatient | 15.6% | (15.0%, 16.3%) | 16.6% | (14.5%, 18.8%) |
| Education | 29.4% | (28.6%, 30.3%) | 38.4% | (35.6%, 41.2%) |
| Other** | 25.7% | (24.9%, 26.5%) | 28.4% | (25.8%, 31.0%) |
*Nurses may work in both inpatient and outpatient settings.
**Other was not a response option and was created from nurses who answered no to each of the above employment settings.