2024 Nurse Licensure Data
Michigan Nurse Licensure Data websites will be taken off minurse.org in Fall 2026. The Number & Rate of Michigan Nurses and Changes in Michigan Licensed Nurse Populations information will be moved to https://minurse.org/survey-data/. If you have any questions or concerns, please contact us at info@minurse.org.
This website focuses on data obtained from the Michigan Bureau of Professional Licensing and includes all nurses who are currently licensed to practice in Michigan. This website provides information that illustrates the distribution of nurses in Michigan, both in absolute numbers and relative to the State’s population distribution. Information regarding the age distribution of nurses across the state is also included. The information is presented in easy to use maps, tables and charts.

Michigan Overall
Michigan Licensed Nurses by Type and Residency
| Residence | Total | RNs | LPNs | |||
|---|---|---|---|---|---|---|
| # of Nurses | % | # of Nurses | % | # of Nurses | % | |
| Michigan | 161,143 | 82.1 | 141,646 | 80.9 | 19,497 | 92.8 |
| Ohio | 4,280 | 2.2 | 3,974 | 2.3 | 306 | 1.5 |
| Indiana | 1,615 | 0.8 | 1,519 | 0.9 | 96 | 0.5 |
| Wisconsin | 1,330 | 0.7 | 1,225 | 0.7 | 105 | 0.5 |
| Minnesota | 390 | 0.2 | 376 | 0.2 | 14 | 0.1 |
| Other U.S. States | 22,787 | 11.6 | 21,976 | 12.5 | 811 | 3.9 |
| Canada | 3,653 | 1.9 | 3,610 | 2.1 | 43 | 0.2 |
| Other Countries | 1,000 | 0.5 | 861 | 0.5 | 139 | 0.7 |
| Total | 196,198 | 100.0 | 175,187 | 100.0 | 21,011 | 100.0 |
| License Type | Living in Michigan | Living Outside Michigan | Total | ||
|---|---|---|---|---|---|
| # | % | # | % | ||
| Total | 161,143 | 82.1% | 35,055 | 17.9% | 196,198 |
| LPNs | 19,497 | 92.8% | 1,514 | 7.2% | 21,011 |
| RNs | 141,646 | 80.9% | 33,541 | 19.1% | 175,187 |
| NPs | 11,868 | 79.3% | 3,104 | 20.7% | 14,972 |
| CRNAs | 2,662 | 84.6% | 485 | 15.4% | 3,147 |
| CNMs | 496 | 87.8% | 69 | 12.2% | 565 |
| CNSs | 294 | 90.5% | 31 | 9.5% | 325 |
Total Michigan Nurses (LPNs and RNs) by Prosperity Region and County
| Region | # of Nurses | Population* | Nurses per 10,000 |
|---|---|---|---|
| Michigan* | 196,198 | 10,037,261 | 195.5 |
| Eastern/Central/Western UP | 5,344 | 303,123 | 176.3 |
| Northwest LP | 5,580 | 316,057 | 176.6 |
| Northeast LP | 3,227 | 206,460 | 156.3 |
| West/West Central | 24,488 | 1,645,864 | 148.8 |
| East Central | 9,326 | 552,121 | 168.9 |
| East | 14,352 | 842,519 | 170.3 |
| South Central | 6,221 | 473,177 | 131.5 |
| Southwest | 11,132 | 781,375 | 142.5 |
| Southeast | 19,268 | 1,019,869 | 188.9 |
| Detroit Metro | 62,205 | 3,896,696 | 159.6 |
*Population data are based on 2023 census data *To see other regions, please press the “Next” button at the bottom of the table.
| Region | County | # of Nurses | Population* | Nurses per 10,000 |
|---|---|---|---|---|
| Eastern/ Central/ Western UP | 5,344 | 303,123 | 176.3 | |
| Alger | 132 | 8,757 | 150.7 | |
| Baraga | 124 | 8,310 | 149.2 | |
| Chippewa | 503 | 36,264 | 138.7 | |
| Delta | 626 | 36,790 | 170.2 | |
| Dickinson | 503 | 25,982 | 193.6 | |
| Gogebic | 226 | 14,224 | 158.9 | |
| Houghton | 696 | 37,599 | 185.1 | |
| Iron | 171 | 11,740 | 145.7 | |
| Keweenaw | 52 | 2,172 | 239.4 | |
| Luce | 77 | 6,435 | 119.7 | |
| Mackinac | 169 | 10,851 | 155.7 | |
| Marquette | 1,594 | 66,999 | 237.9 | |
| Menominee | 247 | 22,945 | 107.6 | |
| Ontonagon | 84 | 5,906 | 142.2 | |
| Schoolcraft | 140 | 8,149 | 171.8 | |
| Northwest LP | 5,580 | 316,057 | 176.6 | |
| Antrim | 310 | 24,409 | 127.0 | |
| Benzie | 331 | 18,441 | 179.5 | |
| Charlevoix | 451 | 26,159 | 172.4 | |
| Emmet | 696 | 34,123 | 204.0 | |
| Grand Traverse | 2,196 | 96,421 | 227.8 | |
| Kalkaska | 212 | 18,490 | 114.7 | |
| Leelanau | 438 | 23,019 | 190.3 | |
| Manistee | 320 | 25,562 | 125.2 | |
| Missaukee | 201 | 15,311 | 131.3 | |
| Wexford | 425 | 34,122 | 124.6 | |
| | ||||
| | ||||
| | ||||
| | ||||
| | ||||
| Northeast LP | 3,227 | 206,460 | 156.3 | |
| Alcona | 138 | 10,489 | 131.6 | |
| Alpena | 600 | 28,904 | 207.6 | |
| Cheboygan | 364 | 26,048 | 139.7 | |
| Crawford | 213 | 13,538 | 157.3 | |
| Iosco | 349 | 25,373 | 137.5 | |
| Montmorency | 126 | 9,678 | 130.2 | |
| Ogemaw | 388 | 20,990 | 184.8 | |
| Oscoda | 94 | 8,545 | 110.0 | |
| Otsego | 419 | 25,747 | 162.7 | |
| Presque Isle | 200 | 13,285 | 150.5 | |
| Roscommon | 336 | 23,863 | 140.8 | |
| | ||||
| | ||||
| | ||||
| | ||||
| West/West Central | 24,488 | 1,645,864 | 148.8 | |
| Allegan | 1,604 | 121,939 | 131.5 | |
| Barry | 1,004 | 63,808 | 157.3 | |
| Ionia | 705 | 66,262 | 106.4 | |
| Kent | 10,946 | 661,354 | 165.5 | |
| Lake | 82 | 12,734 | 64.4 | |
| Mason | 517 | 29,159 | 177.3 | |
| Mecosta | 430 | 41,099 | 104.6 | |
| Montcalm | 928 | 68,154 | 136.2 | |
| Muskegon | 2,292 | 176,564 | 129.8 | |
| Newaygo | 558 | 51,108 | 109.2 | |
| Oceana | 297 | 26,981 | 110.1 | |
| Osceola | 270 | 23,330 | 115.7 | |
| Ottawa | 4,855 | 303,372 | 160.0 | |
| | ||||
| | ||||
| East Central | 9,326 | 552,121 | 168.9 | |
| Arenac | 269 | 15,145 | 177.6 | |
| Bay | 2,157 | 102,500 | 210.4 | |
| Clare | 396 | 31,316 | 126.5 | |
| Gladwin | 440 | 25,853 | 170.2 | |
| Gratiot | 564 | 41,368 | 136.3 | |
| Isabella | 723 | 64,118 | 112.8 | |
| Midland | 1,547 | 84,039 | 184.1 | |
| Saginaw | 3,230 | 187,782 | 172.0 | |
| | ||||
| | ||||
| | ||||
| | ||||
| | ||||
| | ||||
| | ||||
| East | 14,352 | 842,519 | 170.3 | |
| Genesee | 6,791 | 401,522 | 169.1 | |
| Huron | 494 | 30,927 | 159.7 | |
| Lapeer | 1,597 | 88,977 | 179.5 | |
| Saint Clair | 3,040 | 159,874 | 190.1 | |
| Sanilac | 588 | 40,368 | 145.7 | |
| Shiawassee | 1,000 | 68,025 | 147.0 | |
| Tuscola | 842 | 52,826 | 159.4 | |
| South Central | 6,221 | 473,177 | 131.5 | |
| Clinton | 1,478 | 79,720 | 185.4 | |
| Eaton | 1,504 | 108,820 | 138.2 | |
| Ingham | 3,239 | 284,637 | 113.8 | |
| Southwest | 11,132 | 781,375 | 142.5 | |
| Berrien | 2,011 | 152,261 | 132.1 | |
| Branch | 509 | 45,215 | 112.6 | |
| Calhoun | 1,942 | 133,366 | 145.6 | |
| Cass | 456 | 51,642 | 88.3 | |
| Kalamazoo | 4,376 | 262,215 | 166.9 | |
| Saint Joseph | 738 | 60,878 | 121.2 | |
| Van Buren | 1,100 | 75,798 | 145.1 | |
| Southeast | 19,268 | 1,019,869 | 188.9 | |
| Hillsdale | 592 | 45,587 | 129.9 | |
| Jackson | 2,610 | 159,424 | 163.7 | |
| Lenawee | 1,612 | 97,520 | 165.3 | |
| Livingston | 4,556 | 196,757 | 231.6 | |
| Monroe | 3,098 | 155,045 | 199.8 | |
| Washtenaw | 6,800 | 365,536 | 186.0 | |
| Detroit Metro | 62,205 | 3,896,696 | 159.6 | |
| Macomb | 15,015 | 875,101 | 171.6 | |
| Oakland | 21,723 | 1,270,426 | 171.0 | |
| Wayne | 25,467 | 1,751,169 | 145.4 | |
| Michigan* | 196,198 | 10,037,261 | 195.5 | |
| *Includes nurses who live outside of Michigan *Population data are based on 2023 census data |
State Distribution
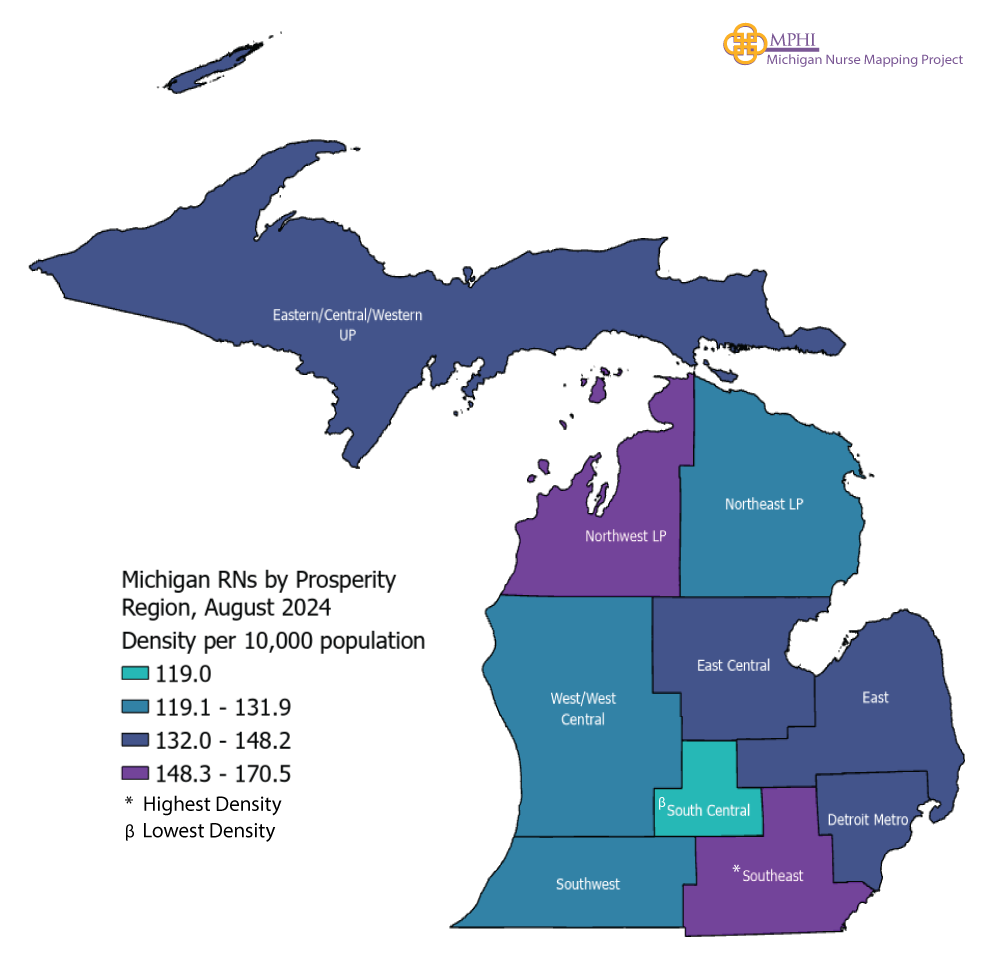
Michigan Licensed Registered Nurses (RNs)
| Region | # of Nurses | Population* | Nurses per 10,000 |
|---|---|---|---|
| Michigan* | 175,187 | 10,037,261 | 174.5 |
| Eastern/Central/Western UP | 4,206 | 303,123 | 138.8 |
| Northwest LP | 5,124 | 316,057 | 162.1 |
| Northeast LP | 2,688 | 206,460 | 130.2 |
| West/West Central | 21,711 | 1,645,864 | 131.9 |
| East Central | 8,171 | 552,121 | 148.0 |
| East | 12,489 | 842,519 | 148.2 |
| South Central | 5,631 | 473,177 | 119.0 |
| Southwest | 9,823 | 781,375 | 125.7 |
| Southeast | 17,386 | 1,019,869 | 170.5 |
| Detroit Metro | 54,417 | 3,896,696 | 139.6 |
*Population data are based on 2023 census data
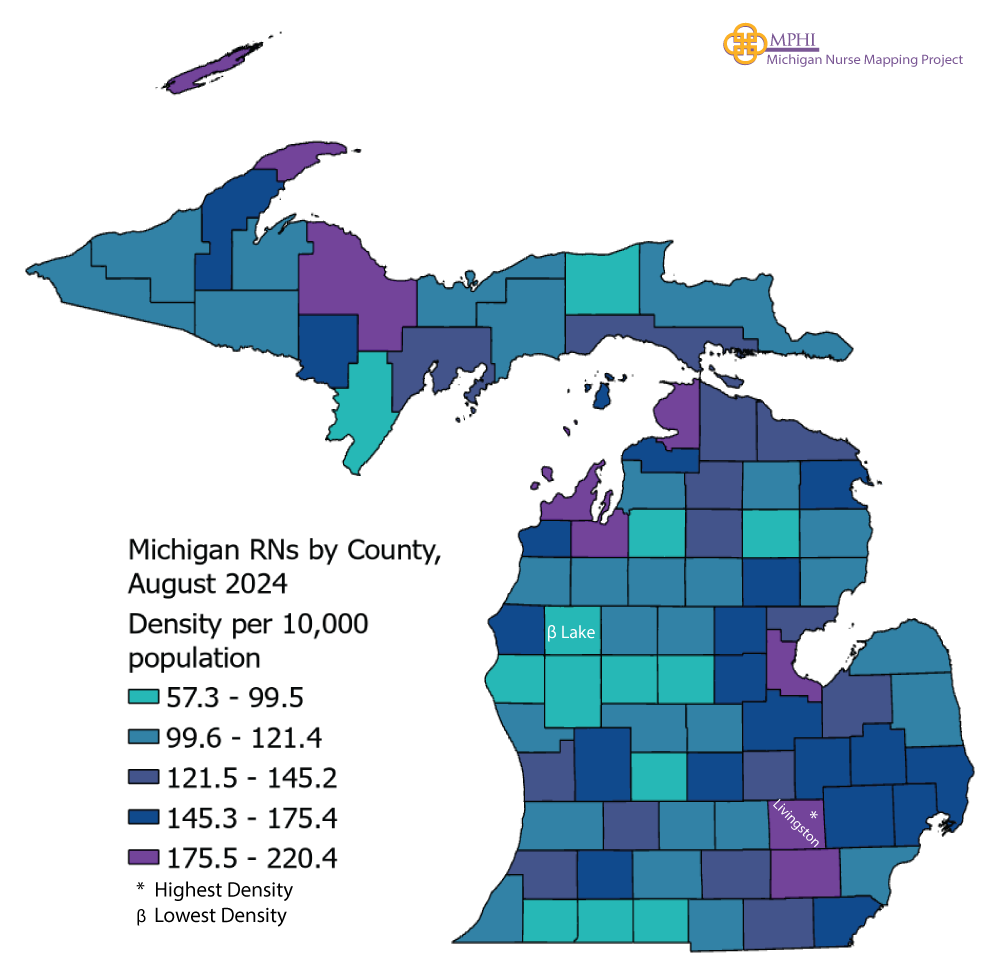
| Region | County | # of Nurses | Population* | Nurses per 10,000 |
|---|---|---|---|---|
| Eastern/ Central/ Western UP | 4,206 | 303,123 | 138.8 | |
| Alger | 102 | 8,757 | 116.5 | |
| Baraga | 99 | 8,310 | 119.1 | |
| Chippewa | 406 | 36,264 | 112.0 | |
| Delta | 515 | 36,790 | 140.0 | |
| Dickinson | 390 | 25,982 | 150.1 | |
| Gogebic | 171 | 14,224 | 120.2 | |
| Houghton | 600 | 37,599 | 159.6 | |
| Iron | 133 | 11,740 | 113.3 | |
| Keweenaw | 46 | 2,172 | 211.8 | |
| Luce | 57 | 6,435 | 88.6 | |
| Mackinac | 141 | 10,851 | 129.9 | |
| Marquette | 1,201 | 66,999 | 179.3 | |
| Menominee | 178 | 22,945 | 77.6 | |
| Ontonagon | 69 | 5,906 | 116.8 | |
| Schoolcraft | 98 | 8,149 | 120.3 | |
| Northwest LP | 5,124 | 316,057 | 162.1 | |
| Antrim | 267 | 24,409 | 109.4 | |
| Benzie | 299 | 18,441 | 162.1 | |
| Charlevoix | 424 | 26,159 | 162.1 | |
| Emmet | 671 | 34,123 | 196.6 | |
| Grand Traverse | 2,032 | 96,421 | 210.7 | |
| Kalkaska | 176 | 18,490 | 95.2 | |
| Leelanau | 419 | 23,019 | 182.0 | |
| Manistee | 285 | 25,562 | 111.5 | |
| Missaukee | 171 | 15,311 | 111.7 | |
| Wexford | 380 | 34,122 | 111.4 | |
| Northeast LP | 2,688 | 206,460 | 130.2 | |
| Alcona | 115 | 10,489 | 109.6 | |
| Alpena | 478 | 28,904 | 165.4 | |
| Cheboygan | 334 | 26,048 | 128.2 | |
| Crawford | 169 | 13,538 | 124.8 | |
| Iosco | 270 | 25,373 | 106.4 | |
| Montmorency | 107 | 9,678 | 110.6 | |
| Ogemaw | 324 | 20,990 | 154.4 | |
| Oscoda | 75 | 8,545 | 87.8 | |
| Otsego | 365 | 25,747 | 141.8 | |
| Presque Isle | 172 | 13,285 | 129.5 | |
| Roscommon | 279 | 23,863 | 116.9 | |
| West/West Central | 21,711 | 1,645,864 | 131.9 | |
| Allegan | 1,413 | 121,939 | 115.9 | |
| Barry | 876 | 63,808 | 137.3 | |
| Ionia | 607 | 66,262 | 91.6 | |
| Kent | 9,793 | 661,354 | 148.1 | |
| Lake | 73 | 12,734 | 57.3 | |
| Mason | 461 | 29,159 | 158.1 | |
| Mecosta | 395 | 41,099 | 96.1 | |
| Montcalm | 772 | 68,154 | 113.3 | |
| Muskegon | 1,946 | 176,564 | 110.2 | |
| Newaygo | 481 | 51,108 | 94.1 | |
| Oceana | 252 | 26,981 | 93.4 | |
| Osceola | 237 | 23,330 | 101.6 | |
| Ottawa | 4,405 | 303,372 | 145.2 | |
| East Central | 8,171 | 552,121 | 148.0 | |
| Arenac | 219 | 15,145 | 144.6 | |
| Bay | 1,890 | 102,500 | 184.4 | |
| Clare | 336 | 31,316 | 107.3 | |
| Gladwin | 382 | 25,853 | 147.8 | |
| Gratiot | 482 | 41,368 | 116.5 | |
| Isabella | 633 | 64,118 | 98.7 | |
| Midland | 1,419 | 84,039 | 168.9 | |
| Saginaw | 2,810 | 187,782 | 149.6 | |
| East | 12,489 | 842,519 | 148.2 | |
| Genesee | 6,085 | 401,522 | 151.5 | |
| Huron | 362 | 30,927 | 117.0 | |
| Lapeer | 1,452 | 88,977 | 163.2 | |
| Saint Clair | 2,531 | 159,874 | 158.3 | |
| Sanilac | 453 | 40,368 | 112.2 | |
| Shiawassee | 931 | 68,025 | 136.9 | |
| Tuscola | 675 | 52,826 | 127.8 | |
| South Central | 5,631 | 473,177 | 119.0 | |
| Clinton | 1,399 | 79,720 | 175.5 | |
| Eaton | 1,322 | 108,820 | 121.5 | |
| Ingham | 2,910 | 284,637 | 102.2 | |
| Southwest | 9,823 | 781,375 | 125.7 | |
| Berrien | 1,808 | 152,261 | 118.7 | |
| Branch | 396 | 45,215 | 87.6 | |
| Calhoun | 1,592 | 133,366 | 119.4 | |
| Cass | 415 | 51,642 | 80.4 | |
| Kalamazoo | 3,985 | 262,215 | 152.0 | |
| Saint Joseph | 606 | 60,878 | 99.5 | |
| Van Buren | 1,021 | 75,798 | 134.7 | |
| Southeast | 17,386 | 1,019,869 | 170.5 | |
| Hillsdale | 480 | 45,587 | 105.3 | |
| Jackson | 2,236 | 159,424 | 140.3 | |
| Lenawee | 1,325 | 97,520 | 135.9 | |
| Livingston | 4,337 | 196,757 | 220.4 | |
| Monroe | 2,490 | 155,045 | 160.6 | |
| Washtenaw | 6,518 | 365,536 | 178.3 | |
| Detroit Metro | 54,417 | 3,896,696 | 139.6 | |
| Macomb | 13,340 | 875,101 | 152.4 | |
| Oakland | 20,114 | 1,270,426 | 158.3 | |
| Wayne | 20,963 | 1,751,169 | 119.7 | |
| Michigan* | 175,187 | 10,037,261 | 174.5 | |
| *Includes nurses who live outside of Michigan *Population data are based on 2023 census data |
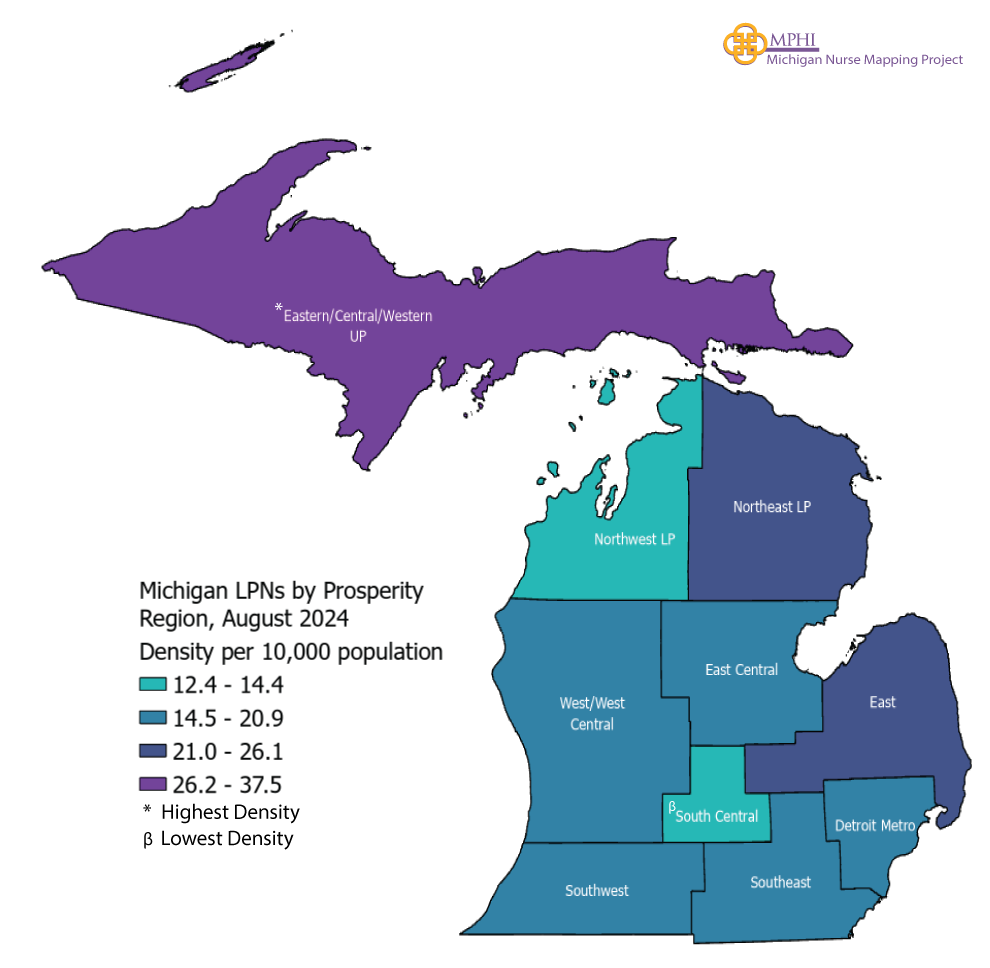
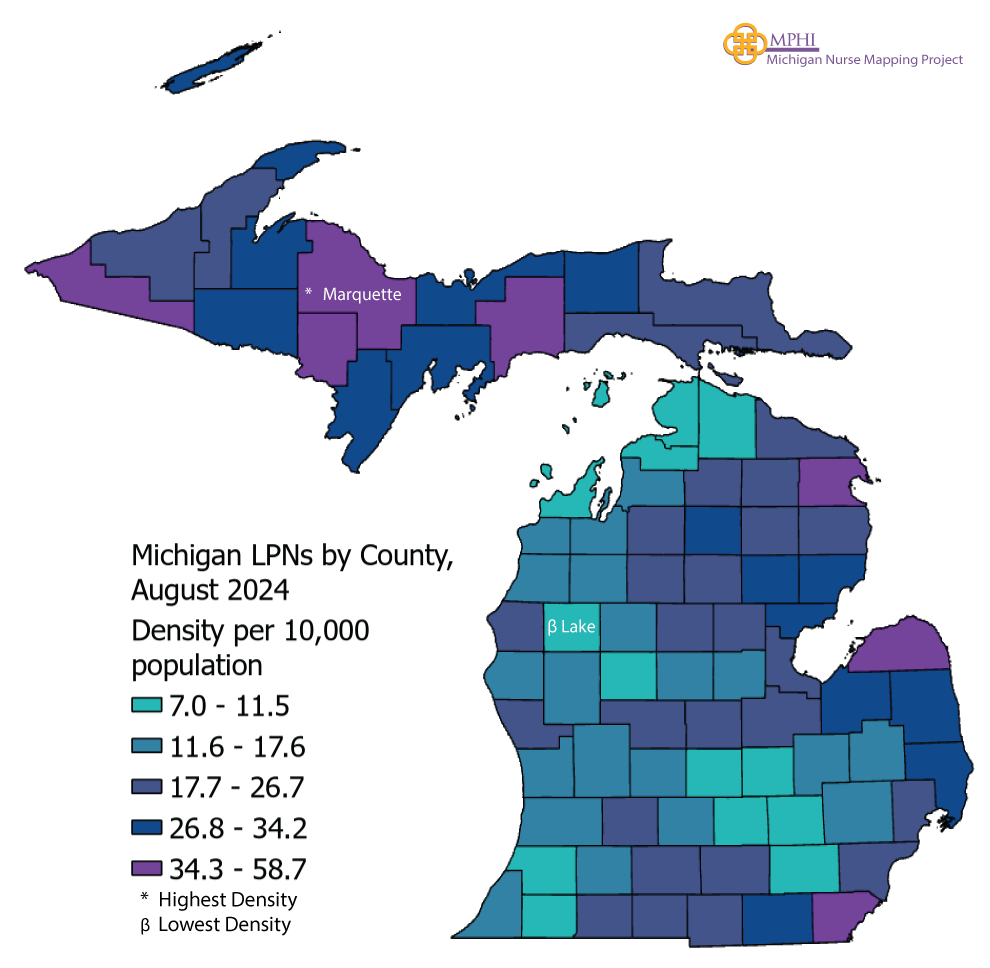
Michigan Licensed Practical Nurses (LPNs)
| Region | # of Nurses | Population* | Nurses per 10,000 |
|---|---|---|---|
| Michigan* | 21,011 | 10,037,261 | 20.9 |
| Eastern/Central/Western UP | 1,138 | 303,123 | 37.5 |
| Northwest LP | 456 | 316,057 | 14.4 |
| Northeast LP | 539 | 206,460 | 26.1 |
| West/West Central | 2,777 | 1,645,864 | 16.9 |
| East Central | 1,155 | 552,121 | 20.9 |
| East | 1,863 | 842,519 | 22.1 |
| South Central | 590 | 473,177 | 12.5 |
| Southwest | 1,309 | 781,375 | 16.8 |
| Southeast | 1,882 | 1,019,869 | 18.5 |
| Detroit Metro | 7,788 | 3,896,696 | 20.0 |
*Population data are based on 2023 census data
| Region | County | # of Nurses | Population* | Nurses per 10,000 |
|---|---|---|---|---|
| Eastern/ Central/ Western UP | 1,138 | 303,123 | 37.5 | |
| Alger | 30 | 8,757 | 34.3 | |
| Baraga | 25 | 8,310 | 30.1 | |
| Chippewa | 97 | 36,264 | 26.7 | |
| Delta | 111 | 36,790 | 30.2 | |
| Dickinson | 113 | 25,982 | 43.5 | |
| Gogebic | 55 | 14,224 | 38.7 | |
| Houghton | 96 | 37,599 | 25.5 | |
| Iron | 38 | 11,740 | 32.4 | |
| Keweenaw | 6 | 2,172 | 27.6 | |
| Luce | 20 | 6,435 | 31.1 | |
| Mackinac | 28 | 10,851 | 25.8 | |
| Marquette | 393 | 66,999 | 58.7 | |
| Menominee | 69 | 22,945 | 30.1 | |
| Ontonagon | 15 | 5,906 | 25.4 | |
| Schoolcraft | 42 | 8,149 | 51.5 | |
| Northwest LP | 456 | 316,057 | 14.4 | |
| Antrim | 43 | 24,409 | 17.6 | |
| Benzie | 32 | 18,441 | 17.4 | |
| Charlevoix | 27 | 26,159 | 10.3 | |
| Emmet | 25 | 34,123 | 7.3 | |
| Grand Traverse | 164 | 96,421 | 17.0 | |
| Kalkaska | 36 | 18,490 | 19.5 | |
| Leelanau | 19 | 23,019 | 8.3 | |
| Manistee | 35 | 25,562 | 13.7 | |
| Missaukee | 30 | 15,311 | 19.6 | |
| Wexford | 45 | 34,122 | 13.2 | |
| Northeast LP | 539 | 206,460 | 26.1 | |
| Alcona | 23 | 10,489 | 21.9 | |
| Alpena | 122 | 28,904 | 42.2 | |
| Cheboygan | 30 | 26,048 | 11.5 | |
| Crawford | 44 | 13,538 | 32.5 | |
| Iosco | 79 | 25,373 | 31.1 | |
| Montmorency | 19 | 9,678 | 19.6 | |
| Ogemaw | 64 | 20,990 | 30.5 | |
| Oscoda | 19 | 8,545 | 22.2 | |
| Otsego | 54 | 25,747 | 21.0 | |
| Presque Isle | 28 | 13,285 | 21.1 | |
| Roscommon | 57 | 23,863 | 23.9 | |
| West/West Central | 2,777 | 1,645,864 | 16.9 | |
| Allegan | 191 | 121,939 | 15.7 | |
| Barry | 128 | 63,808 | 20.1 | |
| Ionia | 98 | 66,262 | 14.8 | |
| Kent | 1,153 | 661,354 | 17.4 | |
| Lake | 9 | 12,734 | 7.1 | |
| Mason | 56 | 29,159 | 19.2 | |
| Mecosta | 35 | 41,099 | 8.5 | |
| Montcalm | 156 | 68,154 | 22.9 | |
| Muskegon | 346 | 176,564 | 19.6 | |
| Newaygo | 77 | 51,108 | 15.1 | |
| Oceana | 45 | 26,981 | 16.7 | |
| Osceola | 33 | 23,330 | 14.1 | |
| Ottawa | 450 | 303,372 | 14.8 | |
| East Central | 1,155 | 552,121 | 20.9 | |
| Arenac | 50 | 15,145 | 33.0 | |
| Bay | 267 | 102,500 | 26.0 | |
| Clare | 60 | 31,316 | 19.2 | |
| Gladwin | 58 | 25,853 | 22.4 | |
| Gratiot | 82 | 41,368 | 19.8 | |
| Isabella | 90 | 64,118 | 14.0 | |
| Midland | 128 | 84,039 | 15.2 | |
| Saginaw | 420 | 187,782 | 22.4 | |
| East | 1,863 | 842,519 | 22.1 | |
| Genesee | 706 | 401,522 | 17.6 | |
| Huron | 132 | 30,927 | 42.7 | |
| Lapeer | 145 | 88,977 | 16.3 | |
| Saint Clair | 509 | 159,874 | 31.8 | |
| Sanilac | 135 | 40,368 | 33.4 | |
| Shiawassee | 69 | 68,025 | 10.1 | |
| Tuscola | 167 | 52,826 | 31.6 | |
| South Central | 590 | 473,177 | 12.5 | |
| Clinton | 79 | 79,720 | 9.9 | |
| Eaton | 182 | 108,820 | 16.7 | |
| Ingham | 329 | 284,637 | 11.6 | |
| Southwest | 1,309 | 781,375 | 16.8 | |
| Berrien | 203 | 152,261 | 13.3 | |
| Branch | 113 | 45,215 | 25.0 | |
| Calhoun | 350 | 133,366 | 26.2 | |
| Cass | 41 | 51,642 | 7.9 | |
| Kalamazoo | 391 | 262,215 | 14.9 | |
| Saint Joseph | 132 | 60,878 | 21.7 | |
| Van Buren | 79 | 75,798 | 10.4 | |
| Southeast | 1,882 | 1,019,869 | 18.5 | |
| Hillsdale | 112 | 45,587 | 24.6 | |
| Jackson | 374 | 159,424 | 23.5 | |
| Lenawee | 287 | 97,520 | 29.4 | |
| Livingston | 219 | 196,757 | 11.1 | |
| Monroe | 608 | 155,045 | 39.2 | |
| Washtenaw | 282 | 365,536 | 7.7 | |
| Detroit Metro | 7,788 | 3,896,696 | 20.0 | |
| Macomb | 1,675 | 875,101 | 19.1 | |
| Oakland | 1,609 | 1,270,426 | 12.7 | |
| Wayne | 4,504 | 1,751,169 | 25.7 | |
| Michigan* | 21,011 | 10,037,261 | 20.9 | |
| *Includes nurses who live outside of Michigan *Population data are based on 2023 census data |
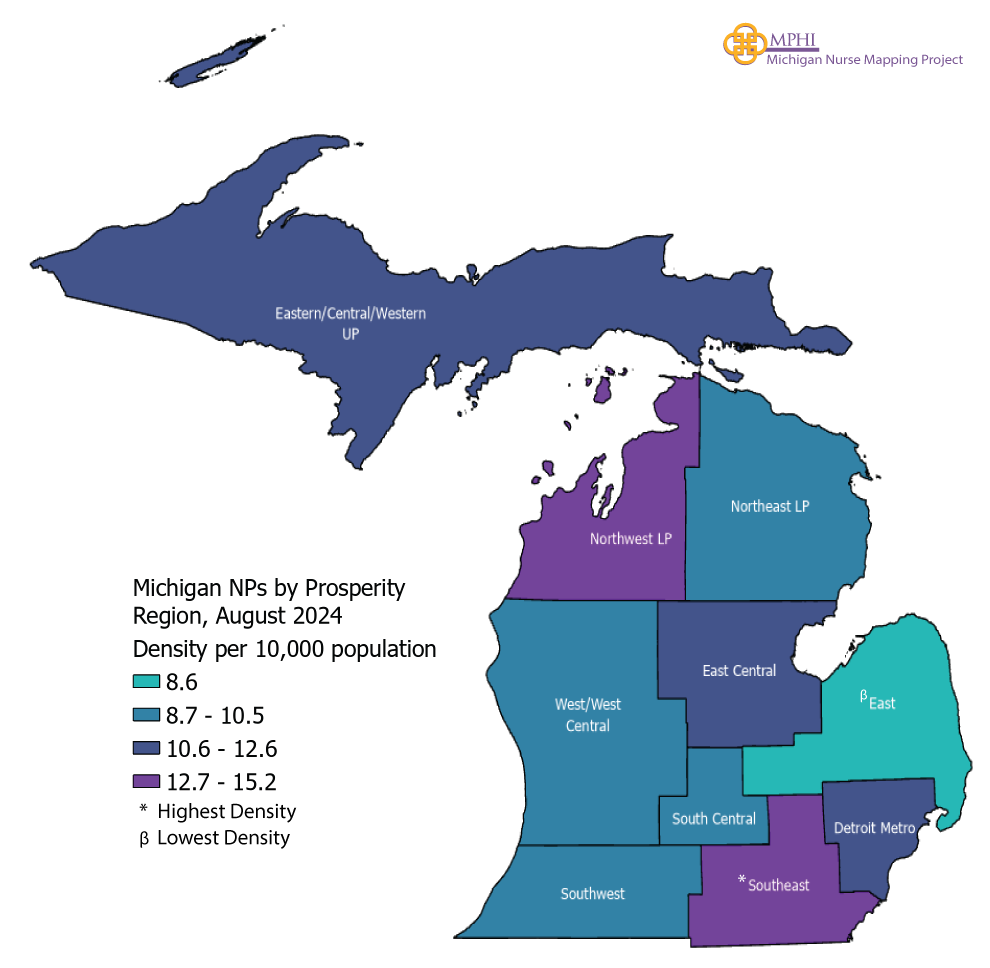
Michigan Licensed Nurse Practitioners (NPs)
| Region | # of Nurses | Population* | Nurses per 10,000 |
|---|---|---|---|
| Michigan* | 14,972 | 10,037,261 | 14.9 |
| Eastern/Central/Western UP | 360 | 303,123 | 11.9 |
| Northwest LP | 443 | 316,057 | 14.0 |
| Northeast LP | 218 | 206,460 | 10.6 |
| West/West Central | 1,741 | 1,645,864 | 10.6 |
| East Central | 644 | 552,121 | 11.7 |
| East | 728 | 842,519 | 8.6 |
| South Central | 480 | 473,177 | 10.1 |
| Southwest | 764 | 781,375 | 9.8 |
| Southeast | 1,553 | 1,019,869 | 15.2 |
| Detroit Metro | 4,937 | 3,896,696 | 12.7 |
*Population data are based on 2023 census data
| County | # of Nurses | Population* | Nurses per 10,000 | |
|---|---|---|---|---|
| Eastern/ Central/ Western UP | 360 | 303,123 | 11.9 | |
| Alger | 8 | 8,757 | 9.1 | |
| Baraga | * | 8,310 | * | |
| Chippewa | 42 | 36,264 | 11.6 | |
| Delta | 34 | 36,790 | 9.2 | |
| Dickinson | 32 | 25,982 | 12.3 | |
| Gogebic | 13 | 14,224 | 9.1 | |
| Houghton | 29 | 37,599 | 7.7 | |
| Iron | 14 | 11,740 | 11.9 | |
| Keweenaw | * | 2,172 | * | |
| Luce | * | 6,435 | * | |
| Mackinac | 14 | 10,851 | 12.9 | |
| Marquette | 134 | 66,999 | 20.0 | |
| Menominee | 14 | 22,945 | 6.1 | |
| Ontonagon | * | 5,906 | * | |
| Schoolcraft | 11 | 8,149 | 13.5 | |
| Northwest LP | 443 | 316,057 | 14.0 | |
| Antrim | 15 | 24,409 | 6.1 | |
| Benzie | 23 | 18,441 | 12.5 | |
| Charlevoix | 27 | 26,159 | 10.3 | |
| Emmet | 64 | 34,123 | 18.8 | |
| Grand Traverse | 204 | 96,421 | 21.2 | |
| Kalkaska | 12 | 18,490 | 6.5 | |
| Leelanau | 41 | 23,019 | 17.8 | |
| Manistee | 18 | 25,562 | 7.0 | |
| Missaukee | 9 | 15,311 | 5.9 | |
| Wexford | 30 | 34,122 | 8.8 | |
| Northeast LP | 218 | 206,460 | 10.6 | |
| Alcona | 10 | 10,489 | 9.5 | |
| Alpena | 47 | 28,904 | 16.3 | |
| Cheboygan | 19 | 26,048 | 7.3 | |
| Crawford | 12 | 13,538 | 8.9 | |
| Iosco | 20 | 25,373 | 7.9 | |
| Montmorency | * | 9,678 | * | |
| Ogemaw | 32 | 20,990 | 15.2 | |
| Oscoda | * | 8,545 | * | |
| Otsego | 36 | 25,747 | 14.0 | |
| Presque Isle | 11 | 13,285 | 8.3 | |
| Roscommon | 21 | 23,863 | 8.8 | |
| West/West Central | 1,741 | 1,645,864 | 10.6 | |
| Allegan | 68 | 121,939 | 5.6 | |
| Barry | 54 | 63,808 | 8.5 | |
| Ionia | 39 | 66,262 | 5.9 | |
| Kent | 983 | 661,354 | 14.9 | |
| Lake | * | 12,734 | * | |
| Mason | 34 | 29,159 | 11.7 | |
| Mecosta | 30 | 41,099 | 7.3 | |
| Montcalm | 47 | 68,154 | 6.9 | |
| Muskegon | 114 | 176,564 | 6.5 | |
| Newaygo | 30 | 51,108 | 5.9 | |
| Oceana | 18 | 26,981 | 6.7 | |
| Osceola | 7 | 23,330 | 3.0 | |
| Ottawa | 313 | 303,372 | 10.3 | |
| East Central | 644 | 552,121 | 11.7 | |
| Arenac | 18 | 15,145 | 11.9 | |
| Bay | 112 | 102,500 | 10.9 | |
| Clare | 9 | 31,316 | 2.9 | |
| Gladwin | 22 | 25,853 | 8.5 | |
| Gratiot | 36 | 41,368 | 8.7 | |
| Isabella | 44 | 64,118 | 6.9 | |
| Midland | 143 | 84,039 | 17.0 | |
| Saginaw | 260 | 187,782 | 13.8 | |
| East | 728 | 842,519 | 8.6 | |
| Genesee | 341 | 401,522 | 8.5 | |
| Huron | 24 | 30,927 | 7.8 | |
| Lapeer | 85 | 88,977 | 9.6 | |
| Saint Clair | 155 | 159,874 | 9.7 | |
| Sanilac | 31 | 40,368 | 7.7 | |
| Shiawassee | 51 | 68,025 | 7.5 | |
| Tuscola | 41 | 52,826 | 7.8 | |
| South Central | 480 | 473,177 | 10.1 | |
| Clinton | 114 | 79,720 | 14.3 | |
| Eaton | 103 | 108,820 | 9.5 | |
| Ingham | 263 | 284,637 | 9.2 | |
| Southwest | 764 | 781,375 | 9.8 | |
| Berrien | 149 | 152,261 | 9.8 | |
| Branch | 27 | 45,215 | 6.0 | |
| Calhoun | 108 | 133,366 | 8.1 | |
| Cass | 27 | 51,642 | 5.2 | |
| Kalamazoo | 341 | 262,215 | 13.0 | |
| Saint Joseph | 43 | 60,878 | 7.1 | |
| Van Buren | 69 | 75,798 | 9.1 | |
| Southeast | 1,553 | 1,019,869 | 15.2 | |
| Hillsdale | 34 | 45,587 | 7.5 | |
| Jackson | 175 | 159,424 | 11.0 | |
| Lenawee | 83 | 97,520 | 8.5 | |
| Livingston | 327 | 196,757 | 16.6 | |
| Monroe | 182 | 155,045 | 11.7 | |
| Washtenaw | 752 | 365,536 | 20.6 | |
| Detroit Metro | 4,937 | 3,896,696 | 12.7 | |
| Macomb | 1,088 | 875,101 | 12.4 | |
| Oakland | 2,177 | 1,270,426 | 17.1 | |
| Wayne | 1,672 | 1,751,169 | 9.5 | |
| Michigan* | 14,972 | 10,037,261 | 14.9 | |
| *Includes nurses who live outside of Michigan *Population data are based on 2023 census data *Cells with less than 6 nurses were censored |

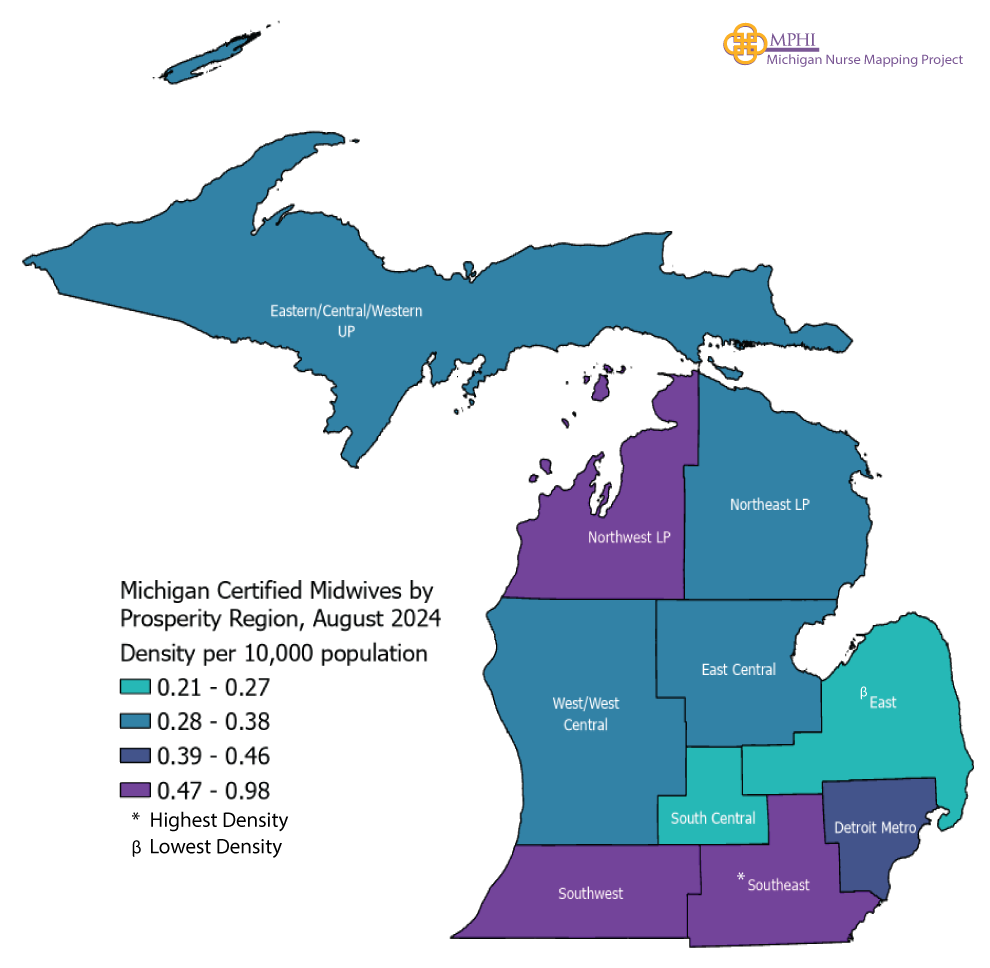
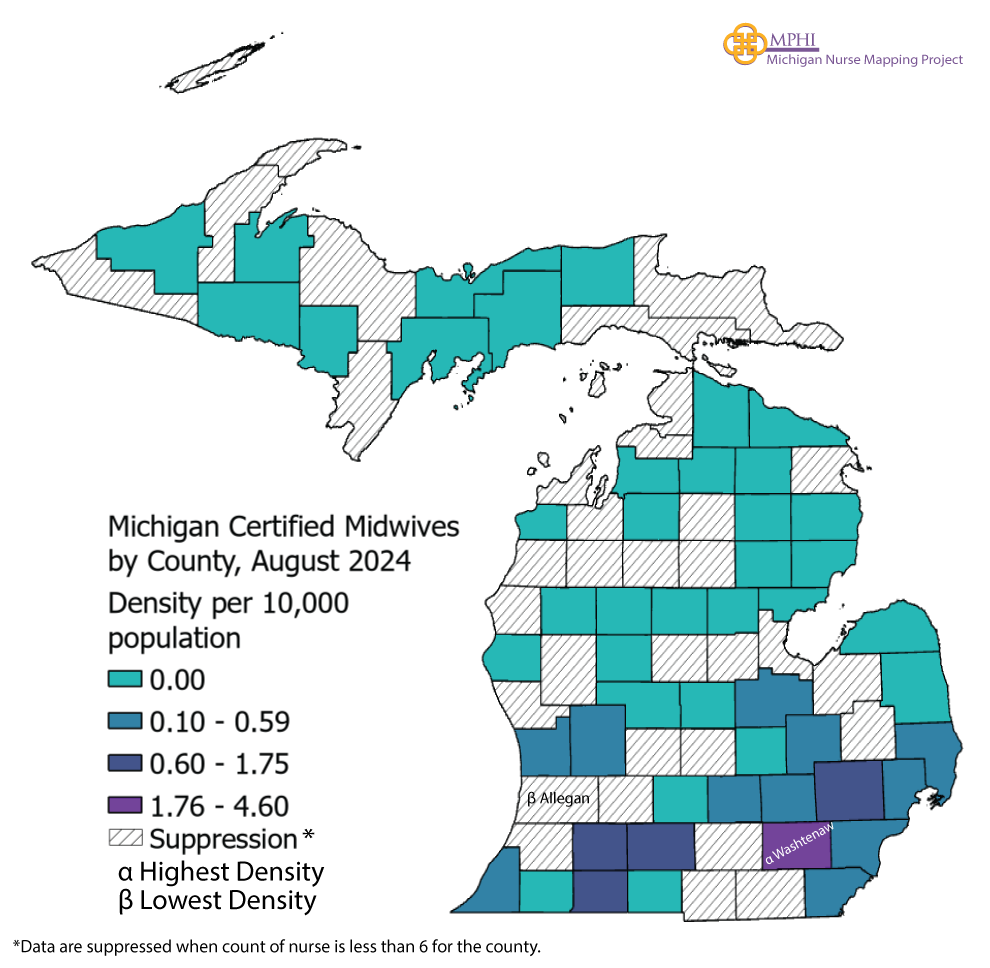
Michigan Certified Nurse Midwives (CNMs)
| Region | # of Nurses | Population* | Nurses per 10,000 |
|---|---|---|---|
| Michigan* | 565 | 10,037,261 | 0.6 |
| Eastern/Central/Western UP | 12 | 303,123 | 0.4 |
| Northwest LP | 22 | 316,057 | 0.7 |
| Northeast LP | 7 | 206,460 | 0.3 |
| West Central | 64 | 1,645,864 | 0.4 |
| East Central | 18 | 552,121 | 0.3 |
| East | 18 | 842,519 | 0.2 |
| South Central | 13 | 473,177 | 0.3 |
| Southwest | 57 | 781,375 | 0.7 |
| Southeast | 100 | 1,019,869 | 1.0 |
| Detroit Metro | 185 | 3,896,696 | 0.5 |
*Population data are based on 2023 census data
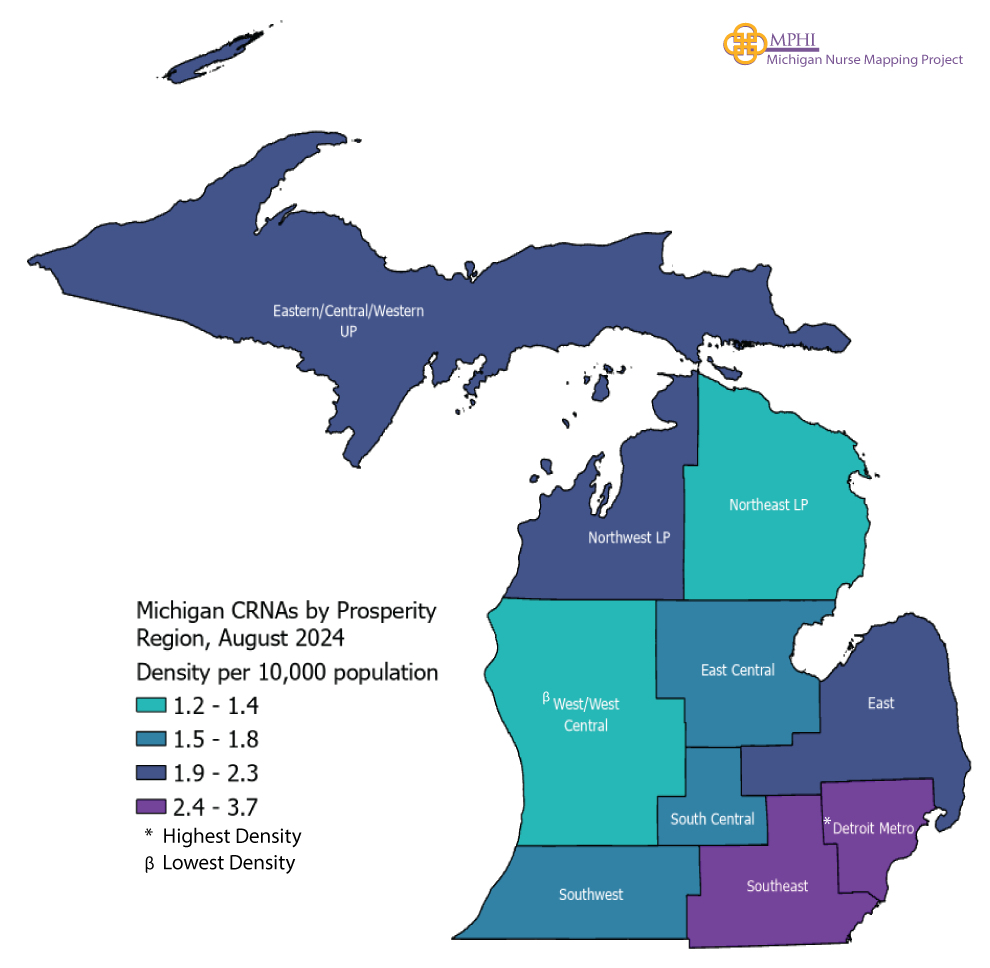
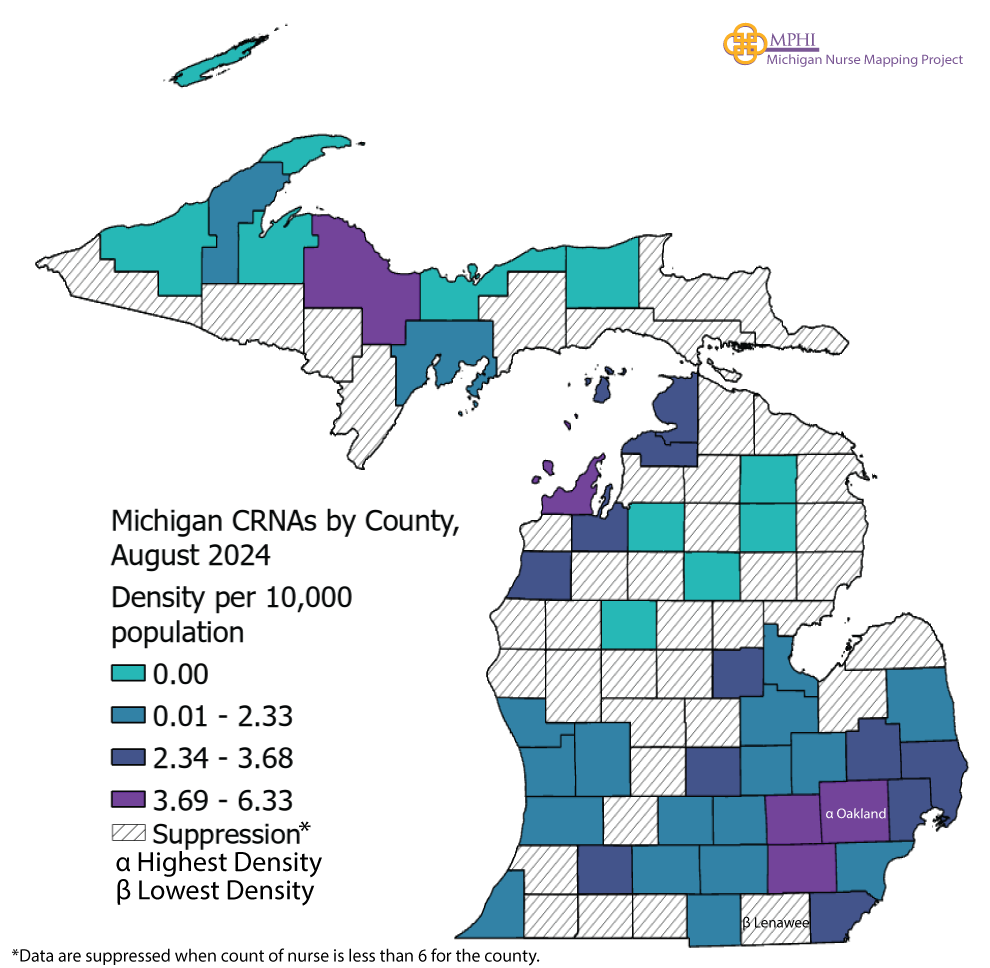
Michigan Certified Registered Nurse Anesthetists (CRNAs)
| Region | # of Nurses | Population* | Nurses per 10,000 |
|---|---|---|---|
| Michigan* | 3,147 | 10,037,261 | 3.1 |
| Eastern/Central/Western UP | 62 | 303,123 | 2.0 |
| Northwest LP | 75 | 316,057 | 2.4 |
| Northeast LP | 30 | 206,460 | 1.5 |
| West/West Central | 206 | 1,645,864 | 1.3 |
| East Central | 98 | 552,121 | 1.8 |
| East | 182 | 842,519 | 2.2 |
| South Central | 86 | 473,177 | 1.8 |
| Southwest | 128 | 781,375 | 1.6 |
| Southeast | 357 | 1,019,869 | 3.5 |
| Detroit Metro | 1,438 | 3,896,696 | 3.7 |
*Population data are based on 2023 census data
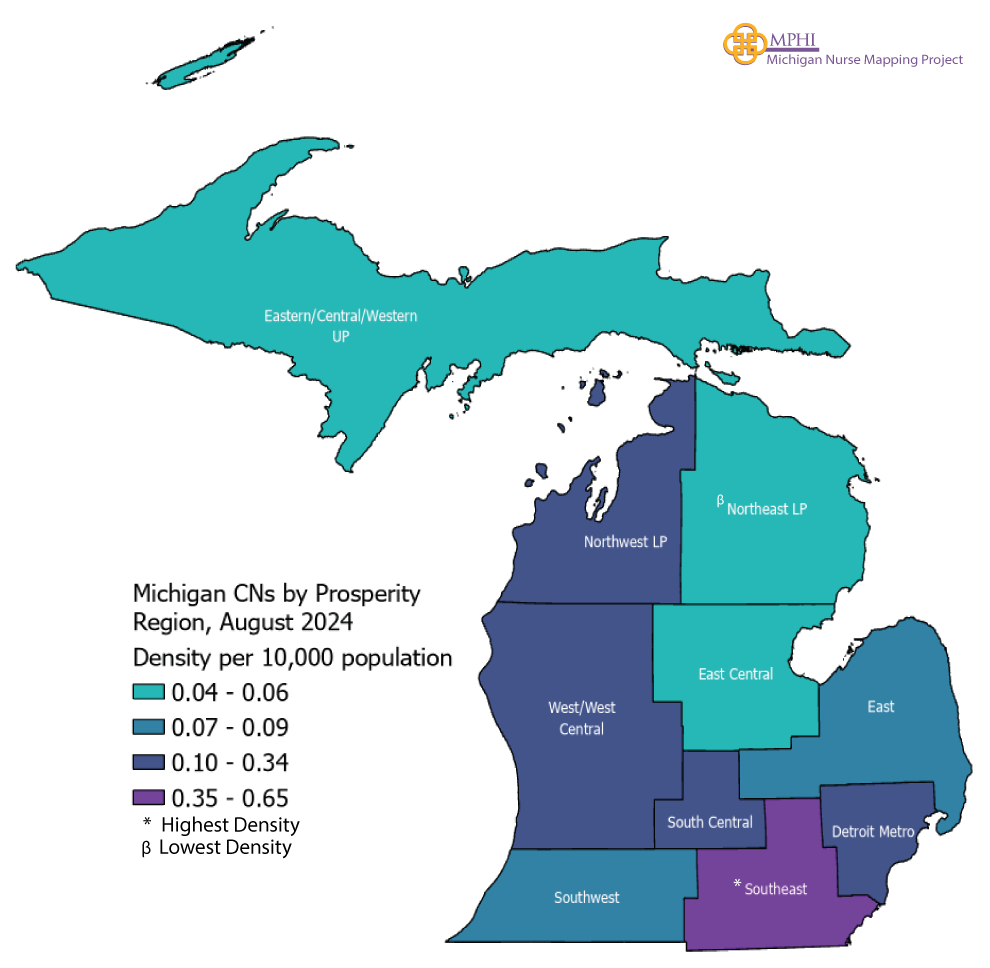
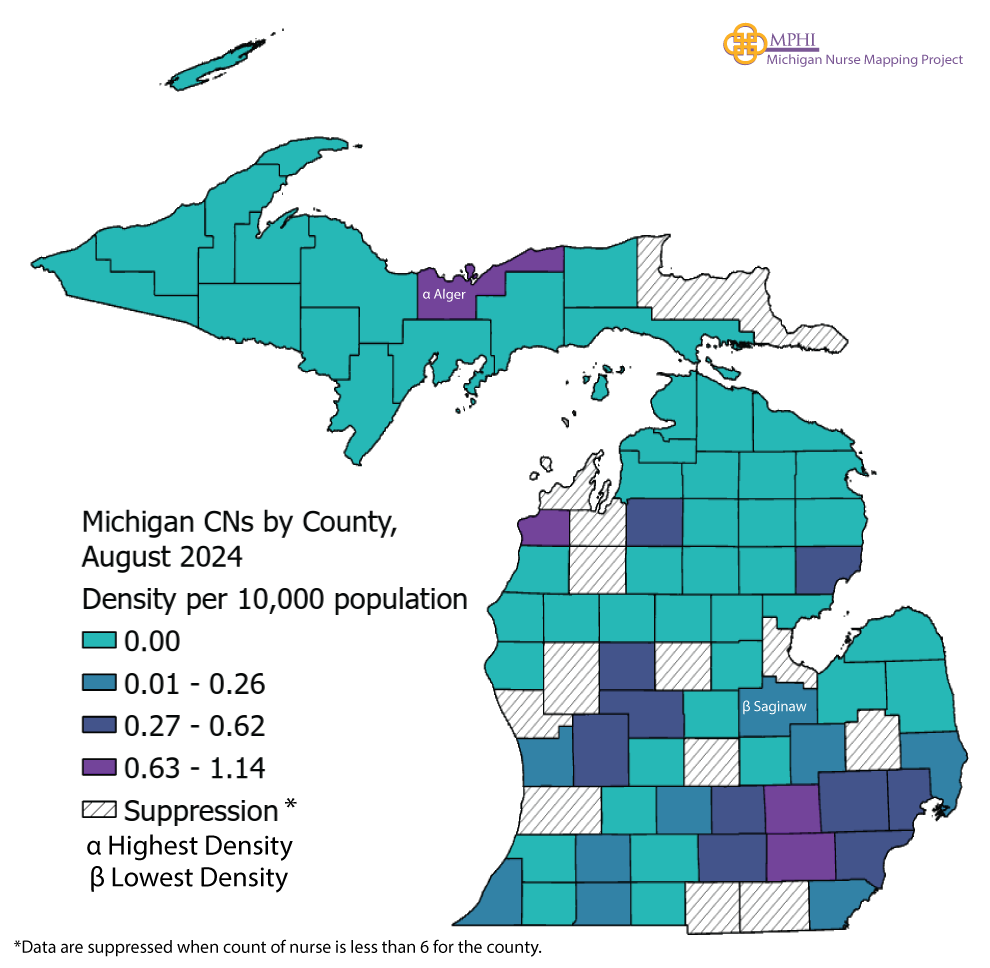
Michigan Certified Clinical Nurse Specialist (CNs)
| Region | Total CNSs | Average Age | Median Age |
|---|---|---|---|
| Michigan | 325 | 51.0 | 49.5 |
| Eastern/ Central/ Western UP | * | * | * |
| Northwest LP | 9 | 53.4 | 60.0 |
| Northeast LP | * | * | * |
| West/West Central | 56 | 47.9 | 46.0 |
| East Central | * | * | * |
| East | 8 | 58.8 | 58.0 |
| South Central | 14 | 47.5 | 43.0 |
| Southwest | 7 | 58.7 | 63.0 |
| Southeast | 66 | 52.0 | 51.0 |
| Detroit Metro | 128 | 50.2 | 49.0 |
| Outside Michigan | 25 | 54.2 | 54.0 |
*Population data are based on 2023 census data
*Cells with less than 6 nurses were censored


Age Distribution
Statewide
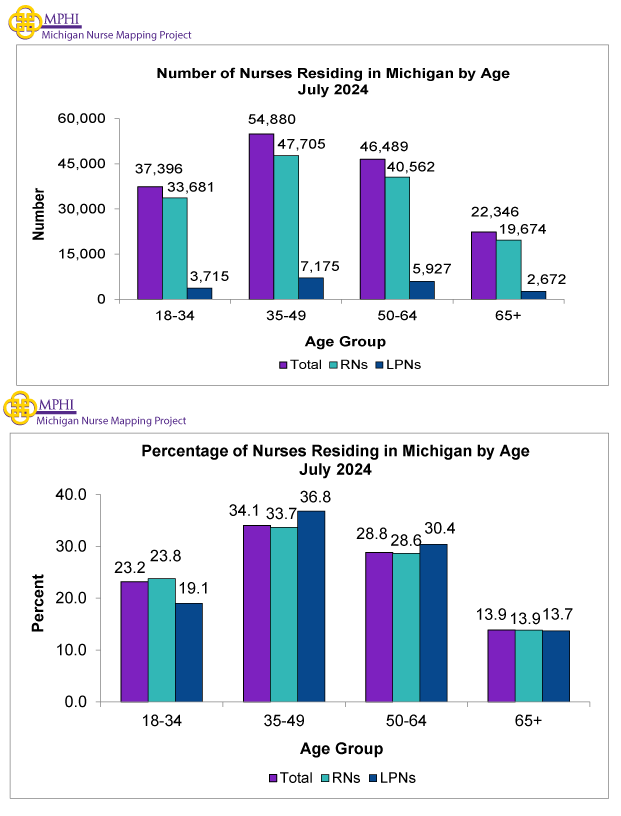
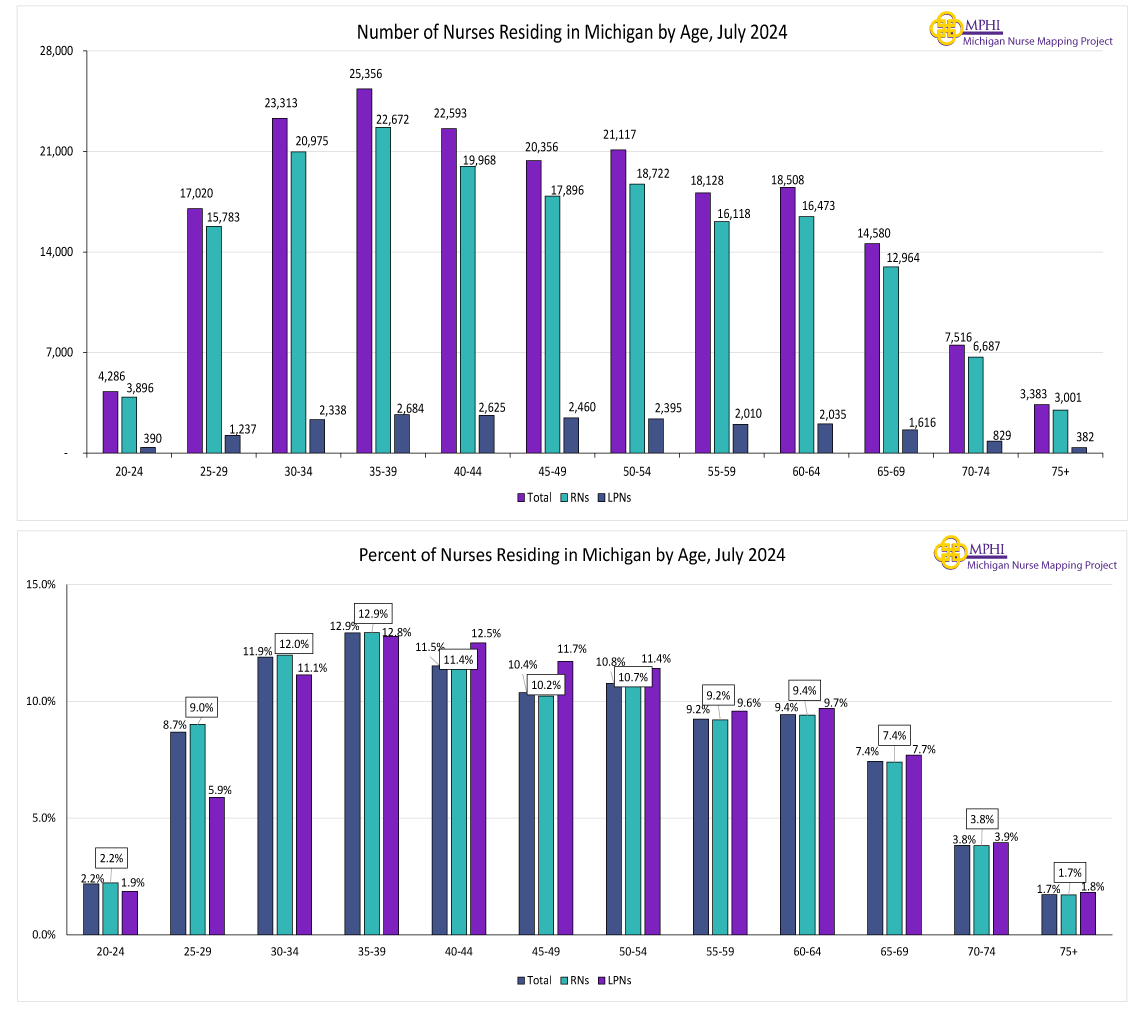
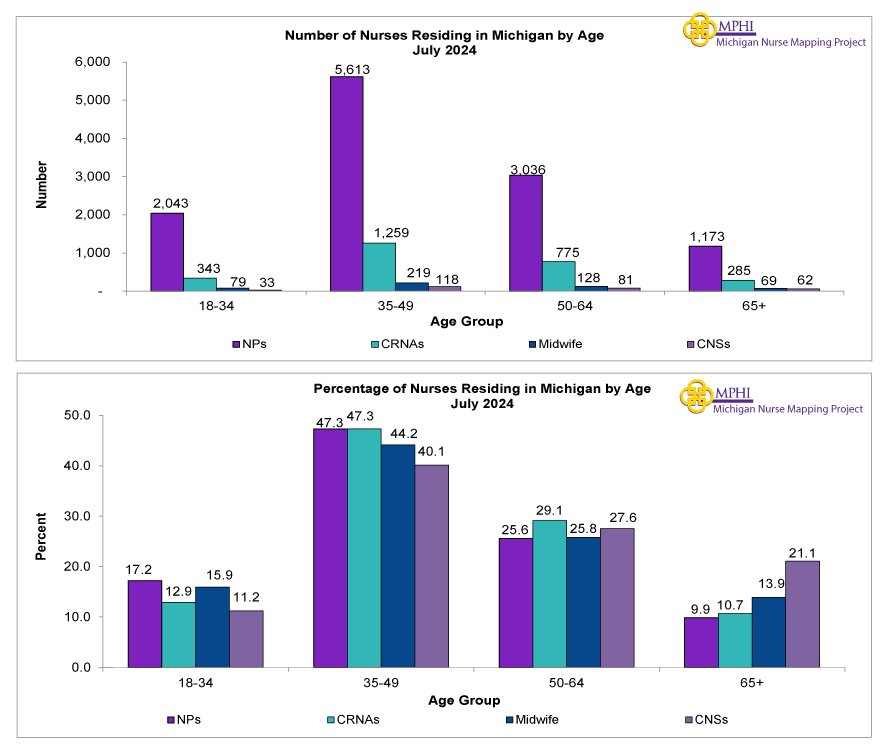
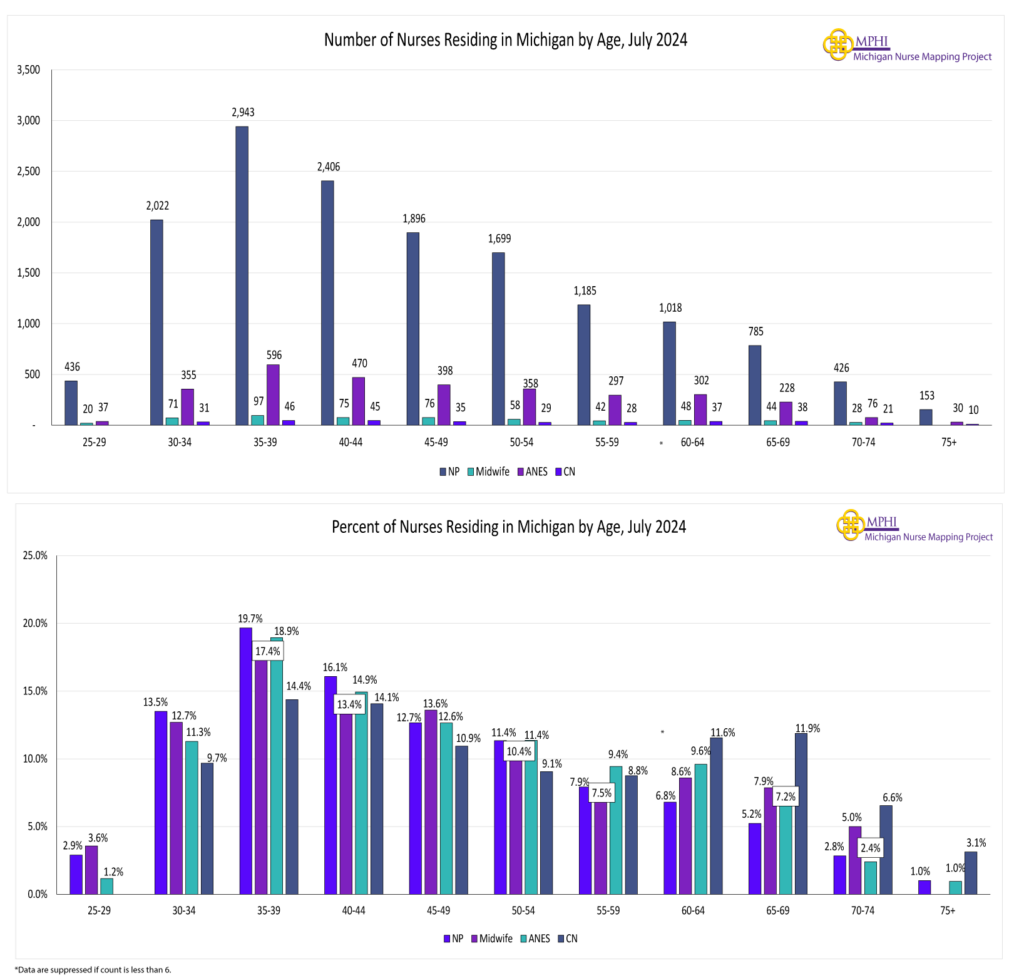
Age Distribution of Michigan Licensed Nurses Residing in Michigan
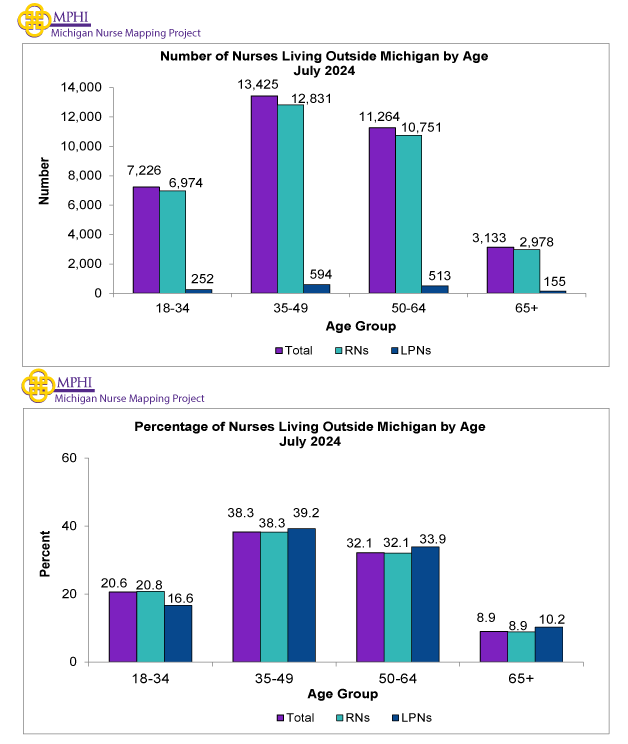
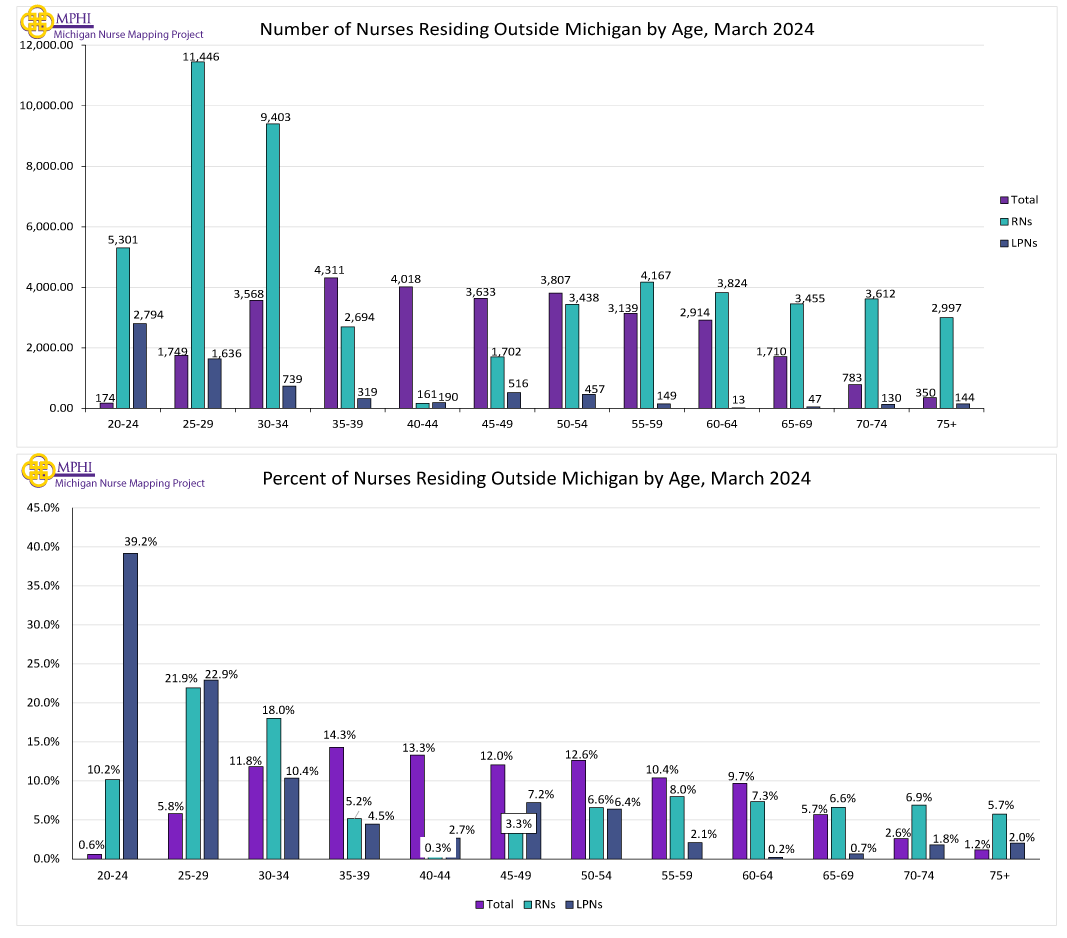
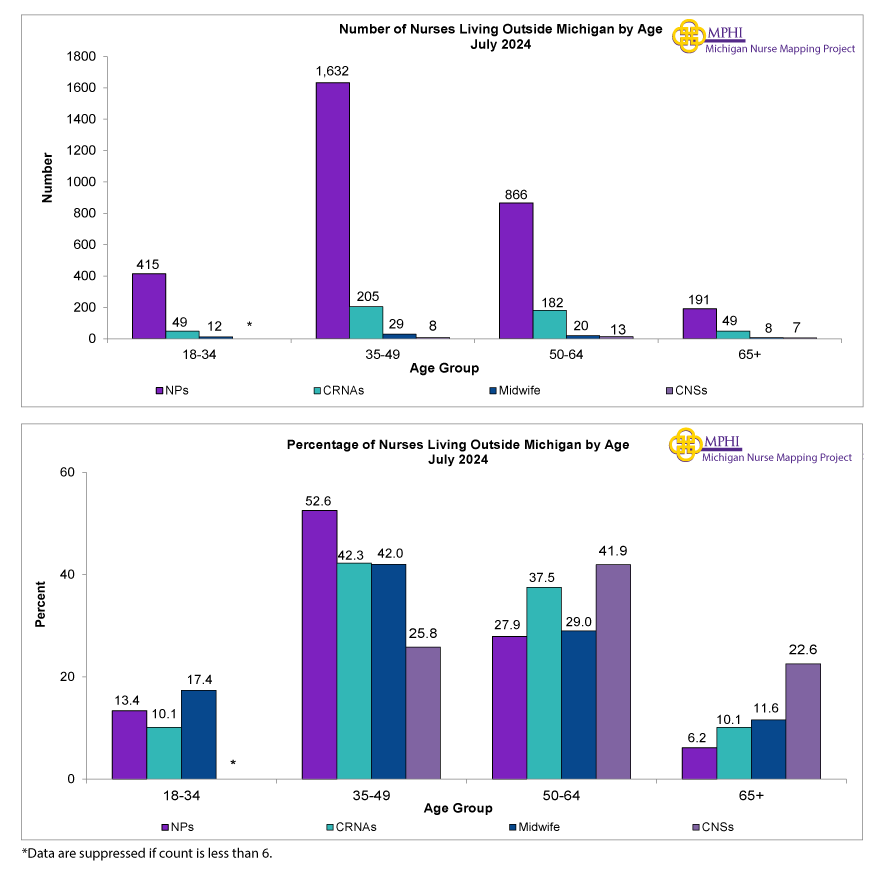
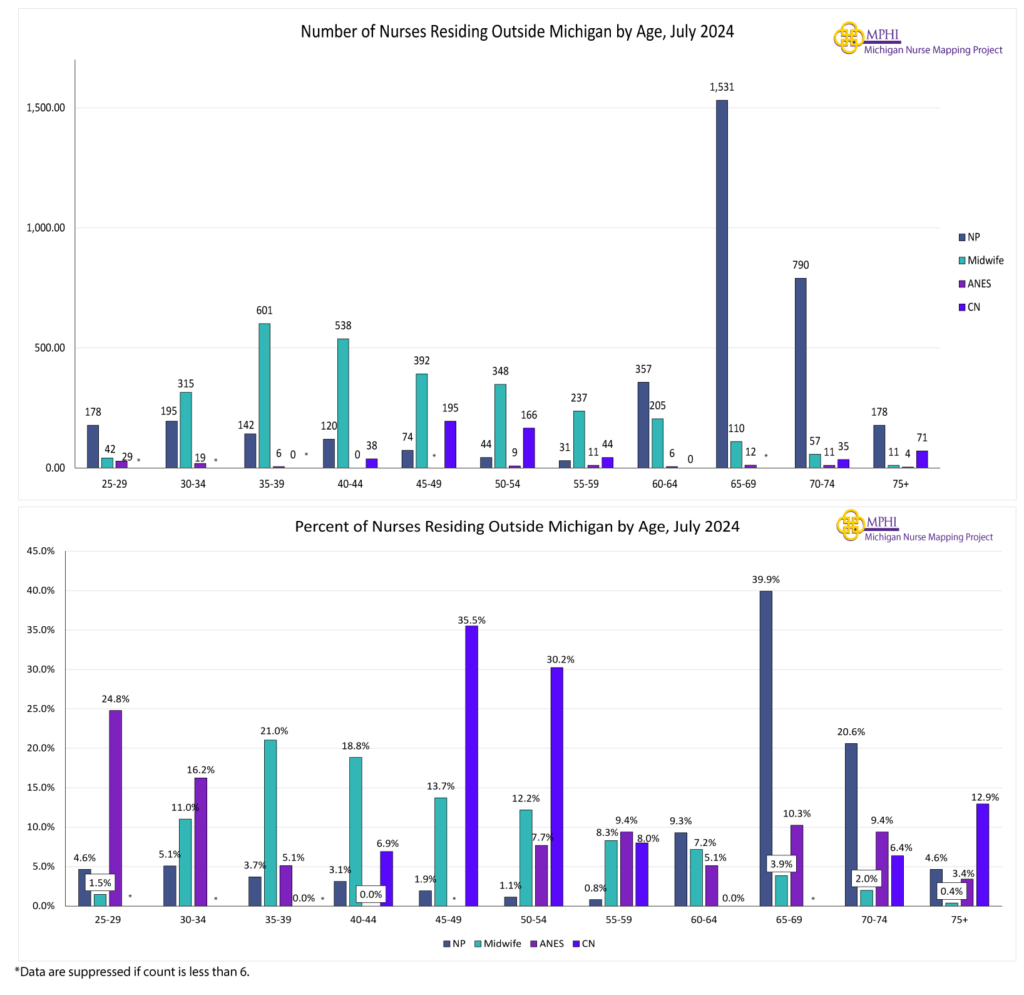
Age Distribution of Michigan Licensed Nurses Residing Outside ofMichigan
County
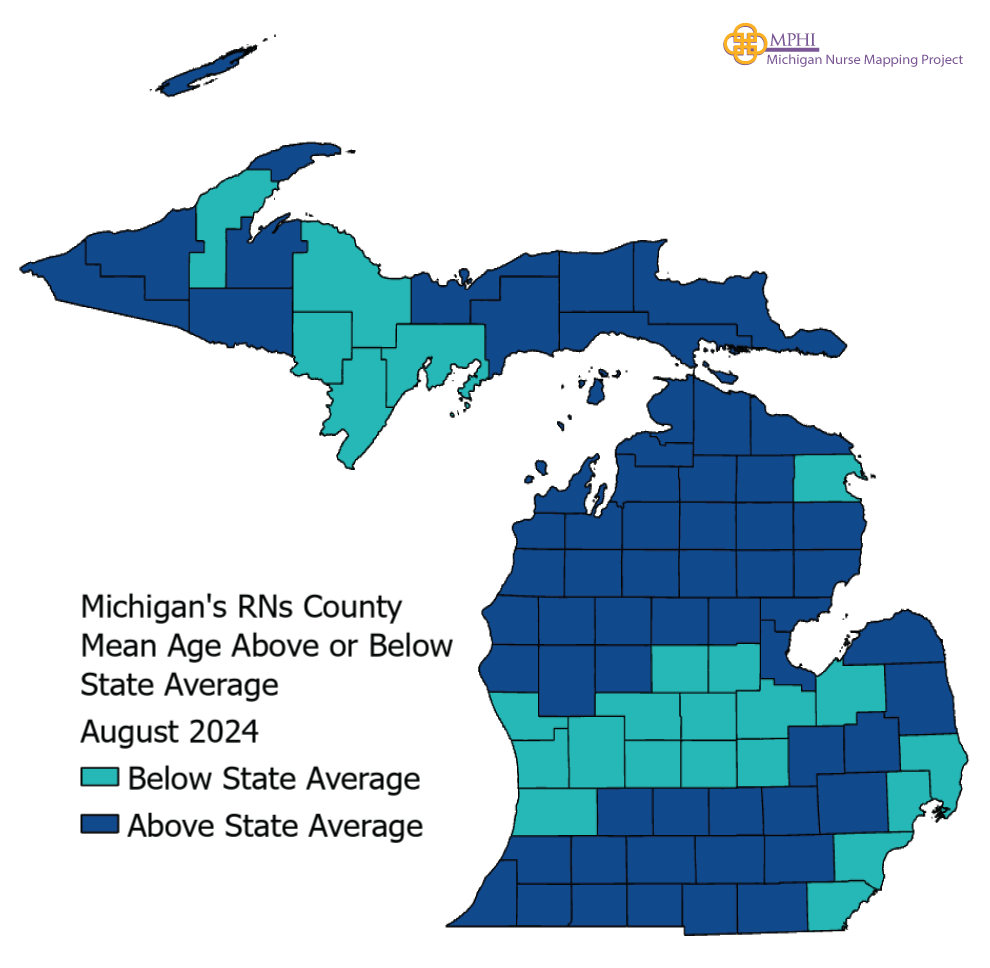
Michigan Licensed RNs Mean Age by County
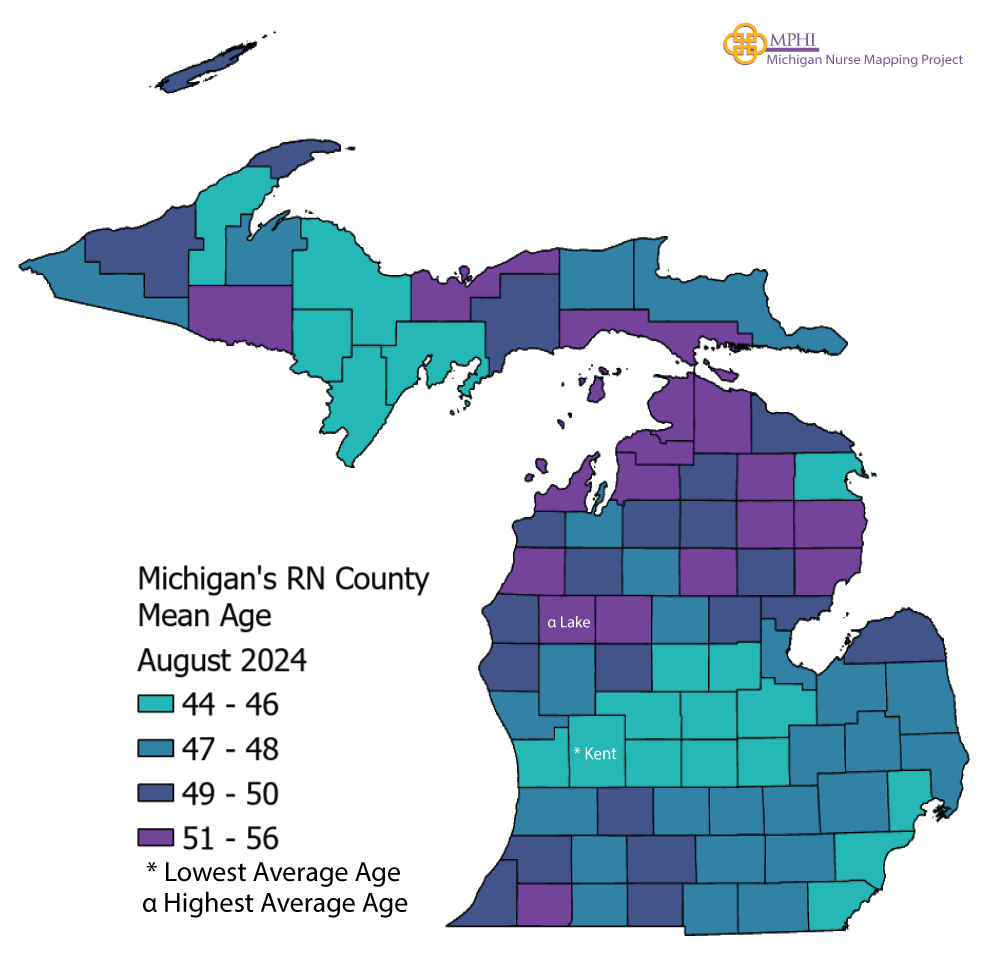
| Region & County | Total RNs | Average Age | Median Age | |
|---|---|---|---|---|
| Michigan | 175,187 | 47.0 | 46.0 | |
| Eastern/ Central/ Western UP | 4,206 | 46.7 | 46.0 | |
| Alger | 102 | 50.7 | 53.0 | |
| Baraga | 99 | 47.8 | 50.0 | |
| Chippewa | 406 | 47.2 | 46.0 | |
| Delta | 515 | 46.3 | 45.0 | |
| Dickinson | 390 | 46.1 | 44.0 | |
| Gogebic | 171 | 48.2 | 49.0 | |
| Houghton | 600 | 45.6 | 44.5 | |
| Iron | 133 | 50.6 | 50.0 | |
| Keweenaw | 46 | 48.6 | 49.0 | |
| Luce | 57 | 47.5 | 44.0 | |
| Mackinac | 141 | 50.8 | 52.0 | |
| Marquette | 1,201 | 45.7 | 44.0 | |
| Menominee | 178 | 46.1 | 44.5 | |
| Ontonagon | 69 | 48.4 | 50.0 | |
| Schoolcraft | 98 | 48.8 | 48.0 | |
| Northwest LP | 5,124 | 49.4 | 49.0 | |
| Antrim | 267 | 53.6 | 55.0 | |
| Benzie | 299 | 50.3 | 50.0 | |
| Charlevoix | 424 | 51.2 | 52.0 | |
| Emmet | 671 | 50.5 | 52.0 | |
| Grand Traverse | 2,032 | 47.6 | 46.0 | |
| Kalkaska | 176 | 48.4 | 49.0 | |
| Leelanau | 419 | 52.0 | 53.0 | |
| Manistee | 285 | 50.8 | 52.0 | |
| Missaukee | 171 | 47.1 | 46.0 | |
| Wexford | 380 | 48.6 | 48.0 | |
| Northeast LP | 2,688 | 50.0 | 50.0 | |
| Alcona | 115 | 52.4 | 54.0 | |
| Alpena | 478 | 46.5 | 44.0 | |
| Cheboygan | 334 | 51.6 | 54.0 | |
| Crawford | 169 | 48.9 | 48.0 | |
| Iosco | 270 | 52.2 | 54.0 | |
| Montmorency | 107 | 51.5 | 52.0 | |
| Ogemaw | 324 | 48.9 | 50.0 | |
| Oscoda | 75 | 51.0 | 53.0 | |
| Otsego | 365 | 48.5 | 48.0 | |
| Presque Isle | 172 | 50.2 | 52.5 | |
| Roscommon | 279 | 53.6 | 52.0 | |
| West/West Central | 21,711 | 45.7 | 43.0 | |
| Allegan | 1,413 | 46.9 | 45.0 | |
| Barry | 876 | 49.3 | 48.0 | |
| Ionia | 607 | 45.0 | 43.0 | |
| Kent | 9,793 | 44.2 | 41.0 | |
| Lake | 73 | 56.5 | 58.0 | |
| Mason | 461 | 49.3 | 51.0 | |
| Mecosta | 395 | 48.8 | 48.0 | |
| Montcalm | 772 | 46.3 | 45.0 | |
| Muskegon | 1,946 | 47.0 | 46.0 | |
| Newaygo | 481 | 48.1 | 47.0 | |
| Oceana | 252 | 50.1 | 50.5 | |
| Osceola | 237 | 50.9 | 45.0 | |
| Ottawa | 4,405 | 45.6 | 43.0 | |
| East Central | 8,171 | 46.7 | 46.0 | |
| Arenac | 219 | 48.9 | 47.0 | |
| Bay | 1,890 | 47.7 | 47.0 | |
| Clare | 336 | 47.8 | 47.0 | |
| Gladwin | 382 | 48.7 | 49.0 | |
| Gratiot | 482 | 45.8 | 45.0 | |
| Isabella | 633 | 46.2 | 45.0 | |
| Midland | 1,419 | 45.8 | 44.0 | |
| Saginaw | 2,810 | 46.3 | 45.0 | |
| East | 12,489 | 47.3 | 46.0 | |
| Genesee | 6,085 | 47.3 | 47.0 | |
| Huron | 362 | 48.6 | 48.0 | |
| Lapeer | 1,452 | 47.7 | 47.0 | |
| Saint Clair | 2,531 | 47.0 | 46.0 | |
| Sanilac | 453 | 47.8 | 46.0 | |
| Shiawassee | 931 | 46.7 | 46.0 | |
| Tuscola | 675 | 46.9 | 46.0 | |
| South Central | 5,631 | 46.7 | 45.0 | |
| Clinton | 1,399 | 45.6 | 43.0 | |
| Eaton | 1,322 | 47.1 | 46.0 | |
| Ingham | 2,910 | 47.1 | 45.0 | |
| Southwest | 9,823 | 48.3 | 48.0 | |
| Berrien | 1,808 | 49.0 | 49.0 | |
| Branch | 396 | 48.5 | 47.5 | |
| Calhoun | 1,592 | 48.5 | 48.0 | |
| Cass | 415 | 51.4 | 50.0 | |
| Kalamazoo | 3,985 | 47.2 | 46.0 | |
| Saint Joseph | 606 | 47.9 | 47.0 | |
| Van Buren | 1,021 | 50.1 | 50.0 | |
| Southeast | 17,386 | 47.5 | 46.0 | |
| Hillsdale | 480 | 48.2 | 49.0 | |
| Jackson | 2,236 | 48.0 | 48.0 | |
| Lenawee | 1,325 | 48.0 | 48.0 | |
| Livingston | 4,337 | 47.2 | 46.0 | |
| Monroe | 2,490 | 45.7 | 45.0 | |
| Washtenaw | 6,518 | 47.9 | 46.0 | |
| Detroit Metro | 54,417 | 47.0 | 45.0 | |
| Macomb | 13,340 | 46.4 | 45.0 | |
| Oakland | 20,114 | 47.8 | 47.0 | |
| Wayne | 20,963 | 46.7 | 45.0 | |
| Outside Michigan | 28,849 | 47.2 | 46.0 | |
| *Includes nurses who live outside of Michigan *Population data are based on 2023 census data |
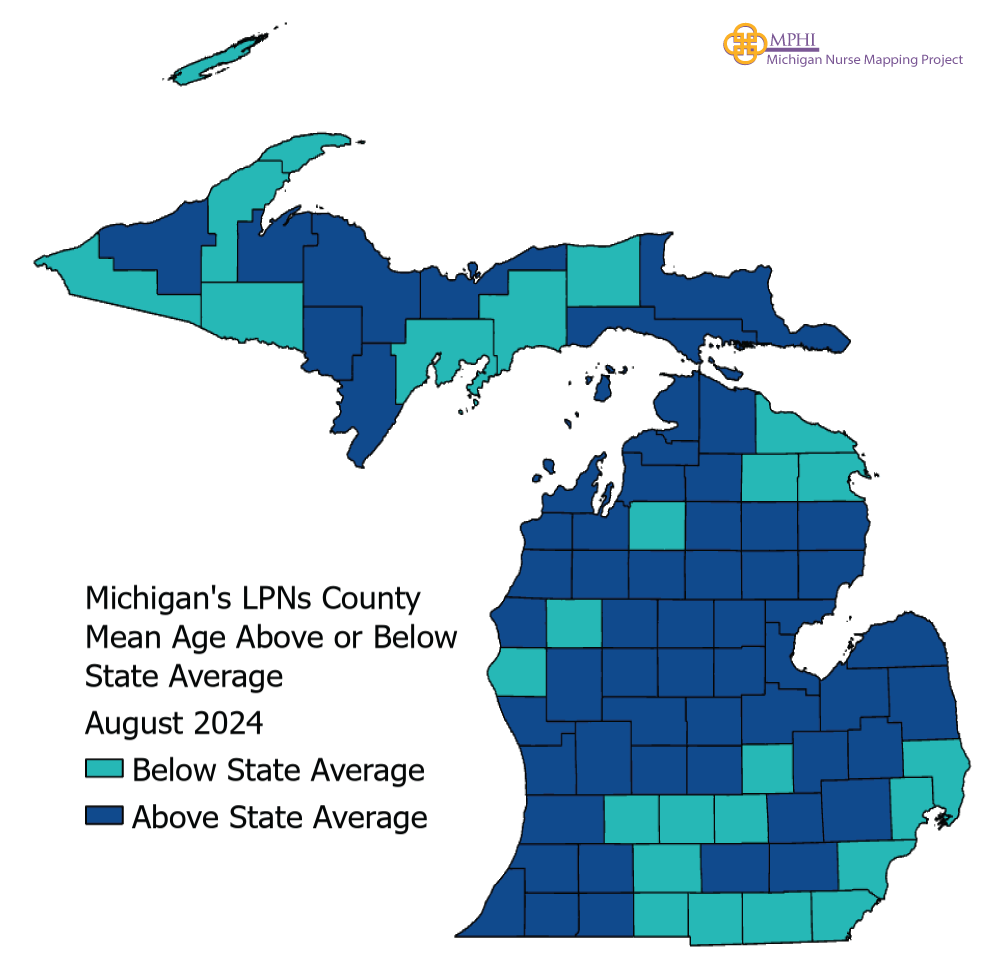
Michigan Licensed LPNs Mean Age by County

| Region | County | Total LPNs | Average Age | Median Age |
|---|---|---|---|---|
| Michigan | 21,011 | 48.3 | 47.0 | |
| Eastern/ Central/ Western UP | 1,138 | 49.3 | 48.0 | |
| Alger | 30 | 53.3 | 57.5 | |
| Baraga | 25 | 51.3 | 53.0 | |
| Chippewa | 97 | 50.0 | 50.0 | |
| Delta | 111 | 47.2 | 46.0 | |
| Dickinson | 113 | 50.8 | 52.0 | |
| Gogebic | 55 | 45.1 | 43.0 | |
| Houghton | 96 | 42.1 | 40.0 | |
| Iron | 38 | 46.8 | 44.5 | |
| Keweenaw | 6 | 40.0 | 36.0 | |
| Luce | 20 | 47.3 | 46.5 | |
| Mackinac | 28 | 90.3 | 58.0 | |
| Marquette | 393 | 48.9 | 48.0 | |
| Menominee | 69 | 49.9 | 49.0 | |
| Ontonagon | 15 | 49.5 | 46.0 | |
| Schoolcraft | 42 | 48.1 | 49.5 | |
| Northwest LP | 456 | 51.6 | 55.0 | |
| Antrim | 43 | 51.4 | 56.0 | |
| Benzie | 32 | 54.8 | 60.0 | |
| Charlevoix | 27 | 53.7 | 56.0 | |
| Emmet | 25 | 57.5 | 63.0 | |
| Grand Traverse | 164 | 49.3 | 48.5 | |
| Kalkaska | 36 | 46.6 | 48.0 | |
| Leelanau | 19 | 53.1 | 56.0 | |
| Manistee | 35 | 49.3 | 49.0 | |
| Missaukee | 30 | 57.6 | 61.5 | |
| Wexford | 45 | 54.1 | 58.0 | |
| Northeast LP | 539 | 50.0 | 51.0 | |
| Alcona | 23 | 54.3 | 55.0 | |
| Alpena | 122 | 46.8 | 46.5 | |
| Cheboygan | 30 | 56.6 | 56.5 | |
| Crawford | 44 | 55.5 | 57.0 | |
| Iosco | 79 | 48.8 | 50.0 | |
| Montmorency | 19 | 46.7 | 49.0 | |
| Ogemaw | 64 | 52.1 | 52.0 | |
| Oscoda | 19 | 51.2 | 49.0 | |
| Otsego | 54 | 48.5 | 47.5 | |
| Presque Isle | 28 | 47.1 | 44.5 | |
| Roscommon | 57 | 50.5 | 49.0 | |
| West/West Central | 2,777 | 50.5 | 50.0 | |
| Allegan | 191 | 49.5 | 49.0 | |
| Barry | 128 | 47.5 | 47.0 | |
| Ionia | 98 | 59.3 | 47.0 | |
| Kent | 1,153 | 50.0 | 50.0 | |
| Lake | 9 | 47.1 | 46.0 | |
| Mason | 56 | 49.9 | 49.5 | |
| Mecosta | 35 | 52.9 | 49.0 | |
| Montcalm | 156 | 51.4 | 52.0 | |
| Muskegon | 346 | 50.1 | 49.0 | |
| Newaygo | 77 | 50.7 | 54.0 | |
| Oceana | 45 | 45.9 | 46.0 | |
| Osceola | 33 | 54.3 | 60.0 | |
| Ottawa | 450 | 51.2 | 51.0 | |
| East Central | 1,155 | 51.3 | 52.0 | |
| Arenac | 50 | 51.0 | 52.0 | |
| Bay | 267 | 52.0 | 53.0 | |
| Clare | 60 | 51.8 | 51.0 | |
| Gladwin | 58 | 54.4 | 55.0 | |
| Gratiot | 82 | 51.9 | 53.0 | |
| Isabella | 90 | 54.7 | 55.0 | |
| Midland | 128 | 53.2 | 54.0 | |
| Saginaw | 420 | 49.0 | 48.5 | |
| East | 1,863 | 49.4 | 49.0 | |
| Genesee | 706 | 50.4 | 48.5 | |
| Huron | 132 | 52.3 | 54.0 | |
| Lapeer | 145 | 51.3 | 52.0 | |
| Saint Clair | 509 | 46.6 | 46.0 | |
| Sanilac | 135 | 49.3 | 50.0 | |
| Shiawassee | 69 | 47.9 | 48.0 | |
| Tuscola | 167 | 50.8 | 51.0 | |
| South Central | 590 | 46.6 | 45.0 | |
| Clinton | 79 | 48.5 | 48.0 | |
| Eaton | 182 | 45.6 | 43.0 | |
| Ingham | 329 | 46.6 | 45.0 | |
| Southwest | 1,309 | 48.5 | 48.0 | |
| Berrien | 203 | 53.0 | 53.0 | |
| Branch | 113 | 44.7 | 43.0 | |
| Calhoun | 350 | 45.2 | 45.0 | |
| Cass | 41 | 50.6 | 48.0 | |
| Kalamazoo | 391 | 48.7 | 47.0 | |
| Saint Joseph | 132 | 50.5 | 49.0 | |
| Van Buren | 79 | 51.6 | 53.0 | |
| Southeast | 1,882 | 47.6 | 47.0 | |
| Hillsdale | 112 | 48.0 | 49.0 | |
| Jackson | 374 | 50.5 | 51.0 | |
| Lenawee | 287 | 45.0 | 44.0 | |
| Livingston | 219 | 49.9 | 51.0 | |
| Monroe | 608 | 45.6 | 44.0 | |
| Washtenaw | 282 | 48.8 | 47.0 | |
| Detroit Metro | 7,788 | 46.5 | 44.0 | |
| Macomb | 1,675 | 46.0 | 43.0 | |
| Oakland | 1,609 | 50.3 | 48.0 | |
| Wayne | 4,504 | 45.4 | 43.0 | |
| Outside Michigan | 1,312 | 48.6 | 48.0 | |
| *Includes nurses who live outside of Michigan *Population data are based on 2023 census data |
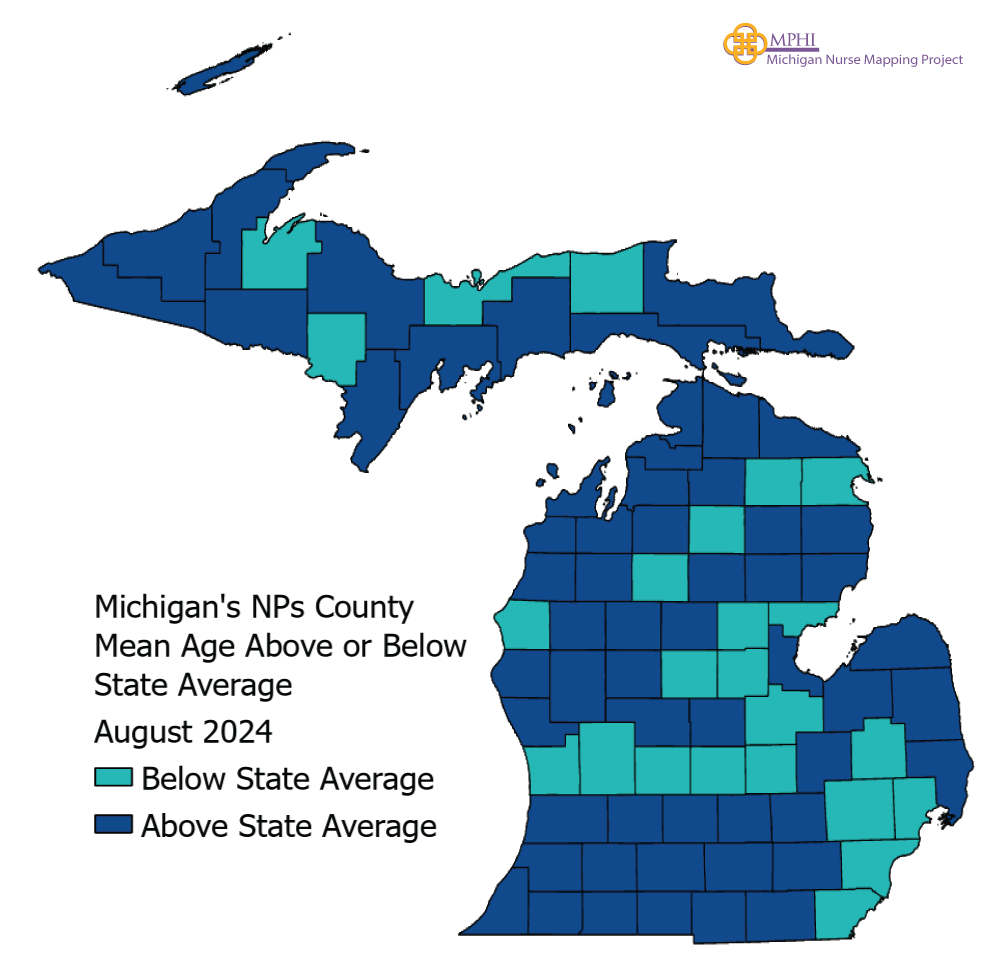
Michigan Licensed NPs Mean Age by County
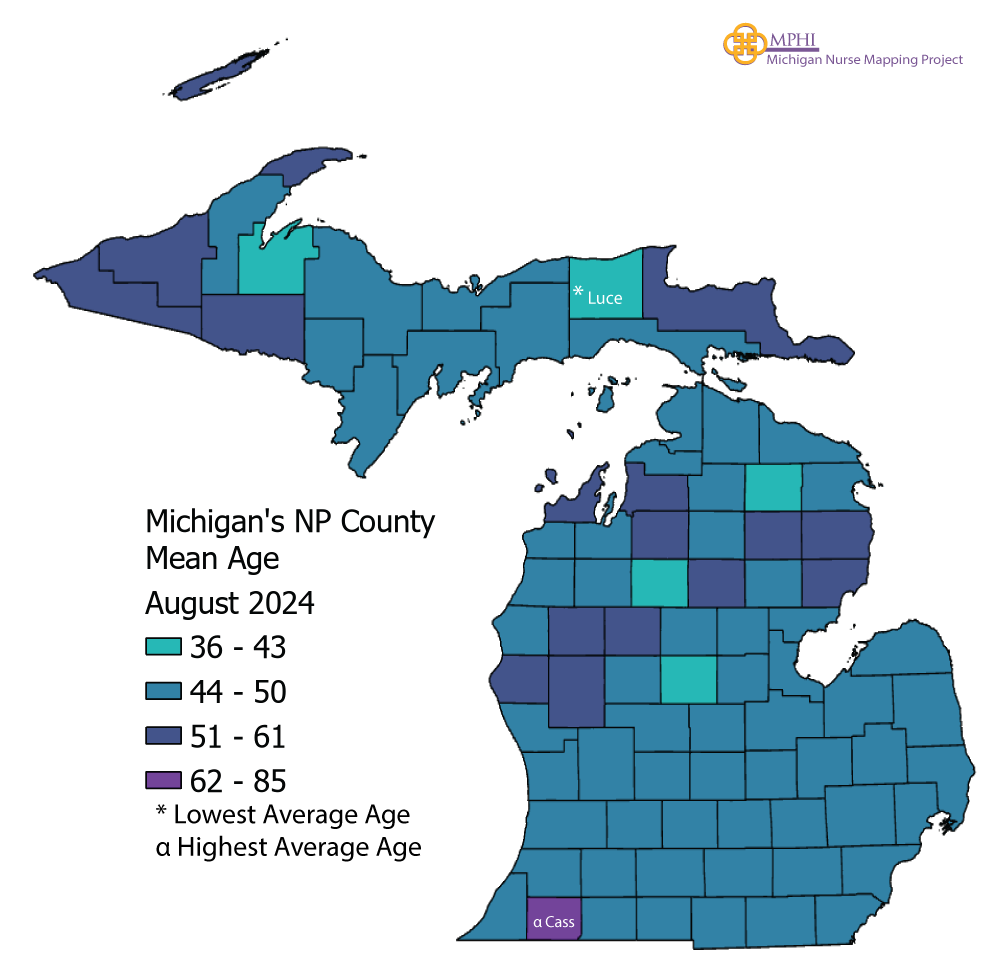
| Region & County | Total NPs | Average Age | Median Age | |
|---|---|---|---|---|
| Michigan | 14,972 | 46.3 | 44.0 | |
| Eastern/ Central/ Western UP | 360 | 48.1 | 47.0 | |
| Alger | 8 | 47.9 | 50.5 | |
| Baraga | * | 38.0 | 38.0 | |
| Chippewa | 42 | 50.6 | 48.0 | |
| Delta | 34 | 46.9 | 44.5 | |
| Dickinson | 32 | 45.7 | 43.0 | |
| Gogebic | 13 | 52.4 | 52.0 | |
| Houghton | 29 | 47.6 | 45.0 | |
| Iron | 14 | 56.9 | 56.5 | |
| Keweenaw | * | 61.0 | 60.0 | |
| Luce | * | 36.6 | 34.0 | |
| Mackinac | 14 | 50.0 | 49.0 | |
| Marquette | 134 | 46.6 | 44.0 | |
| Menominee | 14 | 47.8 | 47.0 | |
| Ontonagon | * | 54.6 | * | |
| Schoolcraft | 11 | 49.9 | 50.0 | |
| Northwest LP | 443 | 49.6 | 47.0 | |
| Antrim | 15 | 61.7 | 62.0 | |
| Benzie | 23 | 49.4 | 46.0 | |
| Charlevoix | 27 | 48.6 | 48.0 | |
| Emmet | 64 | 49.2 | 47.5 | |
| Grand Traverse | 204 | 48.6 | 45.0 | |
| Kalkaska | 12 | 52.6 | 52.0 | |
| Leelanau | 41 | 51.8 | 52.0 | |
| Manistee | 18 | 50.2 | 49.0 | |
| Missaukee | 9 | 42.4 | 42.0 | |
| Wexford | 30 | 50.2 | 51.5 | |
| Northeast LP | 218 | 48.6 | 46.0 | |
| Alcona | 10 | 54.0 | 56.5 | |
| Alpena | 47 | 47.1 | 44.0 | |
| Cheboygan | 19 | 47.1 | 44.0 | |
| Crawford | 12 | 45.5 | 43.5 | |
| Iosco | 20 | 50.9 | 50.0 | |
| Montmorency | * | 43.0 | * | |
| Ogemaw | 32 | 47.8 | 48.0 | |
| Oscoda | 6 | 55.5 | 55.0 | |
| Otsego | 36 | 47.8 | 45.0 | |
| Presque Isle | 11 | 47.0 | 46.0 | |
| Roscommon | 21 | 52.7 | 53.0 | |
| West/West Central | 1,741 | 45.3 | 42.0 | |
| Allegan | 68 | 48.2 | 43.0 | |
| Barry | 54 | 46.7 | 44.5 | |
| Ionia | 39 | 44.4 | 40.0 | |
| Kent | 983 | 44.0 | 41.0 | |
| Lake | * | 55.3 | * | |
| Mason | 34 | 45.4 | 40.0 | |
| Mecosta | 30 | 48.9 | 46.0 | |
| Montcalm | 47 | 47.7 | 43.0 | |
| Muskegon | 114 | 48.7 | 44.0 | |
| Newaygo | 30 | 51.6 | 55.0 | |
| Oceana | 18 | 51.1 | 52.5 | |
| Osceola | 7 | 52.9 | 52.0 | |
| Ottawa | 313 | 45.6 | 43.0 | |
| East Central | 644 | 45.2 | 42.0 | |
| Arenac | 18 | 43.9 | 40.0 | |
| Bay | 112 | 47.0 | 45.0 | |
| Clare | 9 | 48.2 | 44.0 | |
| Gladwin | 22 | 45.7 | 47.0 | |
| Gratiot | 36 | 47.3 | 47.0 | |
| Isabella | 44 | 42.2 | 39.0 | |
| Midland | 143 | 44.7 | 42.0 | |
| Saginaw | 260 | 44.9 | 43.0 | |
| East | 728 | 46.6 | 45.0 | |
| Genesee | 341 | 46.6 | 45.0 | |
| Huron | 24 | 46.9 | 45.5 | |
| Lapeer | 85 | 46.0 | 43.0 | |
| Saint Clair | 155 | 47.1 | 44.0 | |
| Sanilac | 31 | 46.4 | 46.0 | |
| Shiawassee | 51 | 45.6 | 44.0 | |
| Tuscola | 41 | 46.7 | 47.0 | |
| South Central | 480 | 47.1 | 44.0 | |
| Clinton | 114 | 45.7 | 42.0 | |
| Eaton | 103 | 46.7 | 44.0 | |
| Ingham | 263 | 47.9 | 45.0 | |
| Southwest | 764 | 50.2 | 48.0 | |
| Berrien | 149 | 49.7 | 49.0 | |
| Branch | 27 | 50.2 | 50.0 | |
| Calhoun | 108 | 50.0 | 48.5 | |
| Cass | 27 | 84.9 | 50.0 | |
| Kalamazoo | 341 | 48.2 | 47.0 | |
| Saint Joseph | 43 | 49.4 | 50.0 | |
| Van Buren | 69 | 48.5 | 49.0 | |
| Southeast | 1,553 | 48.4 | 45.0 | |
| Hillsdale | 34 | 46.4 | 46.0 | |
| Jackson | 175 | 48.2 | 47.0 | |
| Lenawee | 83 | 46.6 | 45.0 | |
| Livingston | 327 | 49.3 | 44.0 | |
| Monroe | 182 | 45.8 | 45.0 | |
| Washtenaw | 752 | 49.1 | 46.0 | |
| Detroit Metro | 4,937 | 45.1 | 43.0 | |
| Macomb | 1,088 | 44.4 | 42.0 | |
| Oakland | 2,177 | 45.5 | 43.0 | |
| Wayne | 1,672 | 45.0 | 42.0 | |
| Outside Michigan | 2,856 | 45.9 | 44.0 | |
| *Includes nurses who live outside of Michigan *Population data are based on 2023 census data *Cells with less than 6 nurses were censored |
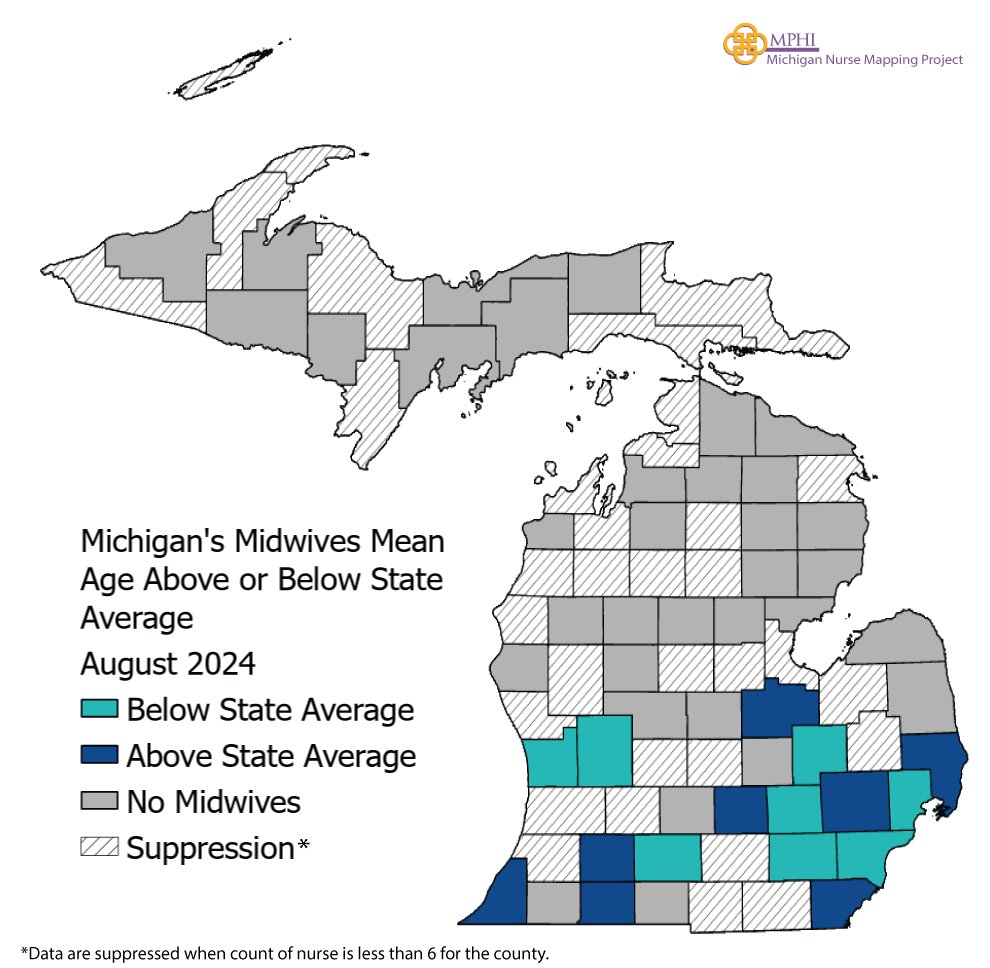
Michigan Licensed Midwives Mean Age by County
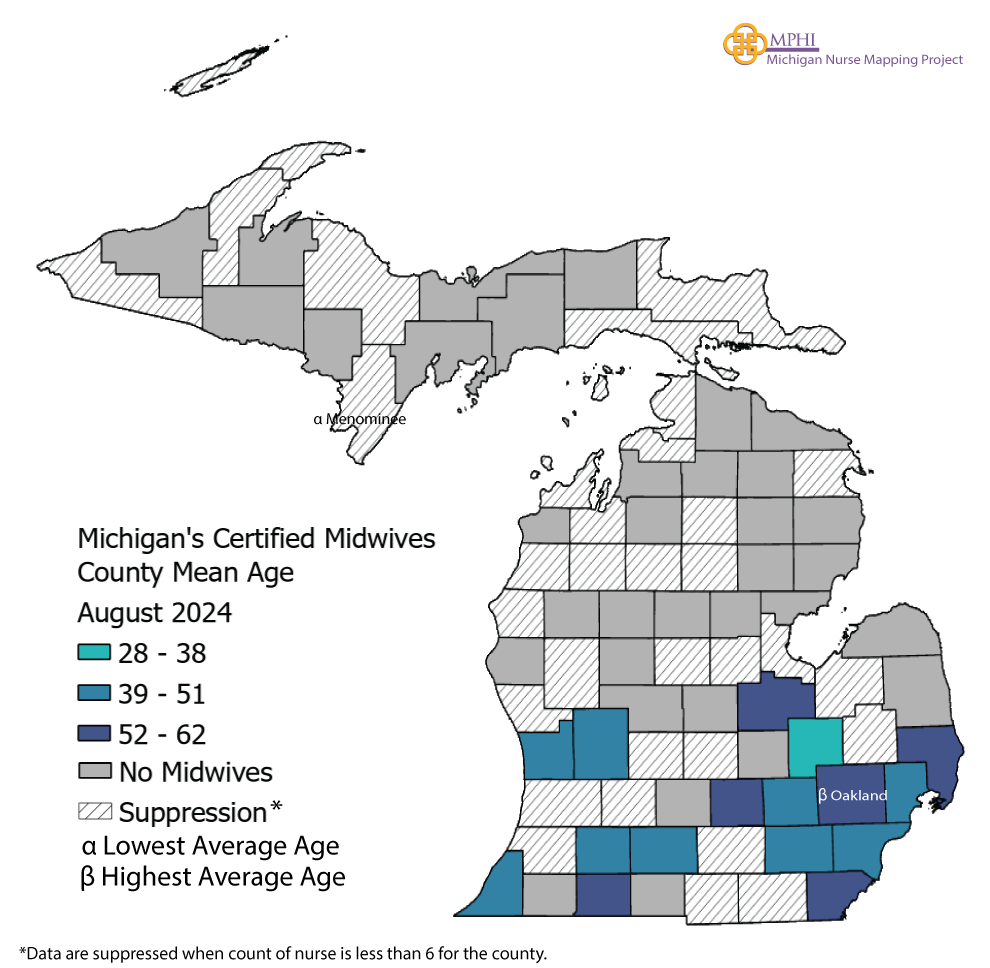
| Region & County | Total Midwives | Average Age | Median Age | |
|---|---|---|---|---|
| Michigan | 565 | 49.5 | 46.0 | |
| Eastern/ Central/ Western UP | 12 | 51.0 | 51.0 | |
| Northwest LP | 22 | 57.8 | 56.5 | |
| Northeast LP | 7 | 60.1 | 63.0 | |
| West/West Central | 64 | 46.0 | 42.0 | |
| East Central | 18 | 47.2 | 46.0 | |
| East | 18 | 45.1 | 42.0 | |
| South Central | 13 | 52.4 | 52.0 | |
| Southwest | 57 | 50.8 | 51.0 | |
| Southeast | 100 | 47.6 | 46.5 | |
| Detroit Metro | 185 | 50.9 | 44.0 | |
| Outside Michigan | 64 | 46.9 | 47.0 |
*Population data are based on 2023 census data
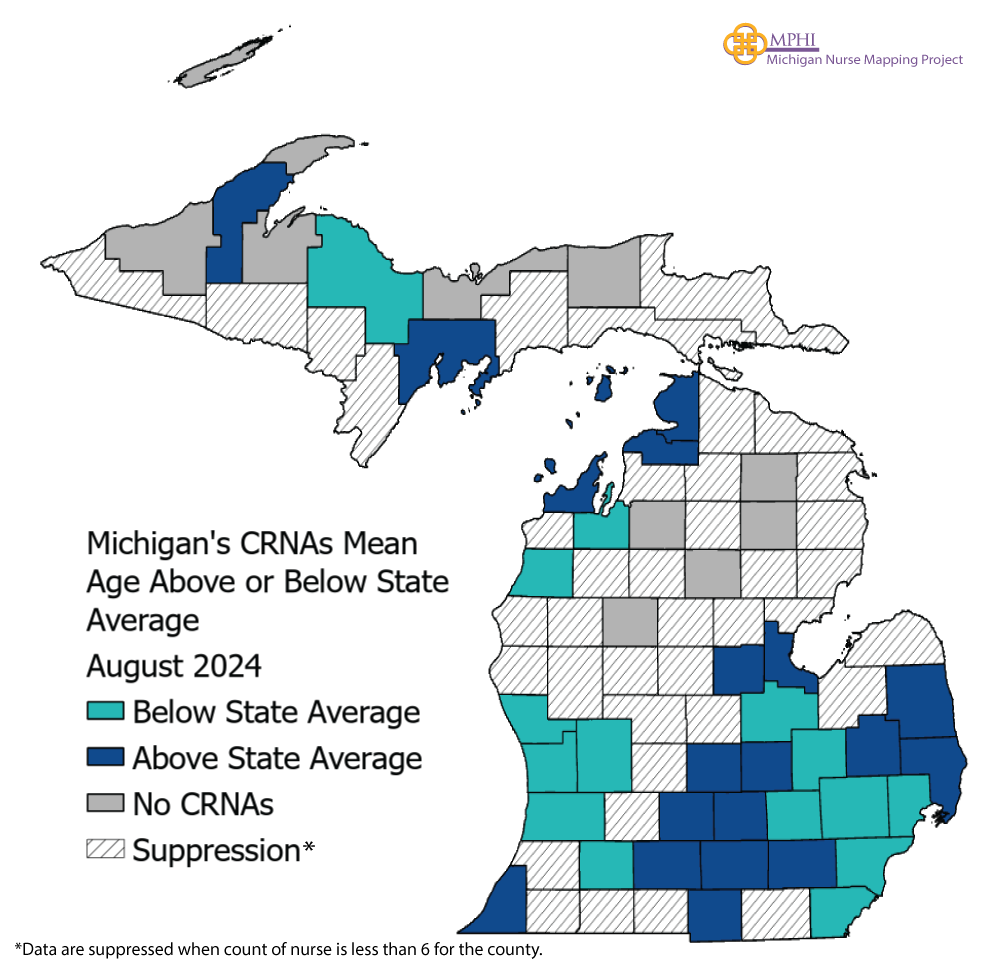
Michigan Certified Registered Nurse Anesthetists Mean Age by County
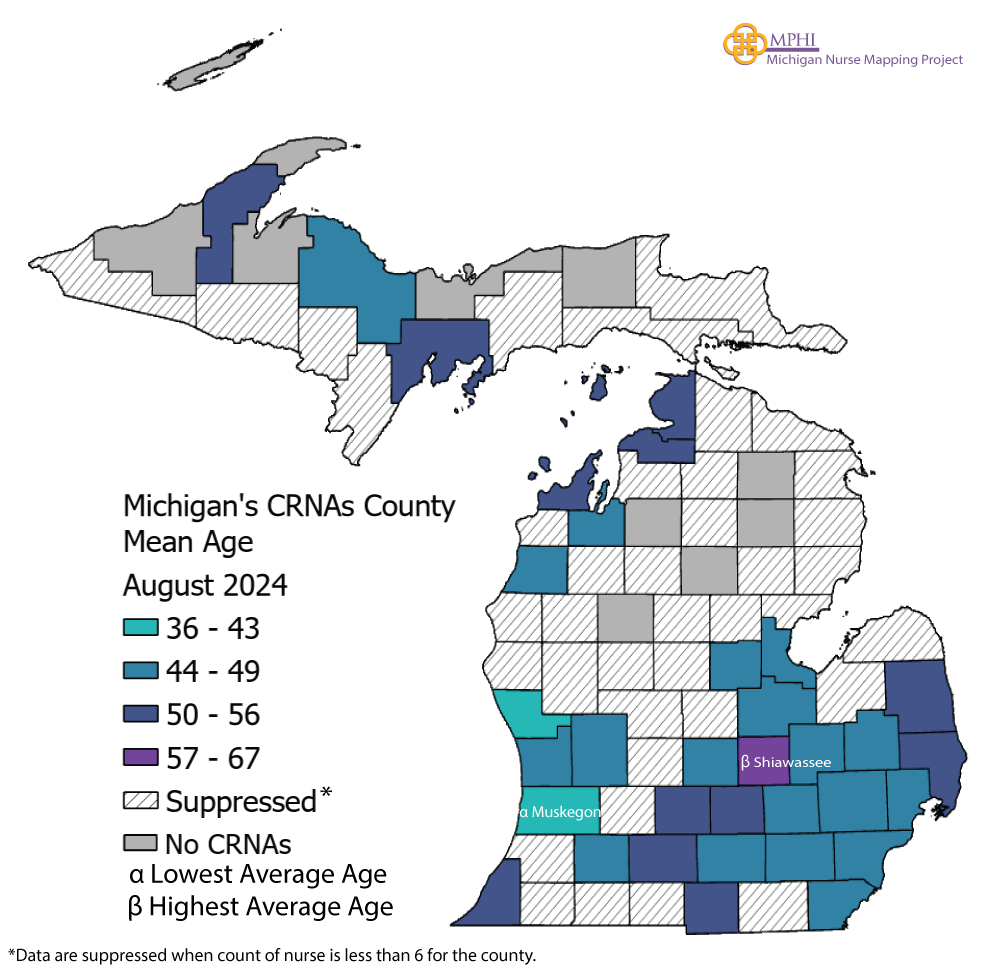
| Region & County | Total CRNAs | Average Age | Median Age |
|---|---|---|---|
| Michigan | 3,147 | 47.7 | 46.0 |
| Eastern/ Central/ Western UP | 62 | 49.6 | 48.0 |
| Northwest LP | 75 | 48.0 | 46.0 |
| Northeast LP | 30 | 56.2 | 60.5 |
| West/West Central | 206 | 45.6 | 42.0 |
| East Central | 98 | 48.4 | 46.0 |
| East | 182 | 48.6 | 48.0 |
| South Central | 86 | 49.8 | 50.0 |
| Southwest | 128 | 47.6 | 44.0 |
| Southeast | 357 | 47.1 | 44.0 |
| Detroit Metro | 1,438 | 47.2 | 45.0 |
| Outside Michigan | 443 | 49.2 | 49.0 |
*Population data are based on 2023 census data
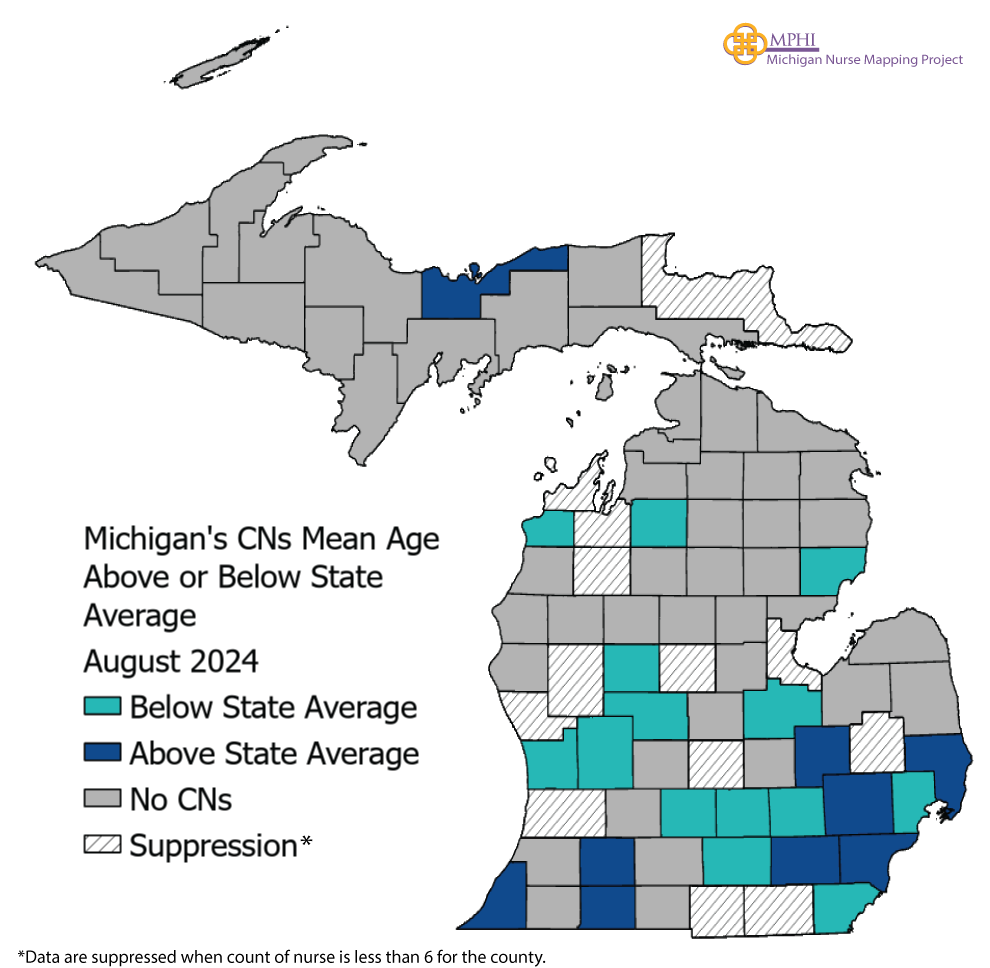
Michigan Certified Clinical Nurse Specialist Mean Age by County
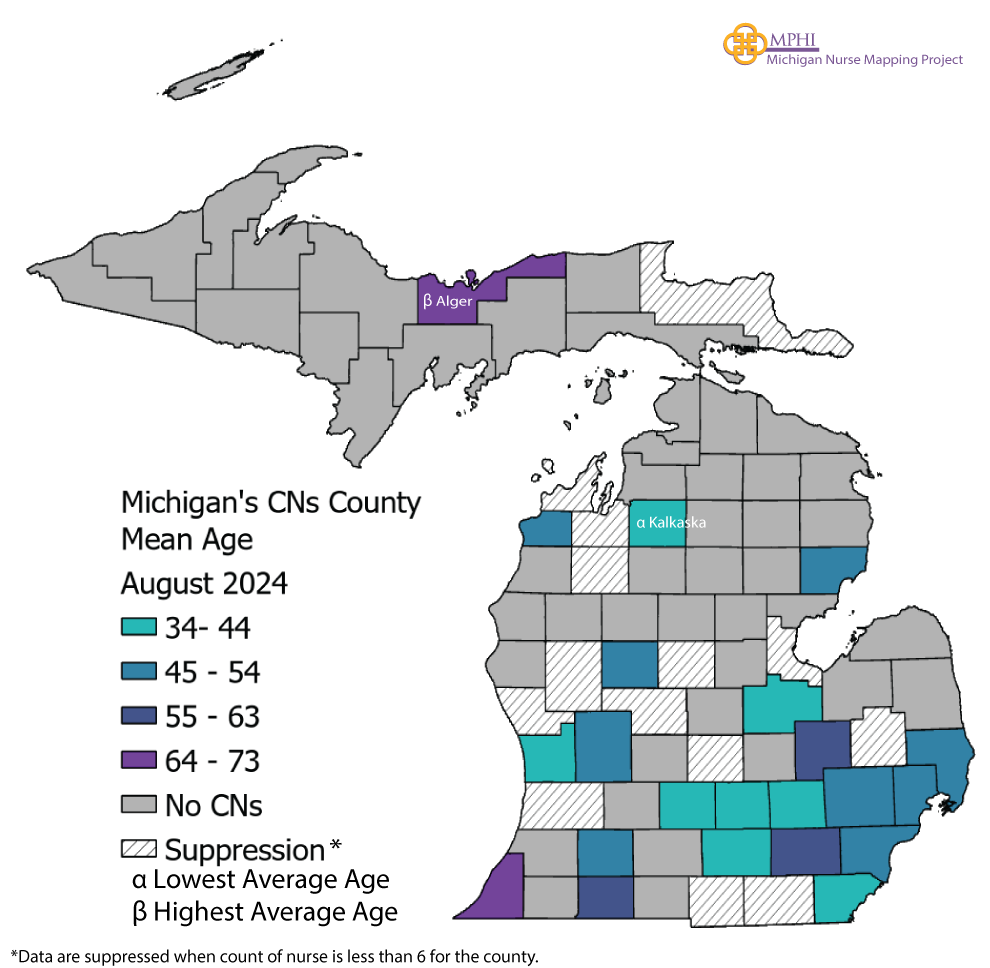
| Region | Total CNSs | Average Age | Median Age |
|---|---|---|---|
| Michigan | 325 | 51.0 | 49.5 |
| Eastern/ Central/ Western UP | * | * | * |
| Northwest LP | 9 | 53.4 | 60.0 |
| Northeast LP | * | * | * |
| West/West Central | 56 | 47.9 | 46.0 |
| East Central | * | * | * |
| East | 8 | 58.8 | 58.0 |
| South Central | 14 | 47.5 | 43.0 |
| Southwest | 7 | 58.7 | 63.0 |
| Southeast | 66 | 52.0 | 51.0 |
| Detroit Metro | 128 | 50.2 | 49.0 |
| Outside Michigan | 25 | 54.2 | 54.0 |
*Population data are based on 2023 census data
*Cells with less than 6 nurses were censored
Michigan Nurses Above or Below Mean Age

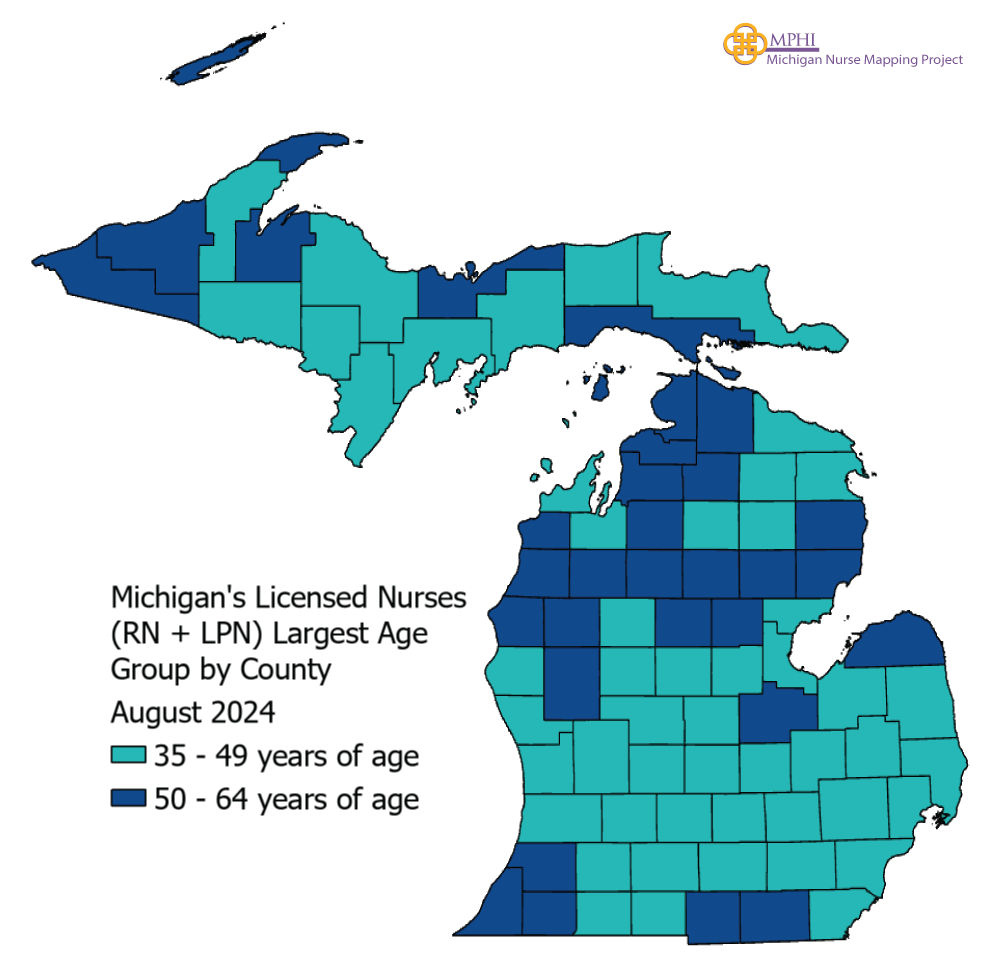
Largest Age Group of Michigan Licensed Nurses by County