2025 Annual Survey of Nurses
Survey Data Tables
Analysis of the survey responses are presented in tables and charts below:
Survey Respondents & Response Rates
Demographic Characteristics of Survey Respondents
| Demographics | RN = 15,786 | LPN = 1,362 | ||
|---|---|---|---|---|
| n | Estimate | n | Estimate | |
| Age | ||||
| <25 years | 80 | 0.5% | * | * |
| 25 to 34 years | 1,177 | 7.5% | 95 | 7.0% |
| 35 to 44 years | 2,318 | 14.7% | 211 | 15.5% |
| 45 to 54 years | 3,088 | 19.6% | 268 | 19.7% |
| 55 to 64 years | 4,100 | 26.0% | 397 | 29.1% |
| 65 to 74 years | 4,050 | 25.7% | 313 | 23.0% |
| 75+ years | 793 | 5.0% | 55 | 4.0% |
| Unknown | 180 | 1.1% | 19 | 1.4% |
| Gender | ||||
| Female | 14,178 | 89.8% | 1,249 | 91.7% |
| Male | 1,334 | 8.5% | 90 | 6.6% |
| Gender non-binary/ Genderqueer/Transgender | 36 | 0.2% | 0 | 0.0% |
| Prefer not to respond | 168 | 1.1% | 14 | 1.0% |
| Unknown | 70 | 0.4% | * | * |
| Race | ||||
| White | 14,179 | 89.8% | 1,006 | 73.9% |
| Black | 886 | 5.6% | 293 | 21.5% |
| American Indian | 224 | 1.4% | 41 | 3.0% |
| Asian/ Pacific Islander | 428 | 2.7% | 27 | 2.0% |
| Other | 318 | 2.0% | 46 | 3.4% |
| Unknown | 139 | 0.9% | 18 | 1.3% |
| Hispanic or Latinx | ||||
| Yes | 316 | 2.0% | 35 | 2.6% |
| No | 15,279 | 96.8% | 1,303 | 95.7% |
| Unknown | 191 | 1.2% | 24 | 1.8% |
| Middle Eastern | ||||
| Yes | 203 | 1.3% | 16 | 1.2% |
| No | 15,409 | 97.6% | 1,326 | 97.4% |
| Unknown | 174 | 1.1% | 20 | 1.5% |
| Region | ||||
| Upper Peninsula | 546 | 3.5% | 92 | 6.8% |
| Northwest LP | 655 | 4.1% | 42 | 3.1% |
| Northeast LP | 319 | 2.0% | 39 | 2.9% |
| West/West Central | 2,300 | 14.6% | 221 | 16.2% |
| East Central | 804 | 5.1% | 102 | 7.5% |
| East | 1,207 | 7.6% | 111 | 8.1% |
| South Central | 668 | 4.2% | 37 | 2.7% |
| Southwest | 1,029 | 6.5% | 98 | 7.2% |
| Southeast | 1,598 | 10.1% | 131 | 9.6% |
| Detroit Metro | 4,826 | 30.6% | 400 | 29.4% |
| MI, Unknown Region | 181 | 1.1% | 21 | 1.5% |
| Outside MI | 1,653 | 10.5% | 68 | 5.0% |
| Unknown | 0 | 0.0% | 0 | 0.0% |
* Data are suppressed if count is less than 10 or sample population was less than 20.
a Gender options have been combined for the purpose of increasing the likelihood of having enough responses to be included in the analysis. Should the number be high enough, we will revisit separating out options in future surveys.
b Respondents were instructed to select all races that apply to them.
c Southeast Michigan includes the following counties: Livingston, Jackson, Washtenaw, Hillsdale, Lenawee and Monroe.
d Detroit Metro includes the following counties: Oakland, Wayne, and Macomb.
Demographics of LARA-Certified APNs
| Demographics | N = 15,010 | |
|---|---|---|
| Estimate | 95% CI | |
| Total | 12.0% | (11.5%, 12.5%) |
| Age | ||
| <25 years | 0.0% | (0.0%, 4.9%) |
| 25 to 34 years | 8.5% | (7.0%, 10.3%) |
| 35 to 44 years | 17.2% | (15.7%, 18.8%) |
| 45 to 54 years | 13.9% | (12.7%, 15.2%) |
| 55 to 64 years | 10.2% | (9.3%, 11.2%) |
| 65+ years | 8.9% | (8.1%, 9.8%) |
| Gender | ||
| Female | 11.9% | (11.4%, 12.5%) |
| Male | 14.0% | (12.2%, 16.0%) |
| Gender non-binary, Genderqueer, Transgender | 0.0% | (0.0%, 10.7%) |
| Prefer not to respond | 10.2% | (6.4%, 15.9%) |
| Race | ||
| White | 11.7% | (11.2%, 12.3%) |
| Black | 12.6% | (10.5%, 15.0%) |
| American Indian | 10.7% | (7.2%, 15.6%) |
| Asian/ Pacific Islander | 16.3% | (13.1%, 20.2%) |
| Other Race | 14.4% | (10.9%, 18.8%) |
| Hispanic or Latinx | ||
| Yes | 9.6% | (6.8%, 13.4%) |
| Middle Eastern | ||
| Yes | 21.8% | (16.6%, 28.0%) |
| Region of Residence | ||
| Upper Peninsula | 10.0% | (7.7%, 12.9%) |
| Northwest LP | 12.3% | (10.0%, 15.1%) |
| Northeast LP | 11.7% | (8.5%, 15.8%) |
| West/West Central | 8.9% | (7.8%, 10.2%) |
| East Central | 12.2% | (10.1%, 14.7%) |
| East | 8.9% | (7.4%, 10.7%) |
| South Central | 11.9% | (9.6%, 14.6%) |
| Southwest | 14.4% | (12.3%, 16.7%) |
| Southeast | 14.1% | (12.4%, 15.9%) |
| Detroit Metro | 13.7% | (12.7%, 14.7%) |
| Unknown MI Region | 8.3% | (5.0%, 13.5%) |
| Outside MI | 11.4% | (9.9%, 13.1%) |
| Region of Employment | ||
| Upper Peninsula | 11.4% | (8.5%, 15.2%) |
| Northwest LP | 13.3% | (10.2%, 17.1%) |
| Northeast LP | 12.2% | (8.1%, 18.0%) |
| West/West Central | 9.7% | (8.3%, 11.4%) |
| East Central | 15.0% | (12.2%, 18.3%) |
| East | 12.6% | (10.3%, 15.3%) |
| South Central | 15.2% | (12.2%, 18.7%) |
| Southwest | 15.9% | (13.3%, 18.9%) |
| Southeast | 15.6% | (13.6%, 17.8%) |
| Detroit Metro | 13.6% | (12.4%, 14.9%) |
| Unknown MI Region | 11.8% | (7.9%, 17.3%) |
| Outside MI | 12.6% | (10.8%, 14.6%) |
a Gender options have been combined for the purpose of increasing the likelihood of having enough responses to be included in the analysis. Should the number be high enough, we will revisit separating out options in future surveys.
b Respondents were instructed to select all races that apply to them.
c Southeast Michigan includes the following counties: Livingston, Jackson, Washtenaw, Hillsdale, Lenawee and Monroe.
d Detroit Metro includes the following counties: Oakland, Wayne, and Macomb.
Comparison of Survey Respondents to All Nurses Licensed in Michigan
| Characteristics | RNs | LPNs | ||||||
|---|---|---|---|---|---|---|---|---|
| Nurse Population | Survey Participants | Nurse Population | Survey Participants | |||||
| # | % | # | % | # | % | # | % | |
| Total | 176,813 | – | 15,786 | – | 20,663 | – | 1,362 | – |
| Age | ||||||||
| <25 years | 3,825 | 2.2% | 80 | 0.5% | 447 | 2.2% | * | * |
| 25 to 34 years | 36,696 | 20.8% | 1,177 | 7.5% | 3,338 | 16.2% | 95 | 7.0% |
| 35 to 44 years | 44,523 | 25.2% | 2,318 | 14.7% | 5,347 | 25.9% | 211 | 15.5% |
| 45 to 54 years | 36,789 | 20.8% | 3,088 | 19.6% | 4,749 | 23.0% | 268 | 19.7% |
| 55 to 64 years | 32,349 | 18.3% | 4,100 | 26.0% | 4,044 | 19.6% | 397 | 29.1% |
| 65 to 74 years | 19,457 | 11.0% | 4,050 | 25.7% | 2,343 | 11.3% | 313 | 23.0% |
| 75+ years | 3,145 | 1.8% | 793 | 5.0% | 388 | 1.9% | 55 | 4.0% |
| Unknown | 29 | 0.02% | 180 | 1.1% | * | * | 19 | 1.4% |
| Region of Residence | ||||||||
| Eastern/Central/ Western UP | 4,168 | 2.4% | 546 | 3.5% | 1,094 | 5.3% | 92 | 6.8% |
| Northwest LP | 5,118 | 2.9% | 655 | 4.1% | 420 | 2.0% | 42 | 3.1% |
| Northeast LP | 2,718 | 1.5% | 319 | 2.0% | 513 | 2.5% | 39 | 2.9% |
| West/West Central | 22,157 | 12.5% | 2,300 | 14.6% | 2,716 | 13.1% | 221 | 16.2% |
| East Central | 8,290 | 4.7% | 804 | 5.1% | 1,111 | 5.4% | 102 | 7.5% |
| East | 12,623 | 7.1% | 1,207 | 7.6% | 1,819 | 8.8% | 111 | 8.1% |
| South Central | 5,610 | 3.2% | 668 | 4.2% | 573 | 2.8% | 37 | 2.7% |
| Southwest | 9,849 | 5.6% | 1,029 | 6.5% | 1,272 | 6.2% | 98 | 7.2% |
| Southeast | 17,534 | 9.9% | 1,598 | 10.1% | 1,851 | 9.0% | 131 | 9.6% |
| Detroit Metro | 55,385 | 31.3% | 4,826 | 30.6% | 7,915 | 38.3% | 400 | 29.4% |
| MI, Unknown Region | 3,789 | 2.1% | 181 | 1.1% | 42 | 0.2% | 21 | 1.5% |
| Non-Michigan | 29,022 | 16.4% | 1,653 | 10.5% | 1,251 | 6.1% | 68 | 5.0% |
| Unknown Region | 550 | 0.3% | 0 | 0.0% | 86 | 0.4% | 0 | 0.0% |
| LARA-certified APN (Advanced Practitioner Nurse) | ||||||||
| Nurse Practitioner | 16,239 | 9.2% | 1,205 | 7.6% | – | – | – | – |
| Anesthetist | 3,219 | 1.8% | 212 | 1.3% | – | – | – | – |
| Midwife | 603 | 0.3% | 64 | 0.4% | – | – | – | – |
| Clinical Specialist | 342 | 0.2% | 170 | 1.1% | – | – | – | – |
* Data are suppressed if count is less than 10 or sample population was less than 20.
– Data are not available/data are not applicable.
a Southeast Michigan includes the following counties: Livingston, Jackson, Washtenaw, Hillsdale, Lenawee and Monroe.
b Detroit Metro includes the following counties: Oakland, Wayne, and Macomb.
Education
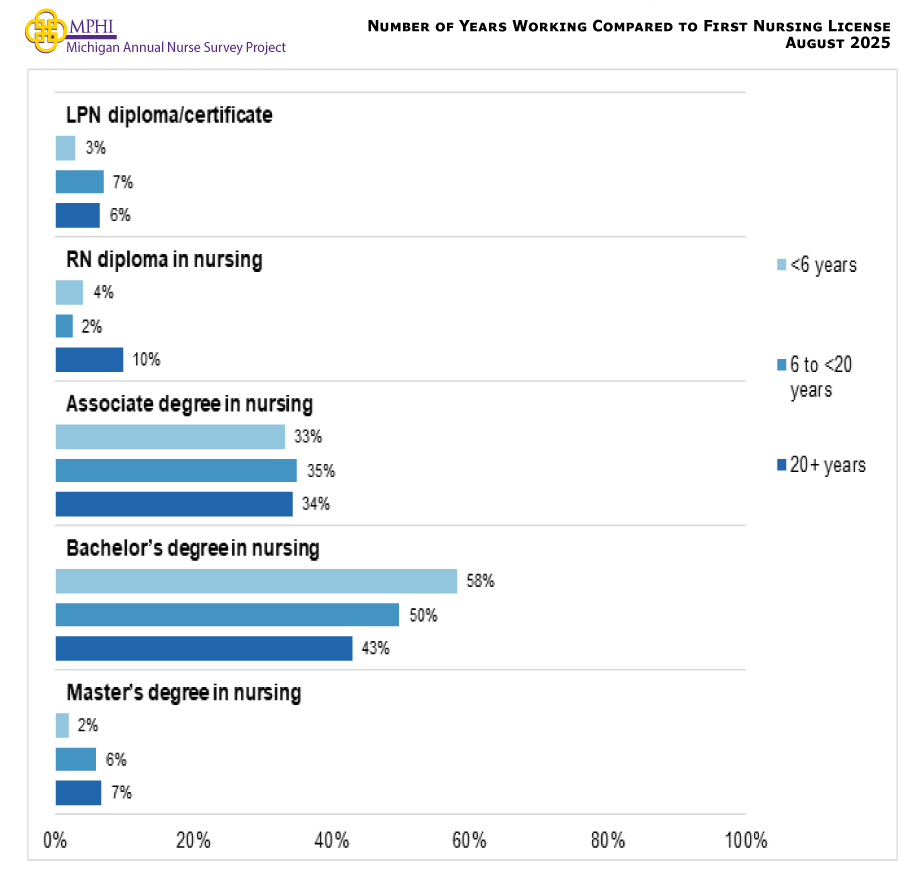
Educational Background that Qualified for First Nursing License among RNs
| Education Level | RN = 15,786 | ||
|---|---|---|---|
| N | Estimate | 95% CI | |
| LPN diploma/certificate | 932 | 5.7% | (5.3%, 6.1%) |
| RN diploma in nursing | 1,645 | 6.6% | (6.2%, 7.0%) |
| Associate degree in nursing | 5,743 | 34.5% | (33.8%, 35.2%) |
| Bachelor’s degree in nursing | 6,610 | 48.1% | (47.3%, 48.9%) |
| Master’s degree in nursing | 838 | 5.2% | (4.9%, 5.6%) |
Highest Level of Nursing-Related Education
| Educational Level | RN = 15,698 | LPN = 1,355 | ||||
|---|---|---|---|---|---|---|
| N | Estimate | 95% CI | N | Estimate | 95% CI | |
| LPN diploma/certificate | * | * | * | 1,263 | 93.4% | (92.0%, 94.6%) |
| RN diploma in nursing | 954 | 3.8% | (3.5%, 4.1%) | 10 | 1.0% | (0.6%, 1.7%) |
| Associate degree in nursing | 4,318 | 25.0% | (24.3%, 25.7%) | 66 | 4.4% | (3.4%, 5.6%) |
| Bachelor’s degree in nursing | 7,154 | 50.9% | (50.1%, 51.7%) | 13 | 1.0% | (0.6%, 1.7%) |
| Master’s degree in nursing | 2,700 | 16.8% | (16.2%, 17.4%) | * | * | * |
| Doctorate in Nursing Practice (DNP) | 380 | 2.6% | (2.4%, 2.9%) | 0 | 0.0% | (0.0%, 0.3%) |
| Doctor of Nurse Anesthesia (DNAP) | 21 | 0.2% | (0.1%, 0.3%) | 0 | 0.0% | (0.0%, 0.3%) |
| Doctor of Philosophy in Nursing (PhD) | 155 | 0.6% | (0.5%, 0.7%) | 0 | 0.0% | (0.0%, 0.3%) |
| Other doctoral degree in nursing | 13 | 0.0% | (0.0%, 0.0%) | * | * | * |
* Data are suppressed if count is less than 10 or sample population was less than 20.
Highest Level of Non-Nursing Education
| Education Level | RN = 15,786 | LPN = 1,362 | ||||
|---|---|---|---|---|---|---|
| N | Estimate | 95% CI | N | Estimate | 95% CI | |
| Non-nursing associate degree | 2,056 | 13.5% | (13.0%, 14.0%) | 317 | 22.9% | (20.7%, 25.2%) |
| Non-nursing bachelor’s degree | 2,328 | 15.4% | (14.8%, 16.0%) | 103 | 6.6% | (5.4%, 8.0%) |
| Non-nursing master’s degree | 1,111 | 5.3% | (5.0%, 5.7%) | 31 | 1.6% | (1.1%, 2.4%) |
| Non-nursing doctoral degree | 152 | 0.5% | (0.4%, 0.6%) | * | * | * |
| Not applicable | 10,139 | 65.1% | (64.4%, 65.8%) | 906 | 68.6% | (66.1%, 71.0%) |
* Data are suppressed if count is less than 10 or sample population was less than 20.
Degree Received First
| Degree Received First | RN = 5,621 | LPN = 457 | ||||
|---|---|---|---|---|---|---|
| N | Estimate | 95% CI | N | Estimate | 95% CI | |
| Non-nursing education prior to nursing education | 3,966 | 79.1% | (78.0%, 80.1%) | 291 | 69.0% | (64.6%, 73.1%) |
| Nursing education prior to non-nursing education | 1,655 | 20.9% | (19.9%, 22.0%) | 166 | 31.0% | (26.9%, 35.4%) |
Nurses’ First Nursing Degree Compared to their Highest Nursing Degree
| First Nursing Degree to Highest Nursing Degree | n | Estimate | 95% CI |
|---|---|---|---|
| LPN Diploma/Certificate as First Nursing Degree | |||
| LPN diploma/certificate | 1,362 | 67.5% | (65.6%, 69.4%) |
| RN diploma/associate degree | 415 | 13.2% | (11.9%, 14.6%) |
| Bachelor’s degree in nursing | 319 | 12.1% | (10.8%, 13.5%) |
| Master’s or Doctorate in nursing | 194 | 7.2% | (6.2%, 8.3%) |
| RN Diploma/Associate degree as First Nursing Degree | |||
| RN diploma/associate degree | 4,839 | 64.2% | (62.2%, 66.1%) |
| Bachelor’s degree in nursing | 1,523 | 23.5% | (21.8%, 25.3%) |
| Master’s degree in nursing | 798 | 10.3% | (9.1%, 11.6%) |
| Doctorate in nursing | 183 | 2.0% | (1.5%, 2.7%) |
| Bachelor’s degree in nursing as First Nursing Degree | |||
| Bachelor’s degree in nursing | 5,305 | 81.7% | (80.1%, 83.2%) |
| Master’s degree in nursing | 967 | 14.0% | (12.6%, 15.5%) |
| Doctorate in nursing | 297 | 4.3% | (3.5%, 5.2%) |
| Master’s Degree as First Nursing Degree | |||
| Master’s degree in nursing | 776 | 93.7% | (92.6%, 94.6%) |
| Doctorate in nursing | 52 | 6.3% | (5.4%, 7.4%) |
a Associate degrees were included with RNs because many who start with an associate degree now have an RN degree as their highest level of education. Additionally, LPNs who did not answer the survey question about their highest level of education were categorized in the LPN diploma category. For this reason, sample size numbers may vary across tables.
b Doctorate degrees include PhD, DNP, DNAP, or other nursing doctorate degrees.
International Board-Certified Lactation Consultant Certificate
| International Board-Certified Lactation Consultant Certificate | RN = 15,714 | LPN = 1,352 | ||||
|---|---|---|---|---|---|---|
| N | Estimate | 95% CI | N | Estimate | 95% CI | |
| Yes | 108 | 0.6% | (0.5%, 0.7%) | 11 | 0.7% | (0.4%, 1.3%) |
| No | 15,606 | 99.4% | (99.3%, 99.5%) | 1,341 | 99.3% | (98.7%, 99.6%) |
Nursing Education Outside the United States
| Education Outside of the United States | RN = 15,606 | LPN = 1,343 | ||||
|---|---|---|---|---|---|---|
| N | Estimate | 95% CI | N | Estimate | 95% CI | |
| Yes | 492 | 3.4% | (3.1%, 3.7%) | 21 | 1.4% | (0.9%, 2.2%) |
| No | 15,114 | 96.6% | (96.3%, 96.9%) | 1,322 | 98.6% | (97.8%, 99.1%) |
Number of Years Working Compared to the First Nursing License
Benefits of a Loan Repayment Program
| Benefits of a Loan Repayment Program | RN = 15,530 | LPN = 1,340 | ||
|---|---|---|---|---|
| Estimate | 95% CI | Estimate | 95% CI | |
| Yes, it would help pay previous loans | 31.6% | (30.9%, 32.3%) | 45.0% | (42.4%, 47.7%) |
| Yes, it would help seek additional nursing education | 34.5% | (33.8%, 35.3%) | 50.1% | (47.5%, 52.8%) |
| No | 54.9% | (54.1%, 55.7%) | 38.9% | (36.3%, 41.5%) |
a Respondents were instructed to mark all that apply.
Current Enrollment in Nursing Educational Programs
| Degree | RN = 778 | LPN = 141 | ||||
|---|---|---|---|---|---|---|
| N | Estimate | 95% CI | N | Estimate | 95% CI | |
| Associate Degree in Nursing (ADN) | 15 | 1.4% | (0.8%, 2.5%) | 115 | 82.3% | (75.2%, 87.7%) |
| Bachelor of Science in Nursing (BSN) | 304 | 40.0% | (36.6%, 43.5%) | 29 | 19.9% | (14.1%, 27.2%) |
| Master of Science in Nursing (MSN) | 319 | 40.5% | (37.1%, 44.0%) | * | * | * |
| Doctor of Nursing Practice (DNP) | 131 | 16.0% | (13.6%, 18.7%) | 0 | 0.0% | (0.0%, 2.7%) |
| Doctor of Nurse Anesthesia (DNAP) | 22 | 3.9% | (2.8%, 5.5%) | 0 | 0.0% | (0.0%, 2.7%) |
| Doctor of Philosophy in Nursing (PhD) | 23 | 2.9% | (1.9%, 4.3%) | 0 | 0.0% | (0.0%, 2.7%) |
a Respondents were instructed to mark all that apply.
* Data are suppressed if count is less than 10 or sample population was less than 20.
Current Enrollment in Educational Programs Associated with APN Nursing Specialty Certification Exams among all RNs
| Certification | RN = 392 | |
|---|---|---|
| Estimate | 95% CI | |
| Nurse Practitioner | 56.3% | (51.4%, 61.1%) |
| Nurse Midwife | * | * |
| Nurse Anesthetist | 8.7% | (6.3%, 11.9%) |
| Clinical Nurse Specialist | 5.9% | (4.0%, 8.7%) |
| Other | 26.8% | (22.7%, 31.4%) |
* Data are suppressed if count is less than 10 or sample population was less than 20.
Current Program Type
| Program Type | RN = 761 | LPN = 140 | ||
|---|---|---|---|---|
| Estimate | 95% CI | Estimate | 95% CI | |
| In-person | 8.6% | (6.8%, 10.8%) | 50.5% | (42.3%, 58.7%) |
| Online | 70.1% | (66.8%, 73.2%) | 16.3% | (11.1%, 23.3%) |
| Hybrid | 21.3% | (18.5%, 24.3%) | 33.2% | (25.9%, 41.4%) |
Social Determinants of Health
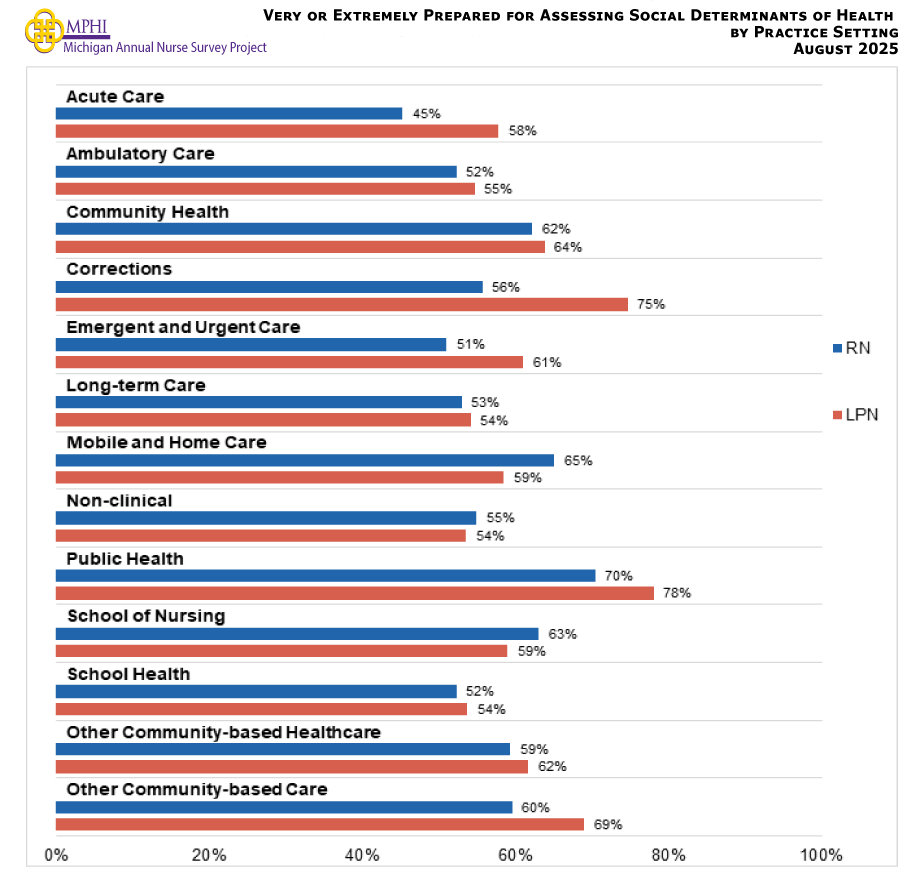
Preparedness for Assessing Social Determinants of Health
| Preparedness | RN = 11,005 | LPN = 962 | ||
|---|---|---|---|---|
| Estimate | 95% CI | Estimate | 95% CI | |
| Not at all prepared | 3.5% | (3.2%, 3.9%) | 4.4% | (3.3%, 5.9%) |
| Somewhat prepared | 17.2% | (16.5%, 17.9%) | 15.6% | (13.4%, 18.0%) |
| Moderately prepared | 28.9% | (28.1%, 29.8%) | 25.7% | (23.0%, 28.6%) |
| Very prepared | 34.1% | (33.2%, 35.0%) | 36.2% | (33.2%, 39.3%) |
| Extremely prepared | 16.3% | (15.6%, 17.0%) | 18.1% | (15.8%, 20.7%) |
Very or Extremely Prepared for Assessing Social Determinants of Health by Setting
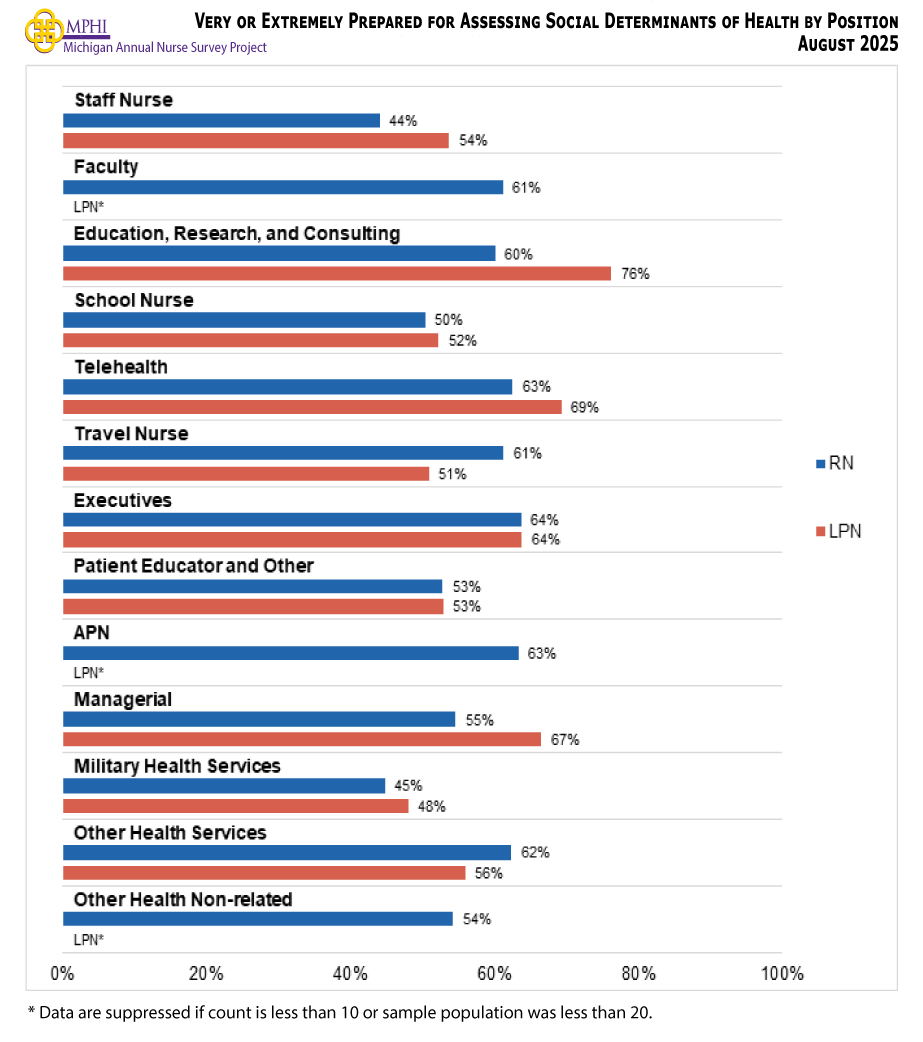
Very or Extremely Prepared for Assessing Social Determinants of Health by Position
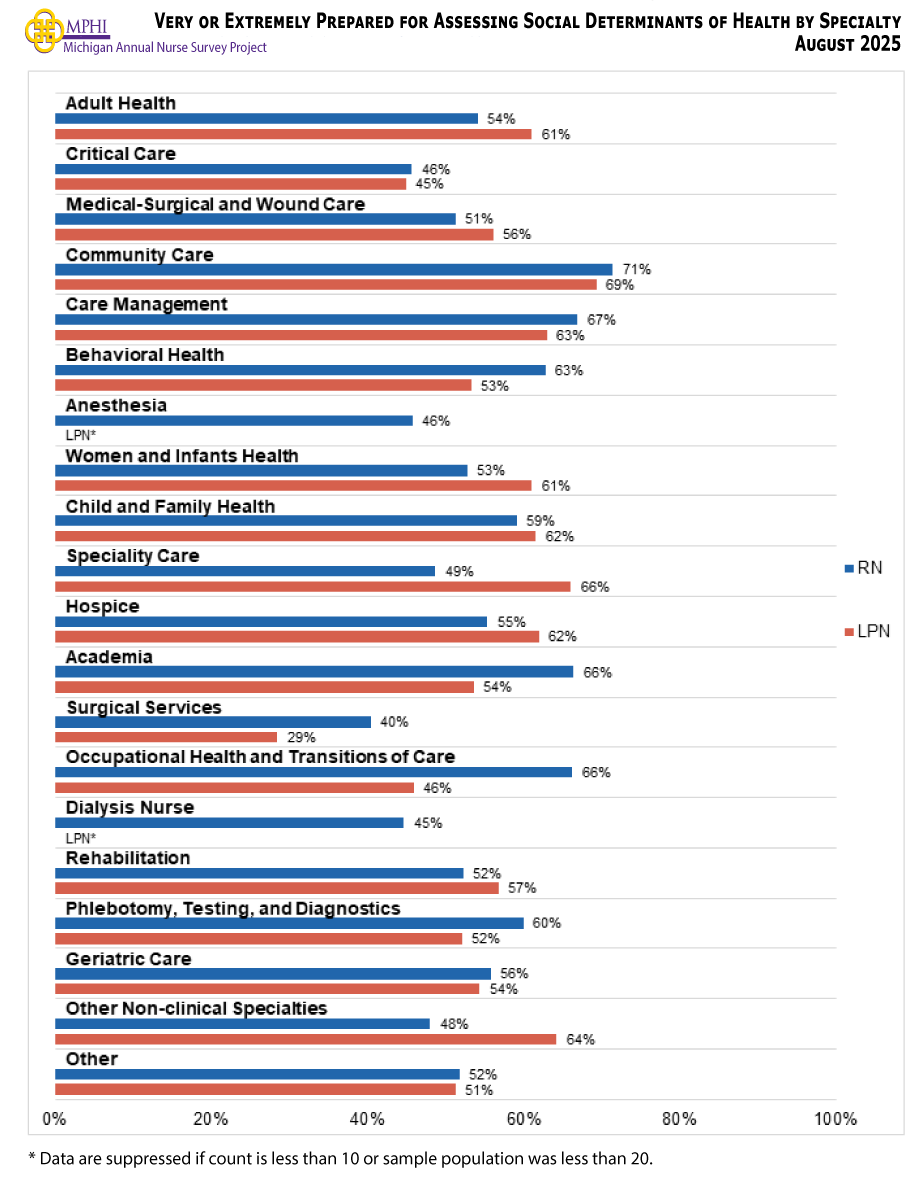
Very or Extremely Prepared for Assessing Social Determinants of Health by Specialty
Preparedness for Connecting Patients to Resources to Address Social Determinants of Health Needs
| Preparedness | RN = 11,005 | LPN = 964 | ||
|---|---|---|---|---|
| Estimate | 95% CI | Estimate | 95% CI | |
| Not at all prepared | 15.0% | (14.3%, 15.7%) | 10.6% | (8.8%, 12.7%) |
| Somewhat prepared | 27.4% | (26.6%, 28.2%) | 23.0% | (20.5%, 25.8%) |
| Moderately prepared | 28.1% | (27.3%, 28.9%) | 29.1% | (26.3%, 32.0%) |
| Very prepared | 20.4% | (19.7%, 21.2%) | 26.2% | (23.5%, 29.1%) |
| Extremely prepared | 9.2% | (8.7%, 9.8%) | 11.1% | (9.3%, 13.2%) |
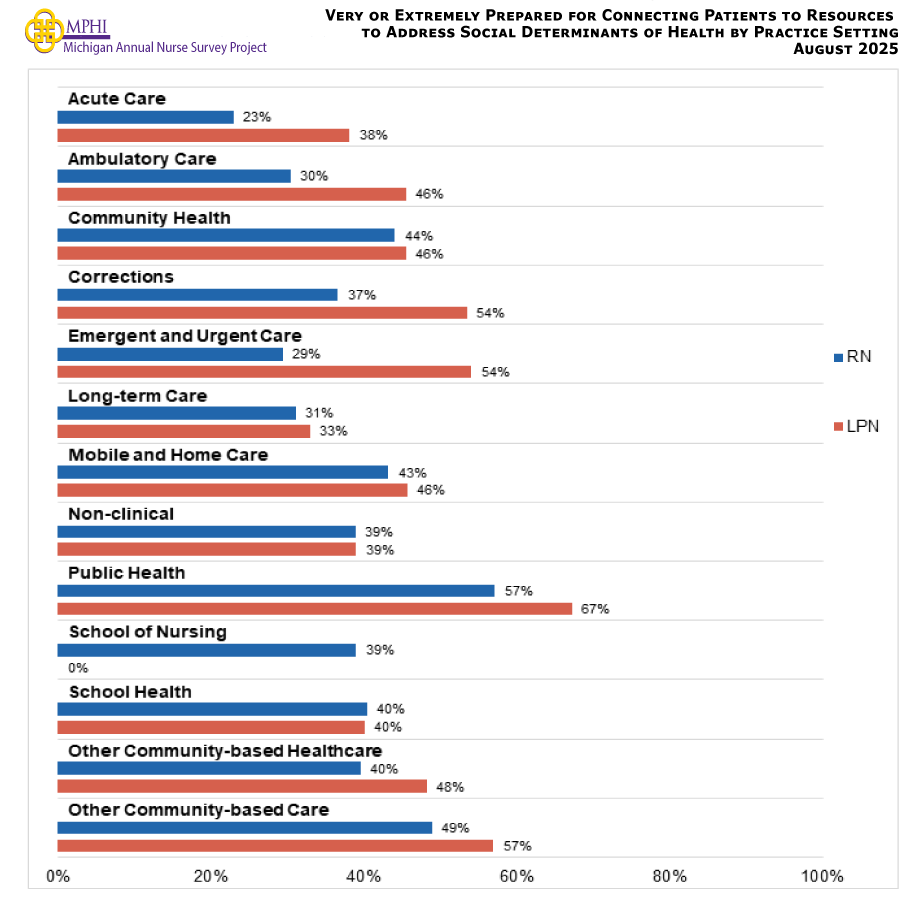
Very or Extremely Prepared for Connecting Patients to Resources to Address Social Determinants of Health by Setting
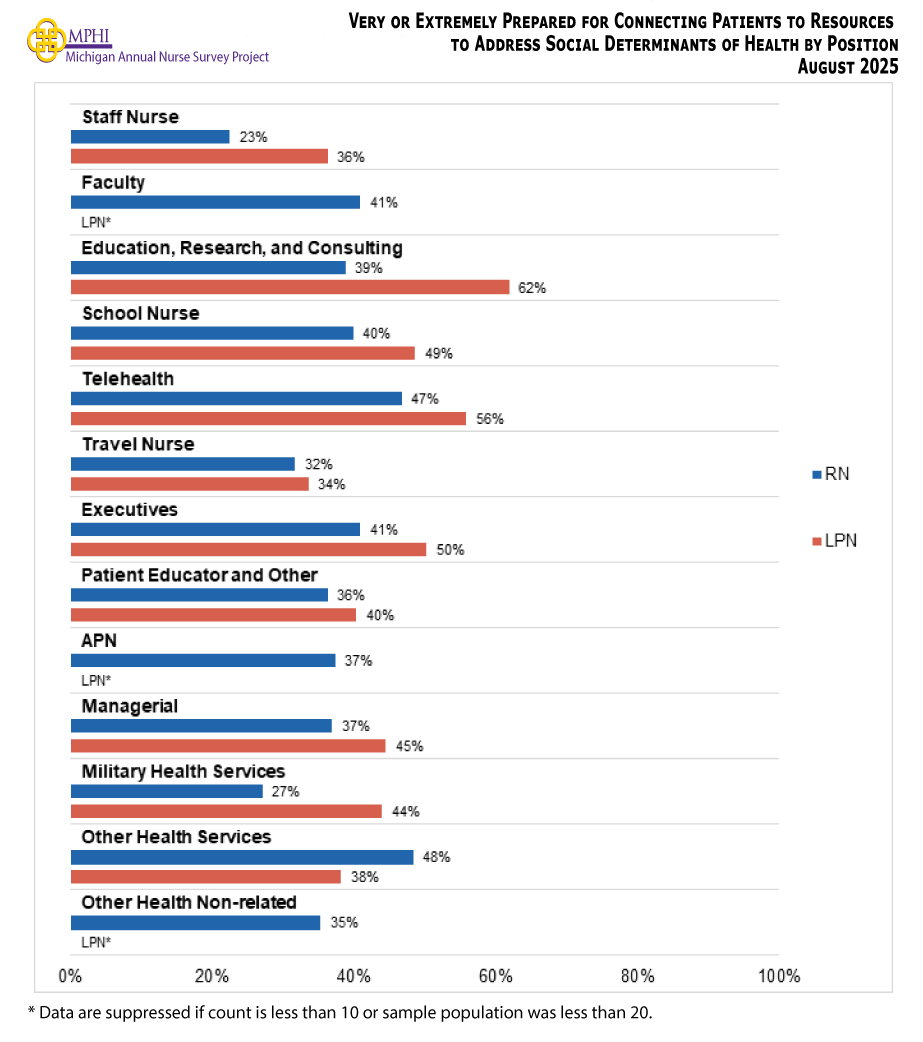
Very or Extremely Prepared for Connecting Patients to Resources to Address Social Determinants of Health by Position
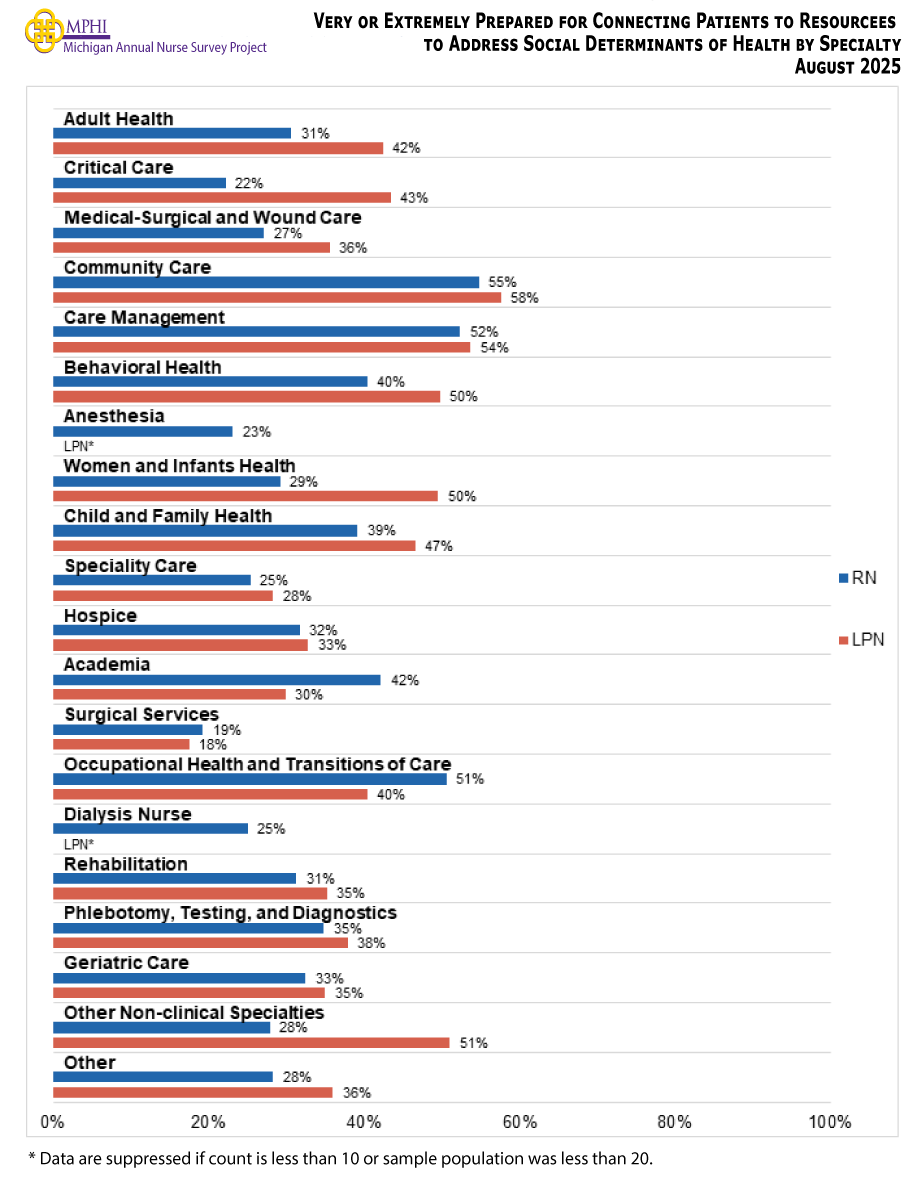
Very or Extremely Prepared for Connecting Patients to Resources to Address Social Determinants of Health by Specialty
Employment
Current Employment Status
| Employment | RN = 15,786 | LPN = 1,362 | ||||
|---|---|---|---|---|---|---|
| N | Estimate | 95% CI | N | Estimate | 95% CI | |
| Actively employed in nursing or in a position that requires a nurse license full-time | 8,503 | 66.0% | (65.3%, 66.7%) | 752 | 63.5% | (60.9%, 66.0%) |
| Actively employed in nursing or a position that requires a nurse license part-time | 1,644 | 10.4% | (9.9%, 10.9%) | 157 | 11.0% | (9.4%, 12.8%) |
| Actively employed in nursing or in a position that requires a nurse license on a per-diem basis | 831 | 4.9% | (4.6%, 5.2%) | 53 | 4.5% | (3.5%, 5.7%) |
| On temporary medical leave from a position that requires a nurse license | 125 | 0.9% | (0.8%, 1.1%) | 13 | 1.0% | (0.6%, 1.7%) |
| On temporary non-medical leave from a position that requires a nurse license | 34 | 0.2% | (0.1%, 0.3%) | * | * | * |
| Actively employed in a field other than nursing | 414 | 2.6% | (2.4%, 2.9%) | 57 | 3.5% | (2.6%, 4.6%) |
| Volunteer nurse status only | 196 | 0.6% | (0.5%, 0.7%) | 13 | 0.7% | (0.4%, 1.3%) |
| Unemployed, seeking clinical work | 143 | 0.9% | (0.8%, 1.1%) | 25 | 2.9% | (2.1%, 3.9%) |
| Unemployed, seeking non-clinical work | 93 | 0.5% | (0.4%, 0.6%) | * | * | * |
| Unemployed, seeking work outside of the nursing field | 52 | 0.3% | (0.2%, 0.4%) | * | * | * |
| Unemployed, not seeking work | 318 | 2.2% | (2.0%, 2.4%) | 27 | 1.9% | (1.3%, 2.8%) |
| Permanent disability leave | 140 | 0.7% | (0.6%, 0.8%) | 22 | 1.0% | (0.6%, 1.7%) |
| Self-employed | 150 | 0.7% | (0.6%, 0.8%) | 19 | 0.9% | (0.5%, 1.6%) |
| Retired (left the workforce) | 3,143 | 9.2% | (8.8%, 9.7%) | 200 | 7.6% | (6.3%, 9.1%) |
* Data are suppressed if count is less than 10 or sample population was less than 20.
Current Employment Status for RNs by Region of Residence
| Employment Status | Upper Peninsula | Northwest LP | Northeast LP | West/West Central | East Central | East | South Central | Southwest | Southeast | Detroit Metro |
|---|---|---|---|---|---|---|---|---|---|---|
| N | N | N | N | N | N | N | N | N | N | |
| Estimate | Estimate | Estimate | Estimate | Estimate | Estimate | Estimate | Estimate | Estimate | Estimate | |
| 95% CI | 95% CI | 95% CI | 95% CI | 95% CI | 95% CI | 95% CI | 95% CI | 95% CI | 95% CI | |
| Actively employed in nursing or in a position that requires a nurse license full-time | 303 | 328 | 151 | 1,179 | 472 | 703 | 358 | 546 | 818 | 2,504 |
| 67.2% | 65.3% | 63.1% | 64.0% | 71.2% | 69.4% | 65.1% | 65.1% | 63.5% | 64.5% | |
| (63.2%, 71.0%) | (61.6%, 68.8%) | (57.7% 68.2%) | (62.0%, 65.9%) | (68.0%, 74.2%) | (66.7%, 71.9%) | (61.4%, 68.6%) | (62.1%, 68.0%) | (61.1%, 65.8%) | (63.1%, 65.8%) | |
| Actively employed in nursing or a position that requires a nurse license part-time | 48 | 49 | 19 | 305 | 54 | 111 | 79 | 129 | 177 | 508 |
| 8.1% | 7.4% | 5.1% | 13.6% | 6.8% | 9.8% | 13.1% | 12.8% | 11.5% | 10.4% | |
| (6.1%, 10.7%) | (5.6%, 9.7%) | (3.2%, 8.1%) | (12.3%, 15.1%) | (5.3%, 8.8%) | (8.2%, 11.6%) | (10.8%, 15.9%) | (10.9%, 15.0%) | (10.0%, 13.2%) | (9.6%, 11.3%) | |
| Actively employed in nursing or in a position that requires a nurse license on a per-diem basis | 18 | 32 | 28 | 118 | 44 | 46 | 42 | 51 | 74 | 292 |
| 2.7% | 4.2% | 6.9% | 4.4% | 5.5% | 3.9% | 6.2% | 4.0% | 4.3% | 5.8% | |
| (1.6%, 4.4%) | (2.9%, 6.0%) | (4.6%, 10.2%) | (3.6%, 5.3%) | (4.1%, 7.3%) | (2.9%, 5.1%) | (4.6%, 8.3%) | (3.0%, 5.4%) | (3.4%, 5.4%) | (5.2%, 6.5%) | |
| Actively employed in a field other than nursing | 26 | 18 | 10 | 71 | 19 | 33 | 20 | 25 | 48 | 112 |
| 4.1% | 3.1% | 3.4% | 2.9% | 2.4% | 2.3% | 2.5% | 2.2% | 3.4% | 2.3% | |
| (2.7%, 6.1%) | (2.0%, 4.7%) | (1.9%, 6.0%) | (2.3%, 3.7%) | (1.5%, 3.7%) | (1.6%, 3.3%) | (1.6%, 4.0%) | (1.5%, 3.3%) | (2.6%, 4.4%) | (1.9%, 2.8%) | |
| Volunteer nurse status only | * | 10 | * | 28 | 10 | 12 | * | 15 | 28 | 52 |
| * | 1.1% | * | 0.6% | 0.5% | 0.5% | * | 0.9% | 0.8% | 0.5% | |
| * | (0.5%, 2.2%) | * | (0.4%, 1.0%) | (0.2%, 1.3%) | (0.2%, 1.1%) | * | (0.5%, 1.7%) | (0.5%, 1.4%) | (0.3%, 0.7%) | |
| Unemployed, not seeking work as a nurse | 15 | 10 | * | 49 | * | 19 | 12 | 29 | 29 | 100 |
| 2.9% | 1.5% | * | 2.4% | * | 1.5% | 1.9% | 3.1% | 2.5% | 2.1% | |
| (1.8%, 4.7%) | (0.8%, 2.8%) | * | (1.8%, 3.1%) | * | (1.0%, 2.4%) | (1.1%, 3.2%) | (2.2%, 4.3%) | (1.8%, 3.4%) | (1.7%, 2.5%) | |
| Retired | 97 | 180 | 79 | 448 | 162 | 224 | 129 | 202 | 344 | 1,025 |
| 8.3% | 14.4% | 12.8% | 8.4% | 9.3% | 8.4% | 7.9% | 9.0% | 10.0% | 9.7% | |
| (6.3%, 10.9%) | (11.9%, 17.3%) | (9.6%, 16.9%) | (7.3%, 9.6%) | (7.5%, 11.5%) | (7.0%, 10.1%) | (6.1%, 10.2%) | (7.4%, 10.9%) | (8.6%, 11.6%) | (8.9%, 10.6%) |
* Data are suppressed if count is less than 10 or sample population was less than 20.
Mandatory Overtime
| Frequency | RN = 11,131 | LPN = 976 | ||
|---|---|---|---|---|
| Estimate | 95% CI | Estimate | 95% CI | |
| Never | 59.0% | (58.1%, 59.9%) | 44.5% | (41.4%, 47.6%) |
| Once a year or less | 6.1% | (5.7%, 6.6%) | 5.2% | (4.0%, 6.8%) |
| A few times per year | 13.5% | (12.9%, 14.1%) | 14.8% | (12.7%, 17.2%) |
| Once a month | 4.3% | (3.9%, 4.7%) | 4.8% | (3.6%, 6.3%) |
| A few times a month | 8.5% | (8.0%, 9.0%) | 11.9% | (10.0%, 14.1%) |
| Once a week | 2.9% | (2.6%, 3.2%) | 3.8% | (2.8%, 5.2%) |
| A few times a week | 4.5% | (4.1%, 4.9%) | 12.3% | (10.4%, 14.5%) |
| Everyday | 1.4% | (1.2%, 1.6%) | 2.6% | (1.8%, 3.8%) |
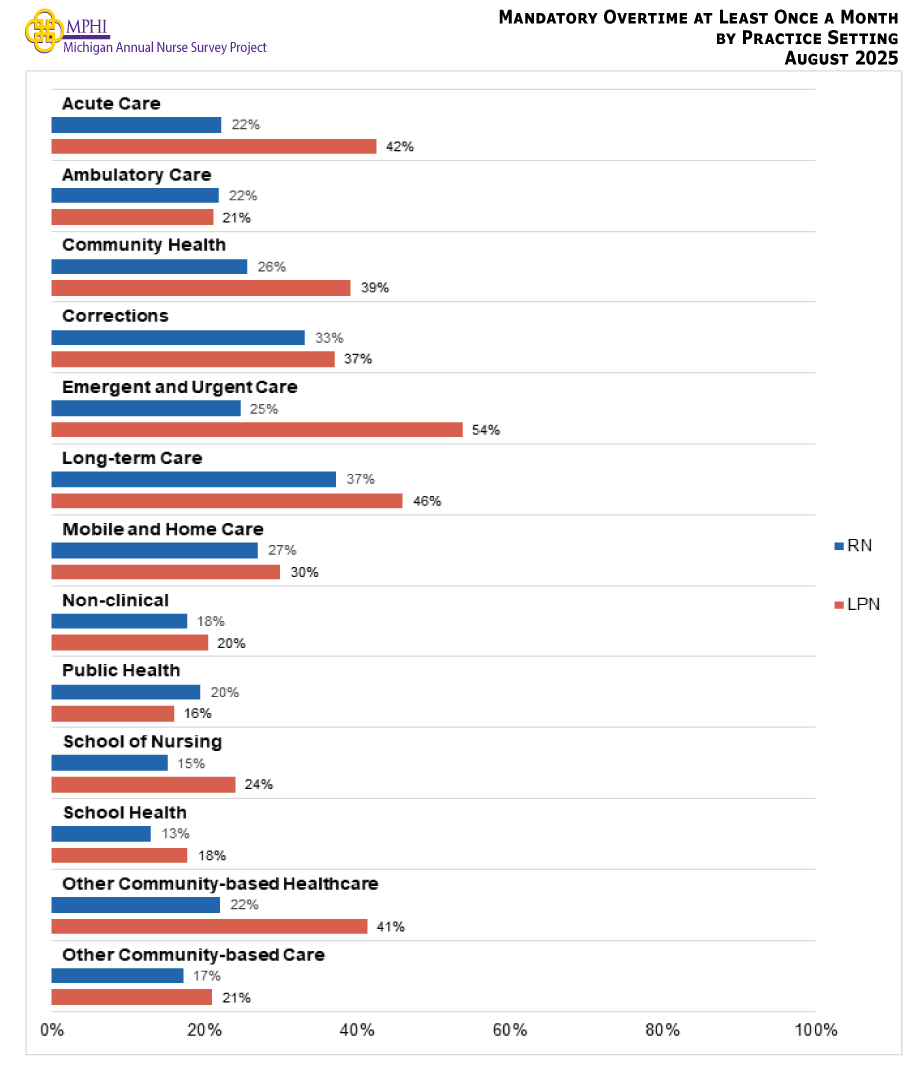
Mandatory Overtime At Least Once a Month by Setting
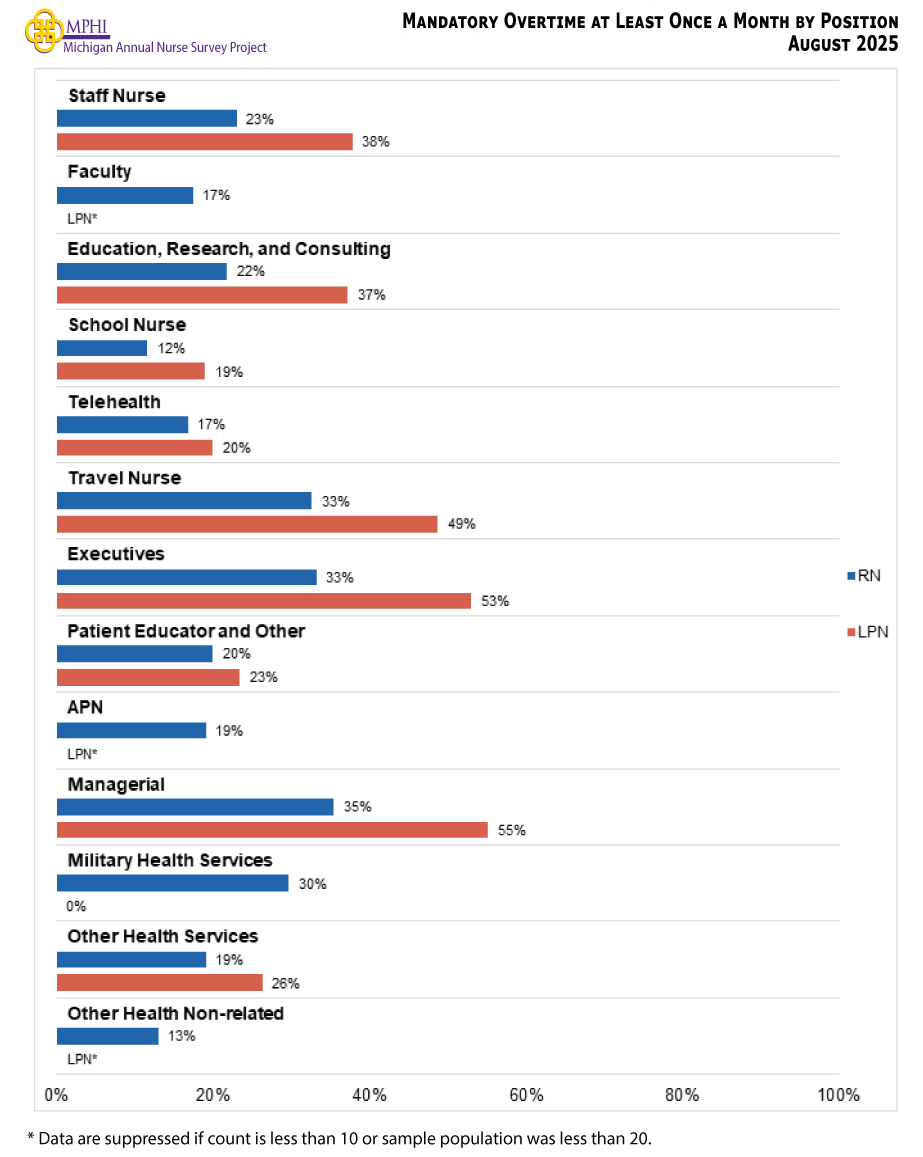
Mandatory Overtime At Least Once a Month by Position
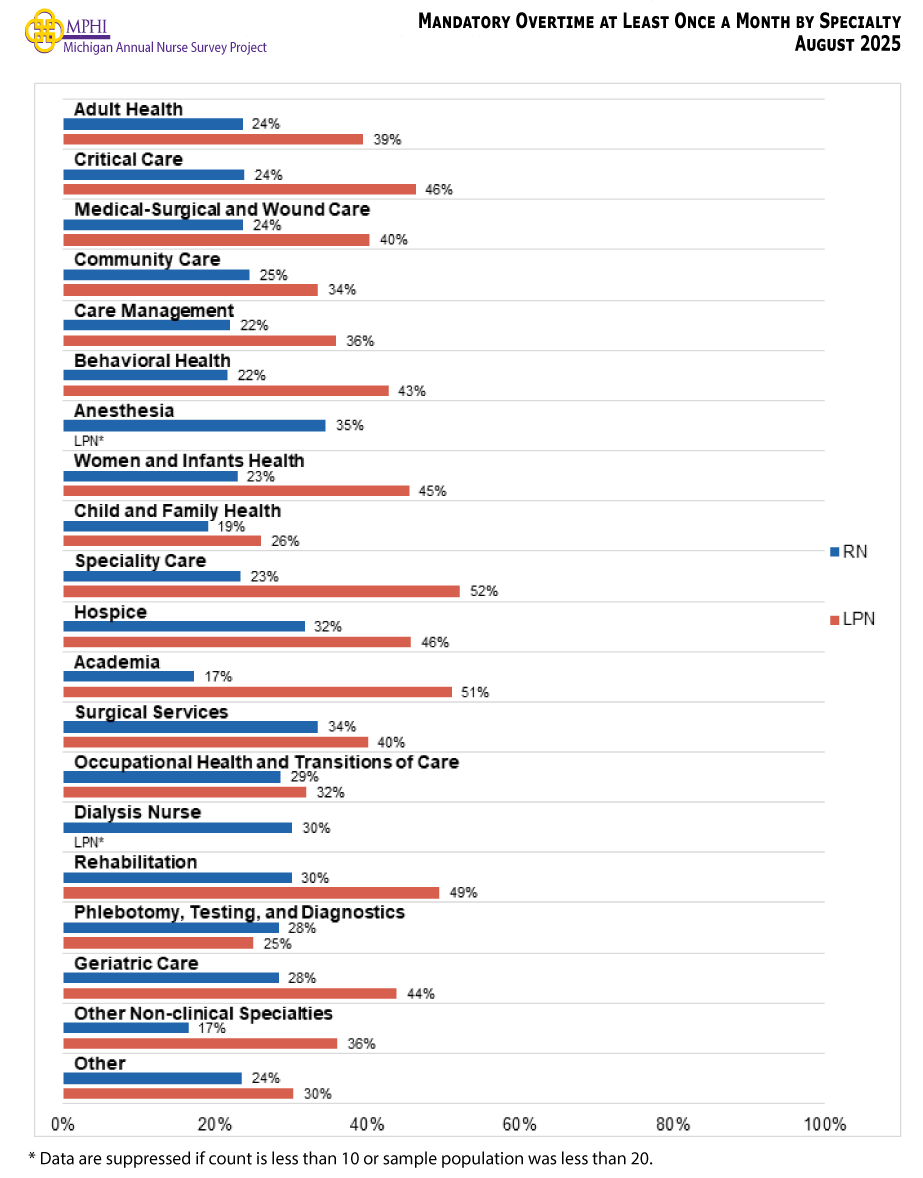
Mandatory Overtime At Least Once a Month by Specialty
Percentage of Nurses Who are Employed in Nursing by Demographic Characteristics
| Demographics | RN | LPN | ||||
|---|---|---|---|---|---|---|
| n | Estimate | 95% CI | n | Estimate | 95% CI | |
| Total | 15,786 | 82.3% | (81.7%, 82.9%) | 1,362 | 80.1% | (77.9%, 82.1%) |
| Age | ||||||
| <25 years | 80 | 98.8% | (93.3%, 99.8%) | * | * | * |
| 25 to 34 years | 1,177 | 92.5% | (90.9%, 93.9%) | 95 | 84.1% | (75.4%, 90.1%) |
| 35 to 44 years | 2,318 | 90.7% | (89.4%, 91.8%) | 211 | 89.6% | (84.7%, 93.0%) |
| 45 to 54 years | 3,088 | 91.5% | (90.5%, 92.4%) | 268 | 89.6% | (85.4%, 92.7%) |
| 55 to 64 years | 4,100 | 78.3% | (77.0%, 79.5%) | 397 | 75.8% | (71.4%, 79.8%) |
| 65+ years | 4,843 | 36.8% | (35.5%, 38.2%) | 368 | 43.0% | (38.0%, 48.1%) |
| Gender | ||||||
| Female | 14,178 | 81.6% | (81.0%, 82.2%) | 1,249 | 80.6% | (78.3%, 82.7%) |
| Male | 1,334 | 88.1% | (86.3%, 89.7%) | 90 | 71.9% | (61.9%, 80.1%) |
| Gender non-binary/ Genderqueer /Transgender | 36 | 85.7% | (70.9%, 93.7%) | 0 | 0.0% | (0.0%, 0.0%) |
| Prefer not to respond | 168 | 84.4% | (78.2%, 89.1%) | 14 | 81.8% | (55.8%, 94.1%) |
| Race & Ethnicity | ||||||
| White | 14,179 | 81.9% | (81.3%, 82.5%) | 1,006 | 78.5% | (75.9%, 80.9%) |
| Black | 886 | 85.6% | (83.1%, 87.8%) | 293 | 83.8% | (79.1%, 87.6%) |
| American Indian or Alaska Native | 224 | 85.0% | (79.7%, 89.1%) | 41 | 81.7% | (67.3%, 90.6%) |
| Asian | 428 | 86.6% | (83.0%, 89.5%) | 27 | 89.9% | (73.2%, 96.7%) |
| Hispanic or Latinx | 316 | 90.4% | (86.6%, 93.2%) | 35 | 91.9% | (78.2%, 97.3%) |
| Middle Eastern | 203 | 85.9% | (80.4%, 90.0%) | 16 | 71.0% | (46.6%, 87.3%) |
| Other | 318 | 85.9% | (81.6%, 89.3%) | 46 | 83.0% | (69.7%, 91.2%) |
| Residence | ||||||
| Upper Peninsula | 546 | 79.8% | (76.2%, 83.0%) | 92 | 81.6% | (72.5%, 88.2%) |
| Northwest LP | 655 | 77.9% | (74.6%, 80.9%) | 42 | 64.3% | (49.2%, 77.0%) |
| Northeast LP | 319 | 76.7% | (71.8%, 81.0%) | 39 | 65.9% | (50.2%, 78.7%) |
| West/West Central | 2,300 | 83.1% | (81.5%, 84.6%) | 221 | 81.3% | (75.6%, 85.9%) |
| East Central | 804 | 84.7% | (82.0%, 87.0%) | 102 | 79.8% | (71.0%, 86.4%) |
| East | 1,207 | 84.1% | (81.9%, 86.1%) | 111 | 80.4% | (72.1%, 86.7%) |
| South Central | 668 | 85.2% | (82.3%, 87.7%) | 37 | 82.2% | (67.1%, 91.3%) |
| Southwest | 1,029 | 83.0% | (80.6%, 85.2%) | 98 | 81.5% | (72.7%, 87.9%) |
| Southeast | 1,598 | 79.9% | (77.9%, 81.8%) | 131 | 78.9% | (71.1%, 85.0%) |
| Detroit Metro | 4,826 | 81.5% | (80.4%, 82.6%) | 400 | 82.8% | (78.8%, 86.2%) |
| Unknown Michigan Residence | 181 | 80.6% | (74.2%, 85.7%) | 21 | 68.1% | (46.8%, 83.8%) |
| Non-Michigan Residence | 1,653 | 84.8% | (83.0%, 86.4%) | 68 | 70.1% | (58.4%, 79.7%) |
a Gender options have been combined for the purpose of increasing the likelihood of having enough responses to be included in the analysis. Should the number be high enough, we will revisit separating out options in future surveys.
b Respondents were instructed to mark all races that apply.
c Southeast Michigan includes the following counties: Livingston, Jackson, Washtenaw, Hillsdale, Lenawee and Monroe.
d Detroit Metro includes the following counties: Oakland, Wayne, and Macomb.
e Includes individuals who indicated they live in Michigan but did not provide a zip code.
* Data are suppressed if count is less than 10 or sample population was less than 20.
Demographic Characteristics of Survey Respondents in the Nursing Field
| Demographics | RN = 11,081 | LPN = 972 | ||
|---|---|---|---|---|
| Estimate | 95% CI | Estimate | 95% CI | |
| Age | ||||
| <25 years | 2.6% | (2.3%, 2.9%) | * | * |
| 25 to 34 years | 23.3% | (22.5%, 24.1%) | 17.1% | (14.9%, 19.6%) |
| 35 to 44 years | 27.8% | (27.0%, 28.6%) | 28.9% | (26.1%, 31.8%) |
| 45 to 54 years | 23.2% | (22.4%, 24.0%) | 25.7% | (23.1%, 28.5%) |
| 55 to 64 years | 17.4% | (16.7%, 18.1%) | 18.5% | (16.2%, 21.1%) |
| 65+ years | 5.7% | (5.3%, 6.1%) | 7.1% | (5.6%, 8.9%) |
| Gender | ||||
| Female | 88.2% | (87.6%, 88.8%) | 93.6% | (91.9%, 95.0%) |
| Male | 10.3% | (9.7%, 10.9%) | 5.2% | (4.0%, 6.8%) |
| Gender non-binary/ Genderqueer /Transgender | 0.4% | (0.3%, 0.5%) | 0.0% | (0.0%, 0.2%) |
| Prefer not to respond | 1.0% | (0.8%, 1.2%) | 1.2% | (0.7%, 2.1%) |
| Race | ||||
| White | 89.9% | (89.3%, 90.4%) | 68.1% | (65.1%, 71.0%) |
| Black | 5.8% | (5.4%, 6.3%) | 27.6% | (24.9%, 30.5%) |
| Other | 7.1% | (6.6%, 7.6%) | 9.9% | (8.2%, 11.9%) |
| Hispanic or Latinx | ||||
| Yes | 2.8% | (2.5%, 3.1%) | 4.6% | (3.5%, 6.1%) |
| Middle Eastern | ||||
| Yes | 1.8% | (1.6%, 2.1%) | 1.4% | (0.8%, 2.4%) |
| Residence | ||||
| Upper Peninsula | 3.5% | (3.2%, 3.9%) | 7.1% | (5.6%, 8.9%) |
| Northwest LP | 3.6% | (3.3%, 4.0%) | 1.9% | (1.2%, 3.0%) |
| Northeast LP | 1.8% | (1.6%, 2.1%) | 1.9% | (1.2%, 3.0%) |
| West/West Central | 15.8% | (15.1%, 16.5%) | 16.0% | (13.8%, 18.4%) |
| East Central | 5.3% | (4.9%, 5.7%) | 7.2% | (5.7%, 9.0%) |
| East | 8.2% | (7.7%, 8.7%) | 8.4% | (6.8%, 10.3%) |
| South Central | 4.6% | (4.2%, 5.0%) | 2.4% | (1.6%, 3.6%) |
| Southwest | 6.5% | (6.1%, 7.0%) | 7.0% | (5.6%, 8.8%) |
| Southeast | 9.7% | (9.2%, 10.3%) | 9.7% | (8.0%, 11.7%) |
| Detroit Metro | 30.4% | (29.6%, 31.3%) | 33.6% | (30.7%, 36.6%) |
| Michigan Residence | 0.6% | (0.5%, 0.8%) | 0.5% | (0.2%, 1.2%) |
| Non-Michigan Residence | 10.2% | (9.7%, 10.8%) | 4.3% | (3.2%, 5.8%) |
a Gender options have been combined for the purpose of increasing the likelihood of having enough responses to be included in the analysis. Should the number be high enough, we will revisit separating out options in future surveys.
b Respondents were instructed to mark all races that apply.
c Includes individuals who indicated they were American Indian, Asian/PI, or “Other” race.
d Southeast Michigan includes the following counties: Livingston, Jackson, Washtenaw, Hillsdale, Lenawee and Monroe.
e Detroit Metro includes the following counties: Oakland, Wayne, and Macomb.
f Includes individuals who indicated they live in Michigan but did not provide a zip code.
* Data are suppressed if count is less than 10 or sample population was less than 20.
Average Hours per Week Working as a Nurse (RNs & LPNs)
| Years | RN = 11,141 | LPN = 975 | ||
|---|---|---|---|---|
| Estimate | 95% CI | Estimate | 95% CI | |
| <30 hours | 15.8% | (15.1%, 16.5%) | 16.6% | (14.4%, 19.1%) |
| 30-39 hours | 36.5% | (35.6%, 37.4%) | 30.3% | (27.5%, 33.3%) |
| 40-49 hours | 40.1% | (39.2%, 41.0%) | 43.1% | (40.0%, 46.2%) |
| 50+ hours | 7.7% | (7.2%, 8.2%) | 10.0% | (8.3%, 12.0%) |
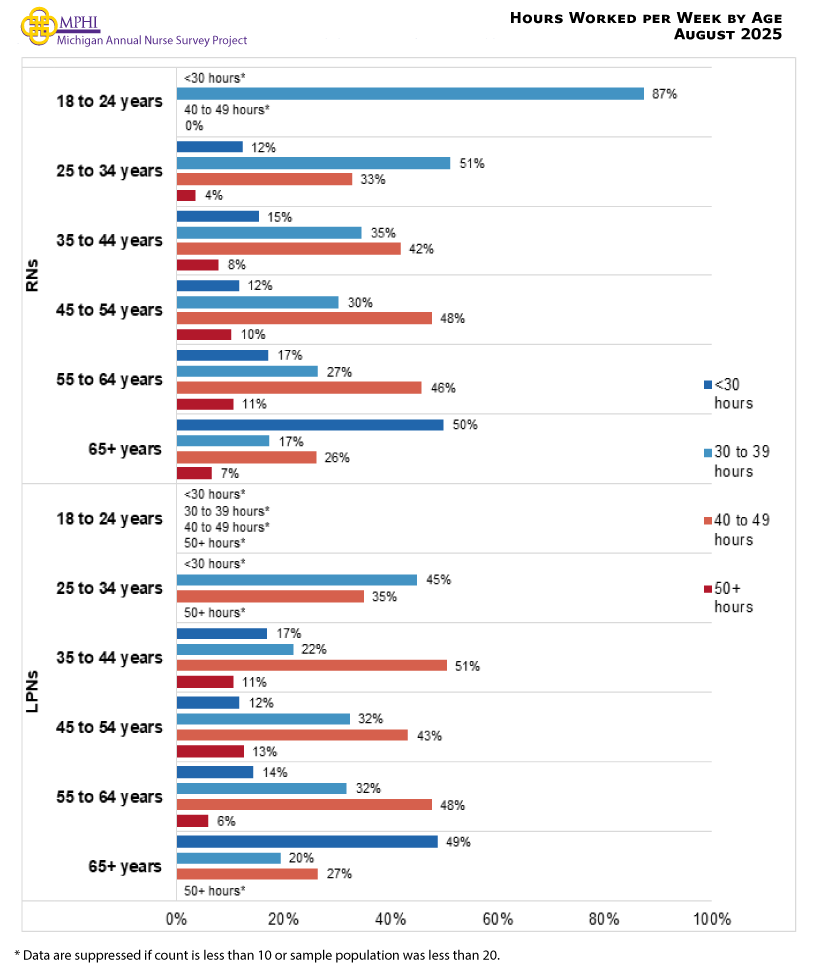
Hours Worked per Week by Age
Number of Years Working as a Nurse (RNs & LPNs)
| Years | RN = 10,267 | LPN = 864 | ||
|---|---|---|---|---|
| Estimate | 95% CI | Estimate | 95% CI | |
| Less than 3 years | 9.9% | (9.3%, 10.5%) | 17.0% | (14.6%, 19.6%) |
| 3 to less than 6 years | 11.2% | (10.6%, 11.8%) | 13.5% | (11.4%, 15.9%) |
| 6 to less than 10 years | 13.6% | (13.0%, 14.3%) | 11.0% | (9.1%, 13.3%) |
| 10 to less than 20 years | 30.7% | (29.8%, 31.6%) | 28.1% | (25.2%, 31.2%) |
| 20 or more years | 34.6% | (33.7%, 35.5%) | 30.5% | (27.5%, 33.7%) |
Number of Years Working as a Nurse (APNs only)
| Years | APN = 1,239 | |
|---|---|---|
| Estimate | 95% CI | |
| Less than 3 years | * | * |
| 3 to less than 6 years | 4.6% | (3.6%, 5.9%) |
| 6 to less than 10 years | 11.1% | (9.5%, 13.0%) |
| 10 to less than 20 years | 43.3% | (40.6%, 46.1%) |
| 20 or more years | 40.4% | (37.7%, 43.2%) |
* Data are suppressed if count is less than 10 or sample population was less than 20.
Number of Currently Employed Nursing Positions
| Number of Positions | RN = 11,134 | LPN = 974 | ||
|---|---|---|---|---|
| Estimate | 95% CI | Estimate | 95% CI | |
| 1 Position | 84.6% | (83.9%, 85.3%) | 81.8% | (79.3%, 84.1%) |
| 2 Position | 12.6% | (12.0%, 13.2%) | 14.8% | (12.7%, 17.2%) |
| 3+ Positions | 2.7% | (2.4%, 3.0%) | 3.4% | (2.4%, 4.7%) |
Employer Supports
| Supports | RN = 10,267 | LPN = 858 | ||
|---|---|---|---|---|
| Estimate | 95% CI | Estimate | 95% CI | |
| None of the below | 13.9% | (13.2%, 14.6%) | 37.0% | (33.8%, 40.3%) |
| Any Supports | ||||
| Tuition reimbursement | 62.5% | (61.6%, 63.4%) | 47.3% | (44.0%, 50.6%) |
| Paid time off for advancing nursing education | 5.5% | (5.1%, 6.0%) | 3.9% | (2.8%, 5.4%) |
| Paid time off for continuing education courses | 13.4% | (12.8%, 14.1%) | 3.9% | (2.8%, 5.4%) |
| Reimbursement for continuing education | 33.3% | (32.4%, 34.2%) | 16.0% | (13.7%, 18.6%) |
| Reimbursement for costs associated with obtaining advanced certification | 24.9% | (24.1%, 25.7%) | 5.8% | (4.4%, 7.6%) |
| Student loan repayment benefits | 11.2% | (10.6%, 11.8%) | 6.3% | (4.9%, 8.1%) |
| Nurse residency/Transitions to practice programs | 24.3% | (23.5%, 25.1%) | 3.2% | (2.2%, 4.6%) |
| Mentorship | 15.1% | (14.4%, 15.8%) | 4.6% | (3.4%, 6.2%) |
| Personal/mental health days separate from sick leave | 10.3% | (9.7%, 10.9%) | 8.9% | (7.2%, 11.0%) |
| Health and wellness stipends | 12.8% | (12.2%, 13.5%) | 5.8% | (4.4%, 7.6%) |
| Meditation/wellness app access | 20.8% | (20.0%, 21.6%) | 8.4% | (6.7%, 10.4%) |
| Access to counseling/mental health services/EAP | 52.4% | (51.4%, 53.4%) | 28.0% | (25.1%, 31.1%) |
| Housing supports | 1.5% | (1.3%, 1.8%) | * | * |
| Self-care services | 16.1% | (15.4%, 16.8%) | 7.7% | (6.1%, 9.7%) |
a Respondents were instructed to mark all that apply.
* Data are suppressed if count is less than 10 or sample population was less than 20.
Reason for Not Currently Working as a Nurse
| Reason | RN = 4,042 | LPN = 313 | ||
|---|---|---|---|---|
| Estimate | 95% CI | Estimate | 95% CI | |
| Retiring | 49.8% | (48.3%, 51.3%) | 35.8% | (30.7%, 41.3%) |
| Care for family or home | 24.8% | (23.5%, 26.2%) | 22.3% | (18.0%, 27.2%) |
| Enrolled in education program | 2.3% | (1.9%, 2.8%) | * | * |
| Difficulty finding a nursing position | 4.0% | (3.4%, 4.6%) | 15.2% | (11.6%, 19.6%) |
| Too stressful/Burned out | 27.9% | (26.5%, 29.3%) | 32.5% | (27.6%, 37.9%) |
| Difficulties with EMR/new technology | 2.2% | (1.8%, 2.7%) | * | * |
| Violence/safety issues | 6.2% | (5.5%, 7.0%) | * | * |
| Relocating/Moving to another area | 2.6% | (2.2%, 3.1%) | * | * |
| Temporary disability or long-term illness | 4.4% | (3.8%, 5.1%) | 6.0% | (3.9%, 9.2%) |
| Permanent disability leave | 0.8% | (0.6%, 1.1%) | * | * |
| Wages | 10.3% | (9.4%, 11.3%) | 13.8% | (10.4%, 18.1%) |
| Work Culture | 19.2% | (18.0%, 20.4%) | 12.8% | (9.5%, 17.0%) |
| Workload | 19.1% | (17.9%, 20.3%) | 19.2% | (15.2%, 23.9%) |
| Undesired schedule | 16.6% | (15.5%, 17.8%) | 18.5% | (14.6%, 23.2%) |
| Benefits and Employer Supports | 8.5% | (7.7%, 9.4%) | 7.3% | (4.9%, 10.7%) |
| Other | 9.2% | (8.3%, 10.1%) | 9.8% | (7.0%, 13.6%) |
a Respondents were instructed to mark all that apply.
* Data are suppressed if count is less than 10 or sample population was less than 20.
Retirement Status
| Status | RN = 3,138 | LPN = 199 | ||
|---|---|---|---|---|
| Estimate | 95% CI | Estimate | 95% CI | |
| No longer wish to work | 75.8% | (74.3%, 77.3%) | 66.3% | (59.5%, 72.5%) |
| Currently employed on a part-time basis in nursing | 2.6% | (2.1%, 3.2%) | * | * |
| Currently employed on a full-time basis in nursing | * | * | 0.0% | (0.0%, 1.9%) |
| Currently volunteering in nursing | 4.1% | (3.5%, 4.9%) | * | * |
| Currently employed outside of nursing | 2.6% | (2.1%, 3.2%) | * | * |
| Permanent disability leave | 2.1% | (1.7%, 2.7%) | * | * |
| Hiatus/temporarily not working in nursing | 6.9% | (6.1%, 7.8%) | 12.4% | (8.5%, 17.7%) |
| Currently seeking part-time clinical work | 1.7% | (1.3%, 2.2%) | * | * |
| Currently seeking full-time clinical work | * | * | 0.0% | (0.0%, 1.9%) |
| Currently seeking part-time non-clinical work | 2.5% | (2.0%, 3.1%) | * | * |
| Currently seeking full-time non-clinical work | * | * | 0.0% | (0.0%, 0.9%) |
| Currently seeking work outside of the nursing field | 1.6% | (1.2%, 2.1%) | * | * |
* Data are suppressed if count is less than 10 or sample population was less than 20.
Reason for Considering Returning to Nursing
| Reason | RN = 4,055 | LPN = 319 | ||
|---|---|---|---|---|
| Estimate | 95% CI | Estimate | 95% CI | |
| Work more readily available | 5.5% | (4.8%, 6.2%) | 11.0% | (8.0%, 14.9%) |
| Shorter shifts were available | 20.3% | (19.1%, 21.6%) | 23.4% | (19.1%, 28.3%) |
| More part-time jobs were available | 22.8% | (21.5%, 24.1%) | 22.3% | (18.1%, 27.2%) |
| More full-time jobs were available | 1.3% | (1.0%, 1.7%) | * | * |
| There was a safer work environment | 12.0% | (11.0%, 13.0%) | 11.9% | (8.8%, 15.9%) |
| There was a lower nurse/patient ratio | 23.4% | (22.1%, 24.7%) | 31.7% | (26.8%, 37.0%) |
| There was higher compensation | 21.8% | (20.6%, 23.1%) | 31.2% | (26.4%, 36.5%) |
| There were virtual options | 22.9% | (21.6%, 24.2%) | 19.0% | (15.1%, 23.7%) |
| There were more readily available skill refresher courses | 8.6% | (7.8%, 9.5%) | 9.3% | (6.6%, 13.0%) |
| There were external supports for family obligations | 10.2% | (9.3%, 11.2%) | 12.0% | (8.9%, 16.0%) |
| Not looking to return to nursing | 51.8% | (50.3%, 53.3%) | 40.3% | (35.1%, 45.8%) |
a Respondents were instructed to mark all that apply.
* Data are suppressed if count is less than 10 or sample population was less than 20.
Employment Setting
Practice Setting
| Setting | RN = 11,032 | LPN = 962 | ||
|---|---|---|---|---|
| Estimate | 95% CI | Estimate | 95% CI | |
| Acute Care | 51.7% | (50.8%, 52.6%) | 14.3% | (12.2%, 16.7%) |
| Ambulatory Care | 23.3% | (22.5%, 24.1%) | 16.0% | (13.8%, 18.5%) |
| Community Health | 5.6% | (5.2%, 6.0%) | 12.3% | (10.4%, 14.5%) |
| Corrections | 1.3% | (1.1%, 1.5%) | 2.7% | (1.8%, 3.9%) |
| Emergent and Urgent Care | 11.7% | (11.1%, 12.3%) | 3.4% | (2.4%, 4.7%) |
| Long-term Care | 6.0% | (5.6%, 6.5%) | 51.6% | (48.4%, 54.7%) |
| Mobile and Home Care | 5.0% | (4.6%, 5.4%) | 16.6% | (14.4%, 19.1%) |
| Non-clinical | 11.2% | (10.6%, 11.8%) | 9.3% | (7.6%, 11.3%) |
| Public Health | 4.1% | (3.7%, 4.5%) | 2.0% | (1.3%, 3.1%) |
| School of Nursing | 4.7% | (4.3%, 5.1%) | 1.4% | (0.8%, 2.4%) |
| School Health | 2.0% | (1.8%, 2.3%) | 3.1% | (2.2%, 4.4%) |
| Other Community-based Healthcare | 3.7% | (3.4%, 4.1%) | 15.6% | (13.4%, 18.0%) |
| Other Community-based Care | 2.0% | (1.8%, 2.3%) | 1.3% | (0.8%, 2.2%) |
a Respondents were instructed to mark all that apply.
Position and Role
| Position | RN = 10,636 | LPN = 901 | ||
|---|---|---|---|---|
| Estimate | 95% CI | Estimate | 95% CI | |
| Staff Nurse | 59.2% | (58.3%, 60.1%) | 75.0% | (72.2%, 77.6%) |
| Faculty | 4.5% | (4.1%, 4.9%) | * | * |
| Education, Research, and Consulting | 9.3% | (8.8%, 9.9%) | 3.3% | (2.3%, 4.6%) |
| School Nurse | 1.7% | (1.5%, 2.0%) | 3.2% | (2.3%, 4.5%) |
| Telehealth | 4.6% | (4.2%, 5.0%) | 2.7% | (1.8%, 3.9%) |
| Travel Nurse | 2.7% | (2.4%, 3.0%) | 3.7% | (2.7%, 5.1%) |
| Executives | 4.8% | (4.4%, 5.2%) | 3.7% | (2.7%, 5.1%) |
| Patient Educator | 11.1% | (10.5%, 11.7%) | 11.2% | (9.4%, 13.3%) |
| APN | 11.4% | (10.8%, 12.0%) | * | * |
| Managerial | 9.0% | (8.5%, 9.5%) | 13.7% | (11.7%, 16.0%) |
| Military Health Services | 0.6% | (0.5%, 0.8%) | 1.4% | (0.8%, 2.4%) |
| Other Health Services | 14.5% | (13.9%, 15.2%) | 11.3% | (9.5%, 13.5%) |
| Other Health Non-related | 0.4% | (0.3%, 0.5%) | * | * |
a Respondents were instructed to mark all that apply.
* Data are suppressed if count is less than 10 or sample population was less than 20.
Specialties
| Specialty | RN = 10,494 | LPN = 887 | ||
|---|---|---|---|---|
| Estimate | 95% CI | Estimate | 95% CI | |
| Adult Health | 23.1% | (22.3%, 23.9%) | 37.3% | (34.3%, 40.4%) |
| Critical Care | 17.9% | (17.2%, 18.6%) | 4.9% | (3.7%, 6.5%) |
| Medical-Surgical and Wound Care | 17.3% | (16.6%, 18.0%) | 26.1% | (23.4%, 29.0%) |
| Community Care | 5.1% | (4.7%, 5.5%) | 4.4% | (3.3%, 5.9%) |
| Care Management | 12.0% | (11.4%, 12.6%) | 7.8% | (6.3%, 9.7%) |
| Behavioral Health | 7.3% | (6.8%, 7.8%) | 7.4% | (5.9%, 9.2%) |
| Anesthesia | 3.5% | (3.2%, 3.9%) | * | * |
| Women and Infants Health | 9.5% | (9.0%, 10.1%) | 2.9% | (2.0%, 4.2%) |
| Child and Family Health | 12.8% | (12.2%, 13.4%) | 18.9% | (16.6%, 21.5%) |
| Specialty Care | 15.3% | (14.6%, 16.0%) | 4.5% | (3.4%, 6.0%) |
| Hospice | 5.3% | (4.9%, 5.7%) | 10.7% | (8.9%, 12.8%) |
| Academia | 4.0% | (3.7%, 4.4%) | 2.2% | (1.4%, 3.3%) |
| Surgical Services | 11.0% | (10.4%, 11.6%) | 1.9% | (1.2%, 3.0%) |
| Occupational Health and Transitions of Care | 4.2% | (3.8%, 4.6%) | 5.7% | (4.4%, 7.3%) |
| Dialysis Nurse | 1.9% | (1.7%, 2.2%) | * | * |
| Rehabilitation | 4.3% | (3.9%, 4.7%) | 24.9% | (22.3%, 27.7%) |
| Phlebotomy, Testing, and Diagnostics | 2.4% | (2.1%, 2.7%) | 3.2% | (2.3%, 4.5%) |
| Geriatric Care | 10.2% | (9.6%, 10.8%) | 44.1% | (41.0%, 47.3%) |
| Other Non-clinical Specialties | 1.8% | (1.6%, 2.1%) | 1.4% | (0.8%, 2.4%) |
| Other | 14.6% | (14.0%, 15.3%) | 16.1% | (13.9%, 18.6%) |
a Respondents were instructed to mark all that apply.
* Data are suppressed if count is less than 10 or sample population was less than 20.
Change in Employment Setting
| Change in Employment Setting | RN = 10,442 | LPN = 875 | ||
|---|---|---|---|---|
| Estimate | 95% CI | Estimate | 95% CI | |
| Did not make a change | 58.7% | (57.8%, 59.6%) | 54.5% | (51.2%, 57.8%) |
| Among those who DID make a change: | ||||
| An inpatient setting to a community-based setting? | 5.0% | (4.6%, 5.4%) | 5.1% | (3.8%, 6.8%) |
| An inpatient setting to an outpatient setting? | 1.8% | (1.6%, 2.1%) | 2.4% | (1.6%, 3.6%) |
| A primary care setting (e.g., family practice, general medicine) to a specialty care setting? | 2.2% | (1.9%, 2.5%) | 1.9% | (1.2%, 3.0%) |
| A specialty care setting to a primary care setting? | 1.1% | (0.9%, 1.3%) | * | * |
| A sub-acute care setting to an acute care setting? | 1.2% | (1.0%, 1.4%) | 1.5% | (0.9%, 2.5%) |
| An acute care setting to a sub-acute care setting? | 1.5% | (1.3%, 1.8%) | * | * |
| A direct patient care setting to a non-direct patient care setting? | 5.4% | (5.0%, 5.9%) | 4.6% | (3.4%, 6.2%) |
| A non-direct patient care setting to a direct patient care setting? | 1.6% | (1.4%, 1.9%) | 2.3% | (1.5%, 3.5%) |
| I changed locations but stayed in the same care setting. | 11.5% | (10.9%, 12.1%) | 14.4% | (12.2%, 16.9%) |
| Some other type of change in employment. | 14.9% | (14.2%, 15.6%) | 17.1% | (14.8%, 19.7%) |
a Respondents were instructed to mark all that apply.
* Data are suppressed if count is less than 10 or sample population was less than 20.
Reason for Change in Employment
| Reason | RN = 3,764 | LPN = 354 | ||
|---|---|---|---|---|
| Estimate | 95% CI | Estimate | 95% CI | |
| Preparing to retire | 5.5% | (4.8%, 6.3%) | 4.5% | (2.8%, 7.2%) |
| Care for home or family | 13.3% | (12.3%, 14.4%) | 9.9% | (7.2%, 13.5%) |
| Completed educational program | 10.9% | (9.9%, 11.9%) | 7.2% | (4.9%, 10.4%) |
| Changing to preferred nursing position | 23.9% | (22.6%, 25.3%) | 20.7% | (16.8%, 25.2%) |
| Seeking a less stressful position/setting | 42.9% | (41.3%, 44.5%) | 43.6% | (38.5%, 48.8%) |
| Difficulties with EMR/New technology | 0.3% | (0.2%, 0.5%) | * | * |
| Violence/safety Issues | 10.0% | (9.1%, 11.0%) | 8.1% | (5.7%, 11.4%) |
| Relocating/moving to another area | 12.7% | (11.7%, 13.8%) | 7.6% | (5.3%, 10.8%) |
| Temporary disability or long-term illness | 1.4% | (1.1%, 1.8%) | * | * |
| Permanent disability leave | * | * | 0.0% | (0.0%, 0.1%) |
| Wages | 28.1% | (26.7%, 29.6%) | 29.5% | (25.0%, 34.5%) |
| Work culture | 33.5% | (32.0%, 35.0%) | 28.7% | (24.2%, 33.6%) |
| Workload | 31.0% | (29.5%, 32.5%) | 33.2% | (28.5%, 38.3%) |
| Better schedule | 41.5% | (39.9%, 43.1%) | 38.3% | (33.4%, 43.5%) |
| Benefits and employer supports | 15.4% | (14.3%, 16.6%) | 16.8% | (13.3%, 21.0%) |
| Other | 8.6% | (7.7%, 9.5%) | 10.5% | (7.7%, 14.1%) |
a Respondents were instructed to mark all that apply.
* Data are suppressed if count is less than 10 or sample population was less than 20.
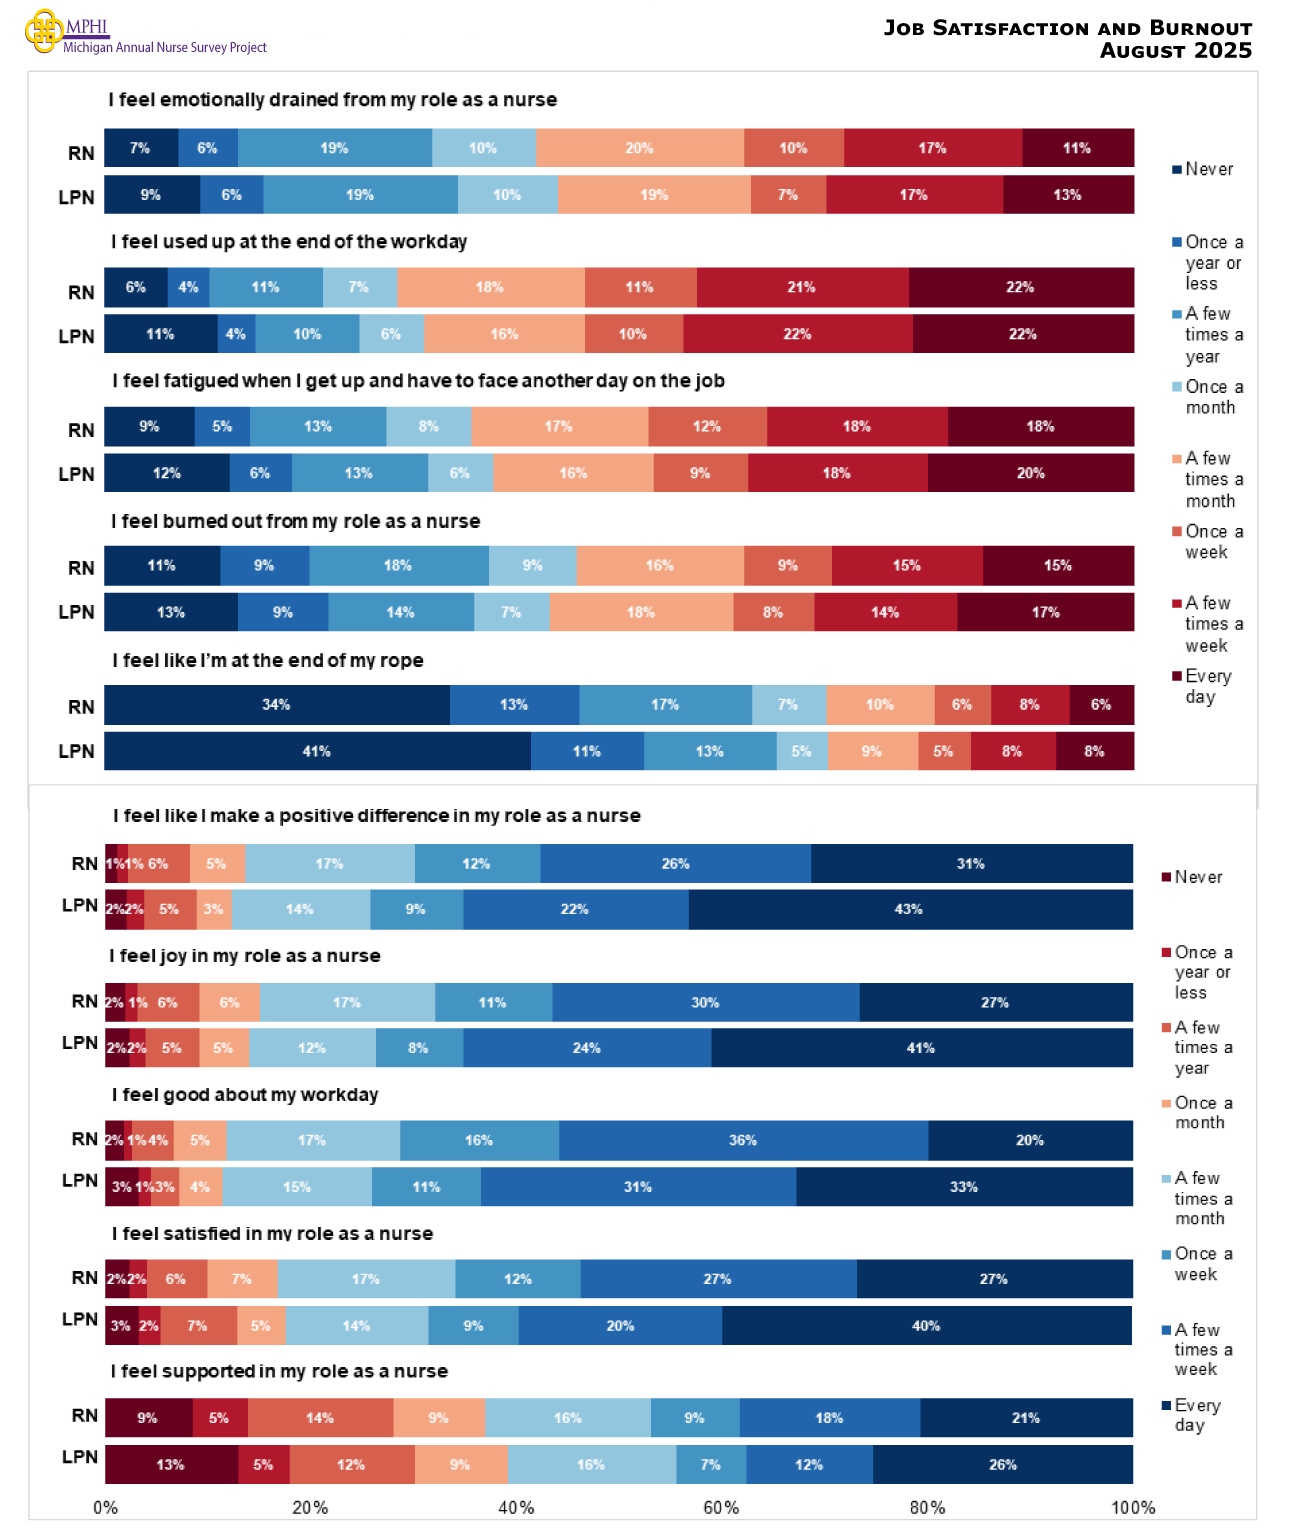
Job Satisfaction and Burnout
Job Satisfaction and Burnout
Nurses Experiencing Burnout At Least Once a Week by Setting
| Setting | RN = 13,316 | LPN = 1,208 | ||
|---|---|---|---|---|
| Estimate | 95% CI | Estimate | 95% CI | |
| Acute Care | 43.4% | (42.0%, 44.8%) | 35.0% | (26.1%, 45.1%) |
| Ambulatory Care | 35.1% | (33.2%, 37.0%) | 35.1% | (28.1%, 42.8%) |
| Community Health | 34.5% | (30.9%, 38.3%) | 37.6% | (28.4%, 47.8%) |
| Corrections | 41.5% | (33.3%, 50.2%) | 56.4% | (36.3%, 74.6%) |
| Emergent and Urgent Care | 47.5% | (44.5%, 50.5%) | 52.7% | (33.8%, 70.9%) |
| Long-term Care | 40.6% | (36.9%, 44.4%) | 45.8% | (41.0%, 50.7%) |
| Mobile and Home Care | 29.3% | (25.8%, 33.1%) | 25.8% | (19.5%, 33.3%) |
| Non-clinical | 27.2% | (24.9%, 29.6%) | 30.4% | (21.9%, 40.5%) |
| Public Health | 33.2% | (28.9%, 37.8%) | * | * |
| School of Nursing | 30.5% | (26.8%, 34.5%) | * | * |
| School Health | 25.1% | (19.5%, 31.6%) | * | * |
| Other Community-based Healthcare | 31.5% | (27.1%, 36.2%) | 35.9% | (27.8%, 44.9%) |
| Other Community-based Care | 28.1% | (22.6%, 34.3%) | * | * |
* Data are suppressed if count is less than 10 or sample population was less than 20.
Nurses Experiencing Burnout At Least Once a Week by Position
| Position | RN = 13,824 | LPN = 1,125 | ||
|---|---|---|---|---|
| Estimate | 95% CI | Estimate | 95% CI | |
| Staff Nurse | 42.2% | (40.9%, 43.5%) | 40.5% | (36.7%, 44.4%) |
| Faculty | 30.8% | (27.0%, 34.9%) | * | * |
| Education, Research, and Consulting | 31.3% | (28.6%, 34.1%) | * | * |
| School Nurse | 24.6% | (18.8%, 31.4%) | * | * |
| Telehealth | 35.4% | (31.3%, 39.7%) | * | * |
| Travel Nurse | 49.6% | (43.5%, 55.7%) | 46.4% | (30.2%, 63.4%) |
| Executives | 35.8% | (31.9%, 39.9%) | 34.4% | (20.8%, 51.2%) |
| Patient Educator | 29.5% | (27.1%, 32.0%) | 22.1% | (15.5%, 30.5%) |
| APN | 35.7% | (32.9%, 38.6%) | * | * |
| Managerial | 41.3% | (38.2%, 44.4%) | 43.5% | (34.5%, 52.9%) |
| Military Health Services | 40.5% | (29.0%, 53.1%) | * | * |
| Other Health Services | 32.6% | (30.4%, 34.9%) | 24.5% | (17.4%, 33.4%) |
| Other Health Non-related | 22.3% | (13.4%, 34.8%) | * | * |
* Data are suppressed if count is less than 10 or sample population was less than 20.
Nurses Experiencing Burnout At Least Once a Week by Specialty
| Specialty | RN = 18,483 | LPN = 1,825 | ||
|---|---|---|---|---|
| Estimate | 95% CI | Estimate | 95% CI | |
| Adult Health | 42.2% | (40.2%, 44.3%) | 40.5% | (35.1%, 46.1%) |
| Critical Care | 44.9% | (42.4%, 47.5%) | 51.0% | (35.6%, 66.2%) |
| Medical-Surgical and Wound Care | 47.6% | (45.2%, 50.0%) | 42.7% | (36.0%, 49.7%) |
| Community Care | 37.1% | (33.1%, 41.3%) | 30.4% | (17.7%, 46.9%) |
| Care Management | 34.5% | (32.0%, 37.1%) | 34.8% | (24.1%, 47.2%) |
| Behavioral Health | 42.5% | (39.0%, 46.0%) | 49.8% | (37.6%, 62.0%) |
| Anesthesia | 34.7% | (30.0%, 39.8%) | * | * |
| Women and Infants Health | 37.4% | (34.3%, 40.6%) | 45.4% | (28.7%, 63.3%) |
| Child and Family Health | 38.1% | (35.4%, 40.9%) | 33.6% | (27.0%, 40.9%) |
| Specialty Care | 44.4% | (41.8%, 47.0%) | 38.2% | (25.1%, 53.3%) |
| Hospice | 41.2% | (37.2%, 45.3%) | 48.8% | (38.6%, 59.1%) |
| Academia | 30.4% | (26.4%, 34.7%) | 70.1% | (44.9%, 87.1%) |
| Surgical Services | 37.6% | (34.9%, 40.4%) | * | * |
| Occupational Health and Transitions of Care | 39.2% | (34.9%, 43.7%) | 41.1% | (27.7%, 55.9%) |
| Dialysis Nurse | 34.3% | (28.2%, 41.0%) | * | * |
| Rehabilitation | 41.6% | (37.2%, 46.1%) | 44.8% | (37.5%, 52.3%) |
| Phlebotomy, Testing, and Diagnostics | 39.8% | (34.0%, 45.9%) | * | * |
| Geriatric Care | 42.1% | (39.2%, 45.1%) | 45.4% | (40.3%, 50.6%) |
| Other Non-clinical Specialties | 21.6% | (16.5%, 27.8%) | * | * |
| Other | 34.5% | (32.3%, 36.8%) | 38.7% | (31.4%, 46.6%) |
* Data are suppressed if count is less than 10 or sample population was less than 20.
Direct Care
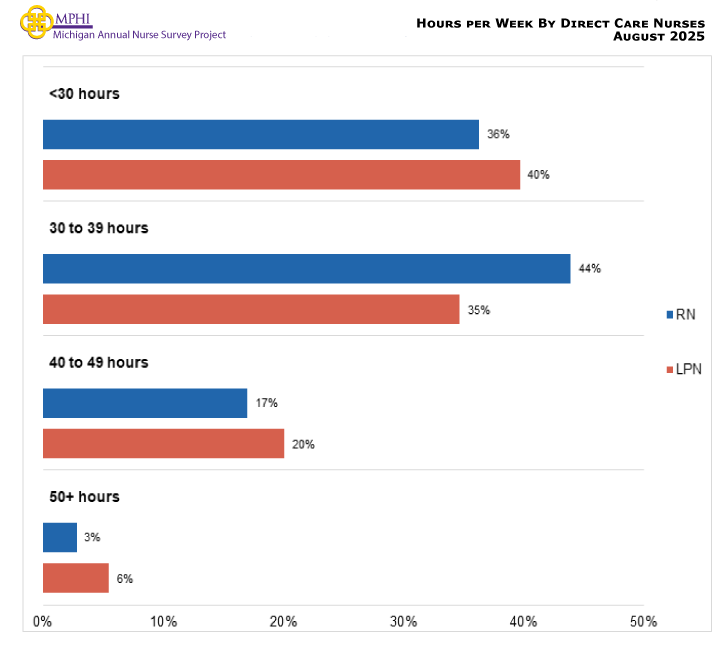
Hours Worked per Week by Direct Care Nurses
Direct Care Place of Employment Currently Accepting New Patients
| Accepting New Patients | RN = 10,796 | LPN = 943 | ||||
|---|---|---|---|---|---|---|
| N | Estimate | 95% CI | N | Estimate | 95% CI | |
| Yes | 9,488 | 89.0% | (88.4%, 89.6%) | 807 | 85.9% | (83.5%, 88.0%) |
| No | 586 | 4.2% | (3.8%, 4.6%) | 54 | 5.3% | (4.0%, 6.9%) |
| Unknown | 722 | 6.8% | (6.3%, 7.3%) | 82 | 8.8% | (7.2%, 10.8%) |
Direct Care Place of Employment Currently Accepting Medicaid Patients
| Accepting Medicaid Patients | RN = 10,797 | LPN = 942 | ||||
|---|---|---|---|---|---|---|
| N | Estimate | 95% CI | N | Estimate | 95% CI | |
| Yes | 8,257 | 78.2% | (77.4%, 79.0%) | 624 | 67.5% | (64.4%, 70.4%) |
| No | 987 | 7.3% | (6.8%, 7.8%) | 119 | 12.2% | (10.3%, 14.4%) |
| Unknown | 1,553 | 14.5% | (13.8%, 15.2%) | 199 | 20.3% | (17.9%, 23.0%) |
Direct Care Place of Employment Services to the Following Populations
| Populations Served | RN = 10,512 | LPN = 920 | ||||
|---|---|---|---|---|---|---|
| N | Estimate | 95% CI | N | Estimate | 95% CI | |
| Medicaid patients | 8,201 | 78.5% | (77.7%, 79.3%) | 620 | 67.3% | (64.2%, 70.3%) |
| American Indian/Alaska Native | 6,202 | 60.5% | (59.6%, 61.4%) | 352 | 37.1% | (34.0%, 40.3%) |
| Homeless | 6,968 | 68.0% | (67.1%, 68.9%) | 388 | 42.5% | (39.3%, 45.7%) |
| Migrant Farmworker | 4,907 | 49.2% | (48.2%, 50.2%) | 195 | 20.8% | (18.3%, 23.5%) |
| Migrant Seasonal Farmworker | 7,650 | 74.2% | (73.4%, 75.0%) | 433 | 46.8% | (43.6%, 50.0%) |
| Non-English speakers | 1,869 | 17.7% | (17.0%, 18.4%) | 259 | 28.1% | (25.3%, 31.1%) |
Nurse Preceptorship
Challenges for Retaining Preceptors
| Challenges | RN = 10,471 | LPN = 897 | ||||
|---|---|---|---|---|---|---|
| N | Estimate | 95% CI | N | Estimate | 95% CI | |
| I am not aware of any challenges | 4,704 | 41.4% | (40.5%, 42.3%) | 557 | 60.1% | (56.9%, 63.3%) |
| Lack of financial incentive for precepting students | 3,982 | 43.0% | (42.1%, 44.0%) | 194 | 24.3% | (21.6%, 27.2%) |
| Lack of time | 2,661 | 28.3% | (27.4%, 29.2%) | 120 | 16.0% | (13.7%, 18.5%) |
| Lack of Interest | 2,377 | 26.2% | (25.4%, 27.1%) | 134 | 17.1% | (14.8%, 19.7%) |
| Other | 579 | 4.7% | (4.3%, 5.1%) | 44 | 4.0% | (2.9%, 5.5%) |
Challenges for Obtaining Clinical Access for Students
| Challenges | RN = 10,362 | LPN = 884 | ||||
|---|---|---|---|---|---|---|
| N | Estimate | 95% CI | N | Estimate | 95% CI | |
| I am not aware of any challenges | 6,984 | 67.0% | (66.1%, 67.9%) | 687 | 77.9% | (75.0%, 80.5%) |
| Greater number of students than clinical setting in my geographic area | 1,622 | 16.4% | (15.7%, 17.1%) | 41 | 5.0% | (3.7%, 6.6%) |
| Clinical settings are not willing to have nursing students | 1,483 | 16.1% | (15.4%, 16.8%) | 110 | 13.8% | (11.7%, 16.2%) |
| My organization only accepts preceptor placement if I paid | 133 | 1.4% | (1.2%, 1.6%) | 20 | 2.3% | (1.5%, 3.5%) |
| Other | 674 | 5.4% | (5.0%, 5.9%) | 47 | 4.0% | (2.9%, 5.5%) |
Awareness of Continuing Education Credits for Precepting
| Awareness | RN = 10,584 | LPN = 902 | ||||
|---|---|---|---|---|---|---|
| N | Estimate | 95% CI | N | Estimate | 95% CI | |
| Yes | 2,633 | 25.5% | (24.7%, 26.3%) | 180 | 20.7% | (18.2%, 23.5%) |
| No | 7,951 | 74.5% | (73.7%, 75.3%) | 722 | 79.3% | (76.5%, 81.8%) |
Plans to Continue Nursing
Plans to Continue Working as a Nurse
| Years | RN = 10,228 | LPN = 856 | ||
|---|---|---|---|---|
| Estimate | 95% CI | Estimate | 95% CI | |
| Less than 2 years | 7.5% | (7.0%, 8.0%) | 5.3% | (4.0%, 7.0%) |
| 2 to 5 years | 13.8% | (13.1%, 14.5%) | 14.7% | (12.5%, 17.2%) |
| 6 to 10 years | 15.3% | (14.6%, 16.0%) | 16.3% | (14.0%, 18.9%) |
| More than 10 years | 53.4% | (52.4%, 54.4%) | 46.8% | (43.5%, 50.1%) |
| Do not know | 10.0% | (9.4%, 10.6%) | 16.9% | (14.5%, 19.6%) |
Plans to Work Five Years or Less by Setting
| Setting | RN = 12,198 | LPN = 1,022 | ||||
|---|---|---|---|---|---|---|
| N | % | 95% CI | N | % | 95% CI | |
| Acute Care | 4,203 | 21.0% | (19.8%, 22.3%) | 82 | 13.6% | (7.8%, 22.7%) |
| Ambulatory Care | 2,302 | 22.8% | (21.1%, 24.6%) | 141 | 25.3% | (18.8%, 33.1%) |
| Community Health | 578 | 21.7% | (18.5%, 25.2%) | 78 | 14.3% | (8.2%, 23.7%) |
| Corrections | 119 | 21.0% | (14.6%, 29.2%) | * | * | * |
| Emergent and Urgent Care | 927 | 18.5% | (16.1%, 21.1%) | * | * | * |
| Long-term Care | 605 | 25.3% | (22.0%, 28.9%) | 327 | 20.9% | (16.8%, 25.6%) |
| Mobile and Home Care | 544 | 27.1% | (23.5%, 31.0%) | 124 | 28.7% | (21.5%, 37.2%) |
| Non-clinical | 1,258 | 27.1% | (24.7%, 29.6%) | 74 | 34.3% | (24.5%, 45.6%) |
| Public Health | 399 | 23.8% | (19.9%, 28.2%) | * | * | * |
| School of Nursing | 516 | 22.1% | (18.7%, 25.9%) | * | * | * |
| School Health | 178 | 20.2% | (15.0%, 26.7%) | * | * | * |
| Other Community-based Healthcare | 368 | 22.8% | (18.8%, 27.4%) | 104 | 16.5% | (10.6%, 24.8%) |
| Other Community-based Care | 201 | 23.0% | (17.7%, 29.3%) | * | * | * |
a Respondents were instructed to mark all that apply.
* Data are suppressed if count is less than 10 or sample population was less than 20.
Plans to Work Five Years or Less by Position
| Position | RN = 12,710 | LPN = 959 | ||||
|---|---|---|---|---|---|---|
| N | % | 95% CI | N | % | 95% CI | |
| Staff Nurse | 4,973 | 23.1% | (21.9%, 24.3%) | 523 | 23.2% | (19.8%, 27.0%) |
| Faculty | 496 | 20.8% | (17.5%, 24.6%) | * | * | * |
| Education, Research, and Consulting | 1,029 | 23.5% | (21.0%, 26.2%) | * | * | * |
| School Nurse | 162 | 22.7% | (16.9%, 29.7%) | * | * | * |
| Telehealth | 464 | 20.5% | (17.1%, 24.4%) | 25 | 32.0% | (17.2%, 51.6%) |
| Travel Nurse | 227 | 32.9% | (27.1%, 39.3%) | 29 | 32.1% | (18.1%, 50.3%) |
| Executives | 544 | 22.3% | (19.0%, 26.0%) | * | * | * |
| Patient Educator | 1,213 | 26.2% | (23.8%, 28.7%) | 96 | 25.3% | (17.7%, 34.8%) |
| APN | 1,042 | 15.3% | (13.2%, 17.6%) | * | * | * |
| Managerial | 906 | 20.7% | (18.2%, 23.5%) | 94 | 18.9% | (12.3%, 28.0%) |
| Military Health Services | 57 | 18.5% | (10.5%, 30.4%) | * | * | * |
| Other Health Services | 1,549 | 25.6% | (23.5%, 27.8%) | 95 | 28.8% | (20.7%, 38.6%) |
| Other Health Non-related | 48 | 28.4% | (17.6%, 42.4%) | * | * | * |
a Respondents were instructed to mark all that apply.
* Data are suppressed if count is less than 10 or sample population was less than 20.
Plans to Work Five Years or Less by Specialty
| Specialty | RN = 16,842 | LPN = 1,531 | ||||
|---|---|---|---|---|---|---|
| N | % | 95% CI | N | % | 95% CI | |
| Adult Health | 2,033 | 20.3% | (18.6%, 22.1%) | 249 | 21.6% | (16.9%, 27.1%) |
| Critical Care | 1,306 | 20.5% | (18.4%, 22.8%) | * | * | * |
| Medical-Surgical and Wound Care | 1,436 | 18.6% | (16.7%, 20.7%) | 171 | 20.7% | (15.3%, 27.4%) |
| Community Care | 497 | 23.1% | (19.6%, 27.0%) | * | * | * |
| Care Management | 1,260 | 24.2% | (21.9%, 26.6%) | 53 | 18.4% | (10.2%, 30.8%) |
| Behavioral Health | 698 | 21.3% | (18.4%, 24.5%) | 52 | 15.9% | (8.4%, 28.1%) |
| Anesthesia | 337 | 23.9% | (19.7%, 28.7%) | * | * | * |
| Women and Infants Health | 833 | 20.7% | (18.1%, 23.6%) | * | * | * |
| Child and Family Health | 1,089 | 19.5% | (17.3%, 22.0%) | 151 | 23.9% | (17.8%, 31.3%) |
| Specialty Care | 1,284 | 20.8% | (18.7%, 23.1%) | 33 | 40.0% | (25.2%, 56.9%) |
| Hospice | 519 | 21.0% | (17.7%, 24.7%) | 67 | 17.2% | (10.0%, 27.9%) |
| Academia | 444 | 22.7% | (19.0%, 26.8%) | * | * | * |
| Surgical Services | 1,099 | 24.5% | (22.0%, 27.1%) | * | * | * |
| Occupational Health and Transitions of Care | 426 | 23.0% | (19.3%, 27.2%) | 37 | 21.9% | (11.6%, 37.5%) |
| Dialysis Nurse | 189 | 23.9% | (18.4%, 30.5%) | * | * | * |
| Rehabilitation | 420 | 20.9% | (17.3%, 25.0%) | 135 | 17.9% | (12.3%, 25.2%) |
| Phlebotomy, Testing, and Diagnostics | 234 | 22.6% | (17.7%, 28.4%) | 28 | 24.1% | (12.0%, 42.4%) |
| Geriatric Care | 1,001 | 21.3% | (18.9%, 23.9%) | 295 | 23.3% | (18.8%, 28.4%) |
| Other Non-clinical Specialties | 186 | 24.7% | (19.1%, 31.4%) | * | * | * |
| Other Specialties | 1,551 | 28.5% | (26.3%, 30.8%) | 132 | 31.7% | (24.4%, 40.1%) |
a Respondents were instructed to mark all that apply.
* Data are suppressed if count is less than 10 or sample population was less than 20.
Reason for Leaving Nursing for those Leaving Nursing in Less than Five Year
| Reason | RN = 3,485 | LPN = 243 | ||
|---|---|---|---|---|
| Estimate | 95% CI | Estimate | 95% CI | |
| Retiring | 70.2% | (68.7%, 71.7%) | 63.7% | (57.5%, 69.5%) |
| Care for home or family | 9.1% | (8.2%, 10.1%) | 5.7% | (3.4%, 9.4%) |
| Enrolled in education program | 4.0% | (3.4%, 4.7%) | * | * |
| Difficulty finding a nursing position | 0.8% | (0.6%, 1.2%) | * | * |
| Too stressful/burned out | 30.9% | (29.4%, 32.5%) | 31.8% | (26.3%, 37.9%) |
| Difficulties with EMR/new technology | 1.7% | (1.3%, 2.2%) | * | * |
| Violence/safety issues | 11.9% | (10.9%, 13.0%) | 8.1% | (5.3%, 12.2%) |
| Relocating/moving to another area | 2.5% | (2.0%, 3.1%) | * | * |
| Temporary disability or long-term illness | 0.9% | (0.6%, 1.3%) | * | * |
| Permanent disability leave | 0.5% | (0.3%, 0.8%) | * | * |
| Wages | 16.2% | (15.0%, 17.5%) | 11.1% | (7.7%, 15.7%) |
| Work culture | 19.3% | (18.0%, 20.6%) | 12.0% | (8.5%, 16.7%) |
| Workload | 24.8% | (23.4%, 26.3%) | 25.9% | (20.8%, 31.8%) |
| Better Schedule | 12.0% | (11.0%, 13.1%) | 11.9% | (8.4%, 16.6%) |
| Benefits and employer supports | 12.1% | (11.1%, 13.2%) | 8.7% | (5.8%, 12.9%) |
| Other | 1.7% | (1.3%, 2.2%) | * | * |
a Respondents were instructed to mark all that apply.
b Other includes reasons such as family care, not enjoying the profession and/or needing a change, a few respondents mentioned concerns about COVID-19.
* Data are suppressed if count is less than 10 or sample population was less than 20.
Reasons for Leaving Nursing for those Leaving Nursing in Less than Five Years by Region of Residence
| Reason | Upper Peninsula | Northwest LP | Northeast LP | West/West Central | East Central | East | South Central | Southwest | Southeast | Detroit Metro |
|---|---|---|---|---|---|---|---|---|---|---|
| N | N | N | N | N | N | N | N | N | N | |
| Estimate | Estimate | Estimate | Estimate | Estimate | Estimate | Estimate | Estimate | Estimate | Estimate | |
| 95% CI | 95% CI | 95% CI | 95% CI | 95% CI | 95% CI | 95% CI | 95% CI | 95% CI | 95% CI | |
| Retiring | 108 | 149 | 86 | 465 | 176 | 203 | 123 | 231 | 323 | 901 |
| 72.9% | 68.2% | 72.1% | 73.6% | 65.2% | 73.3% | 69.6% | 79.1% | 73.5% | 65.7% | |
| (64.6%, 79.8%) | (60.9%, 74.7%) | (62.4%, 80.1%) | (69.7%, 77.2%) | (58.6%, 71.2%) | (67.4%, 78.5%) | (61.8%, 76.4%) | (73.8%, 83.6%) | (68.9%, 77.7%) | (62.8%, 68.5%) | |
| Care for home or family | 11 | 12 | * | 39 | 16 | 19 | * | 23 | 28 | 78 |
| 10.3% | 7.5% | * | 8.9% | 7.6% | 10.0% | * | 11.3% | 8.2% | 10.1% | |
| (6.1%, 16.8%) | (4.4%, 12.4%) | * | (6.8%, 11.6%) | (4.8%, 11.9%) | (6.8%, 14.4%) | * | (8.0%, 15.7%) | (5.8%, 11.4%) | (8.4%, 12.0%) | |
| Too stressful/burned out | 31 | 36 | 27 | 89 | 53 | 67 | 33 | 43 | 64 | 230 |
| 36.4% | 36.6% | 43.1% | 25.7% | 36.3% | 34.9% | 34.8% | 24.1% | 21.9% | 32.2% | |
| (28.6%, 45.0%) | (29.7%, 44.0%) | (33.6%, 53.1%) | (22.2%, 29.6%) | (30.2%, 42.9%) | (29.2%, 41.1%) | (27.6%, 42.8%) | (19.3%, 29.6%) | (18.0%, 26.3%) | (29.5%, 35.0%) | |
| Violence/safety issues | * | * | 10 | 19 | 25 | 21 | 18 | 20 | 15 | 78 |
| * | * | 18.0% | 5.1% | 21.5% | 11.4% | 21.3% | 10.1% | 5.1% | 13.3% | |
| * | * | (11.6%, 26.9%) | (3.5%, 7.3%) | (16.5%, 27.5%) | (8.0%, 16.0%) | (15.5%, 28.6%) | (7.0%, 14.4%) | (3.3%, 7.8%) | (11.4%, 15.4%) | |
| Wages | 12 | 21 | * | 43 | 26 | 19 | 12 | 14 | 28 | 116 |
| 14.1% | 25.0% | * | 17.3% | 19.7% | 12.6% | 12.6% | 6.8% | 10.4% | 18.5% | |
| (9.1%, 21.2%) | (19.1%, 32.0%) | * | (14.3%, 20.8%) | (14.9%, 25.5%) | (9.0%, 17.4%) | (8.2%, 18.9%) | (4.3%, 10.5%) | (7.7%, 13.9%) | (16.3%, 20.9%) | |
| Work culture | 16 | 28 | 17 | 56 | 35 | 34 | 25 | 33 | 49 | 138 |
| 13.9% | 28.4% | 25.3% | 13.9% | 26.2% | 20.9% | 23.6% | 18.0% | 16.1% | 19.7% | |
| (9.0%, 21.0%) | (22.2%, 35.6%) | (17.7%, 34.8%) | (11.2%, 17.1%) | (20.8%, 32.5%) | (16.3%, 26.4%) | (17.5%, 31.1%) | (13.8%, 23.1%) | (12.8%, 20.1%) | (17.4%, 22.2%) | |
| Workload | 22 | 23 | 21 | 76 | 39 | 48 | 33 | 35 | 55 | 192 |
| 23.6% | 22.4% | 33.6% | 19.7% | 29.6% | 26.7% | 31.4% | 18.0% | 19.2% | 27.9% | |
| (17.1%, 31.7%) | (16.8%, 29.2%) | (24.9%, 43.5%) | (16.5%, 23.3%) | (23.9%, 36.0%) | (21.5%, 32.6%) | (24.5%, 39.3%) | (13.8%, 23.1%) | (15.6%, 23.4%) | (25.3%, 30.6%) | |
| Undesirable schedule | * | 15 | * | 31 | 20 | 24 | 16 | 16 | 23 | 82 |
| * | 15.0% | * | 10.4% | 14.2% | 12.5% | 16.0% | 9.5% | 8.6% | 12.8% | |
| * | (10.4%, 21.1%) | * | (8.1%, 13.3%) | (10.2%, 19.5%) | (8.9%, 17.3%) | (11.0%, 22.8%) | (6.5%, 13.7%) | (6.2%, 11.8%) | (10.9%, 14.9%) | |
| Benefits and employer supports | * | 16 | 12 | 32 | 16 | 20 | 14 | 20 | 28 | 94 |
| * | 21.8% | 22.0% | 10.0% | 14.9% | 10.4% | 13.2% | 10.1% | 9.6% | 14.6% | |
| * | (16.3%, 28.6%) | (14.9%, 31.3%) | (7.7%, 12.9%) | (10.8%, 20.3%) | (7.2%, 14.9%) | (8.7%, 19.6%) | (7.0%, 14.4%) | (7.0%, 13.0%) | (12.6%, 16.8%) |
* Data are suppressed if count is less than 10 or sample population was less than 20.
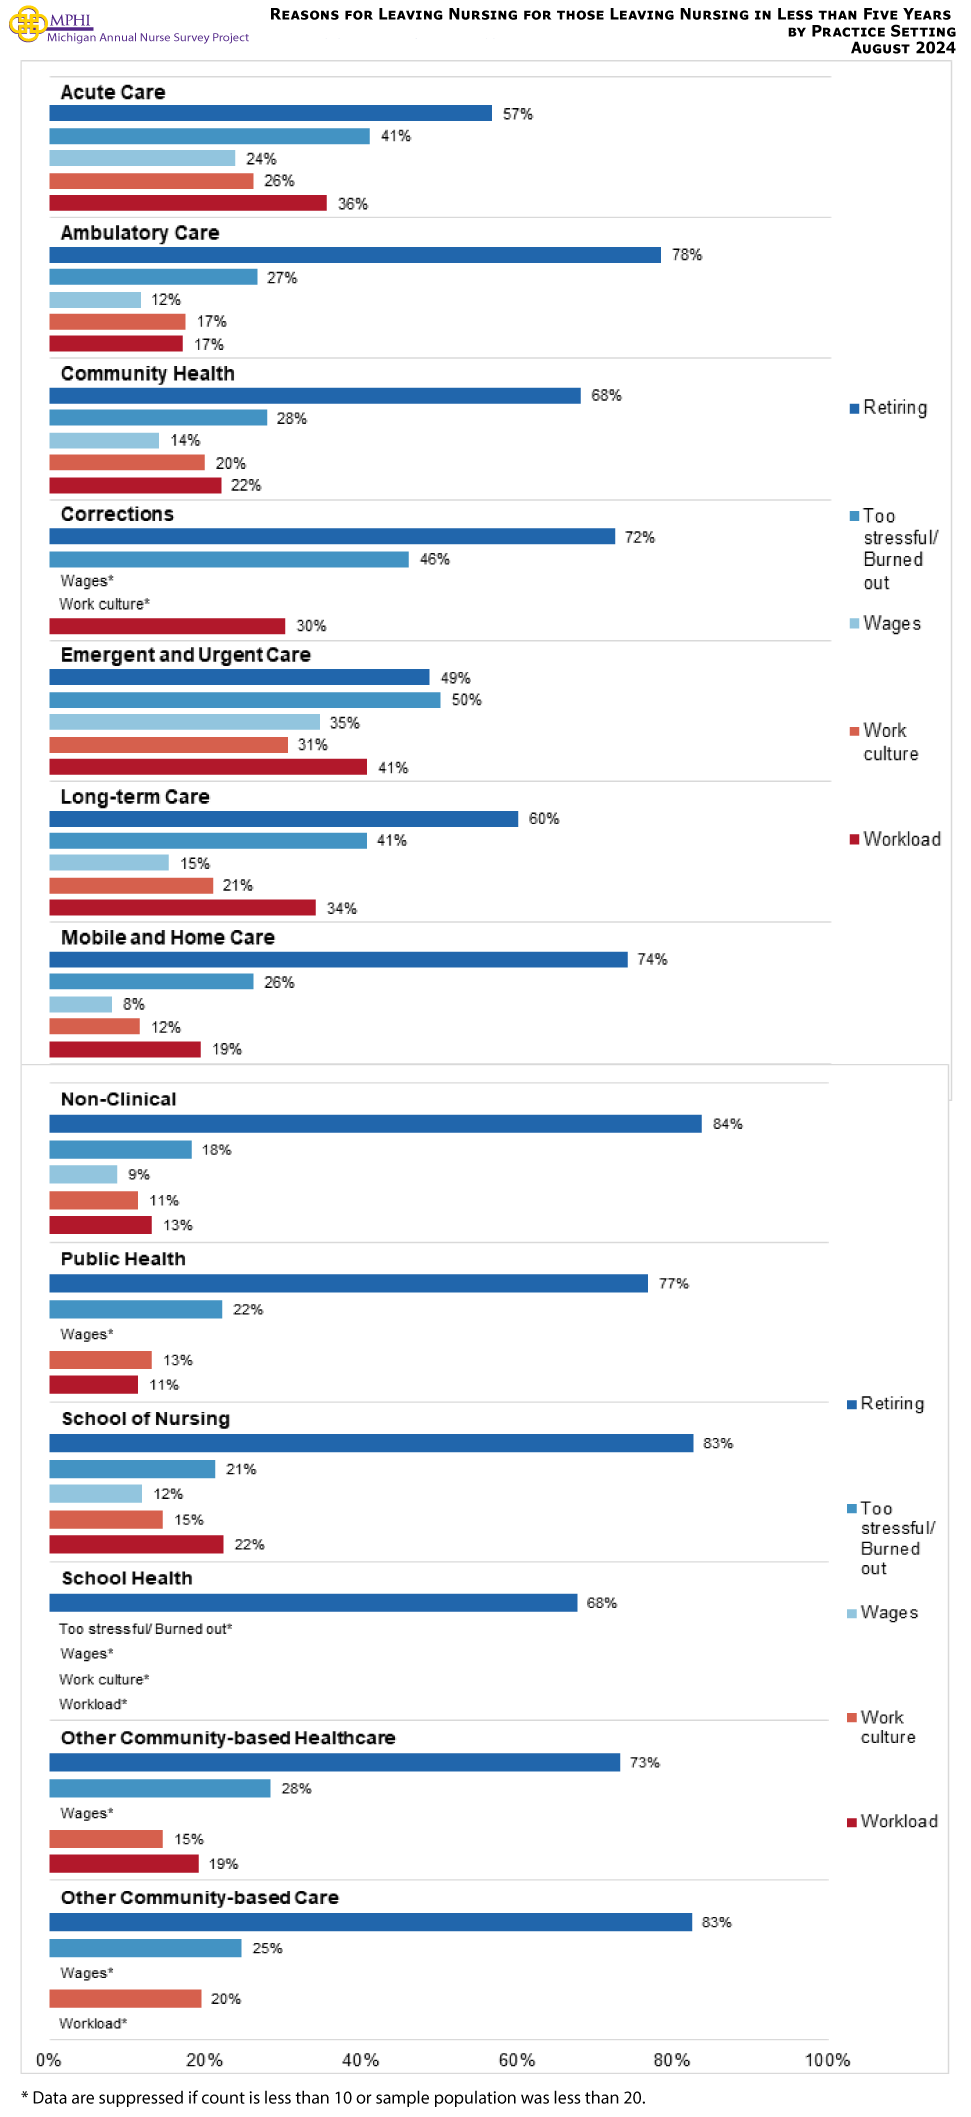
Reasons for Leaving Nursing for those Leaving Nursing in Less than Five Years by Practice Setting
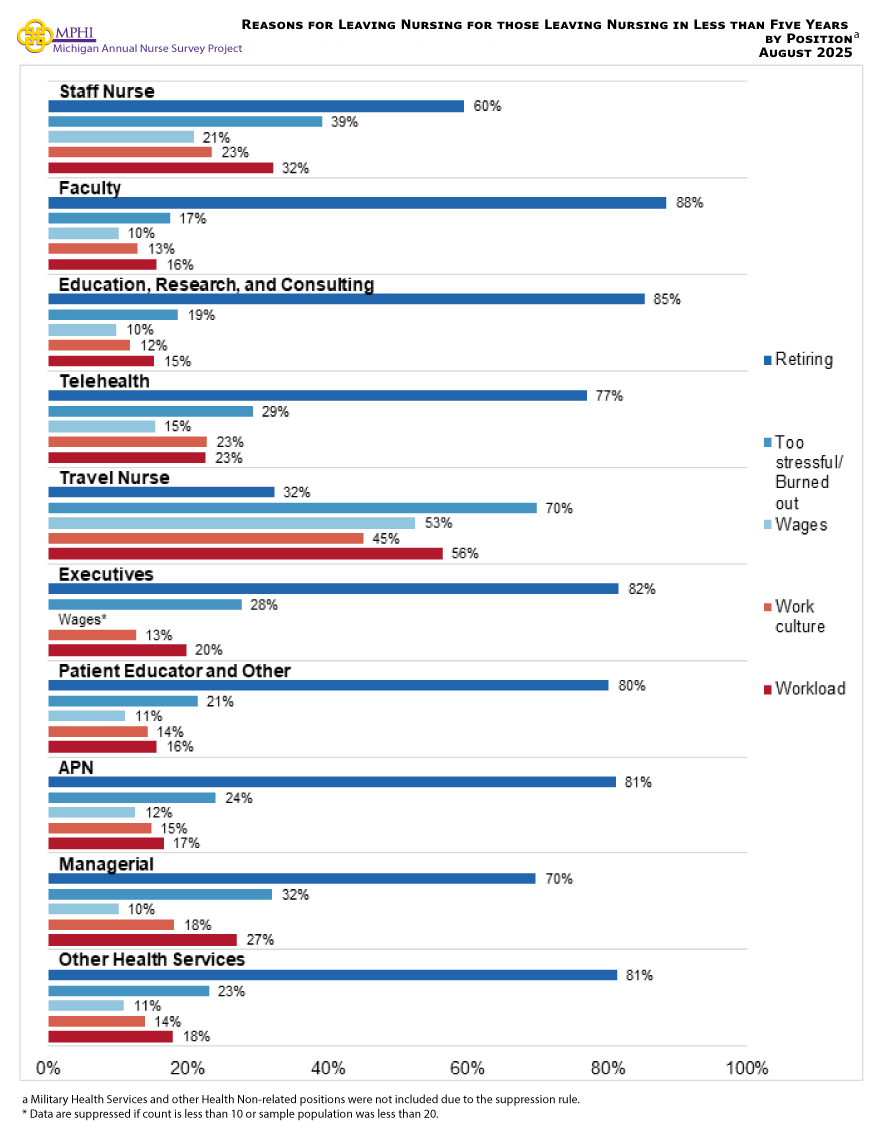
Reasons for Leaving Nursing for those Leaving Nursing in Less than Five Years by Position
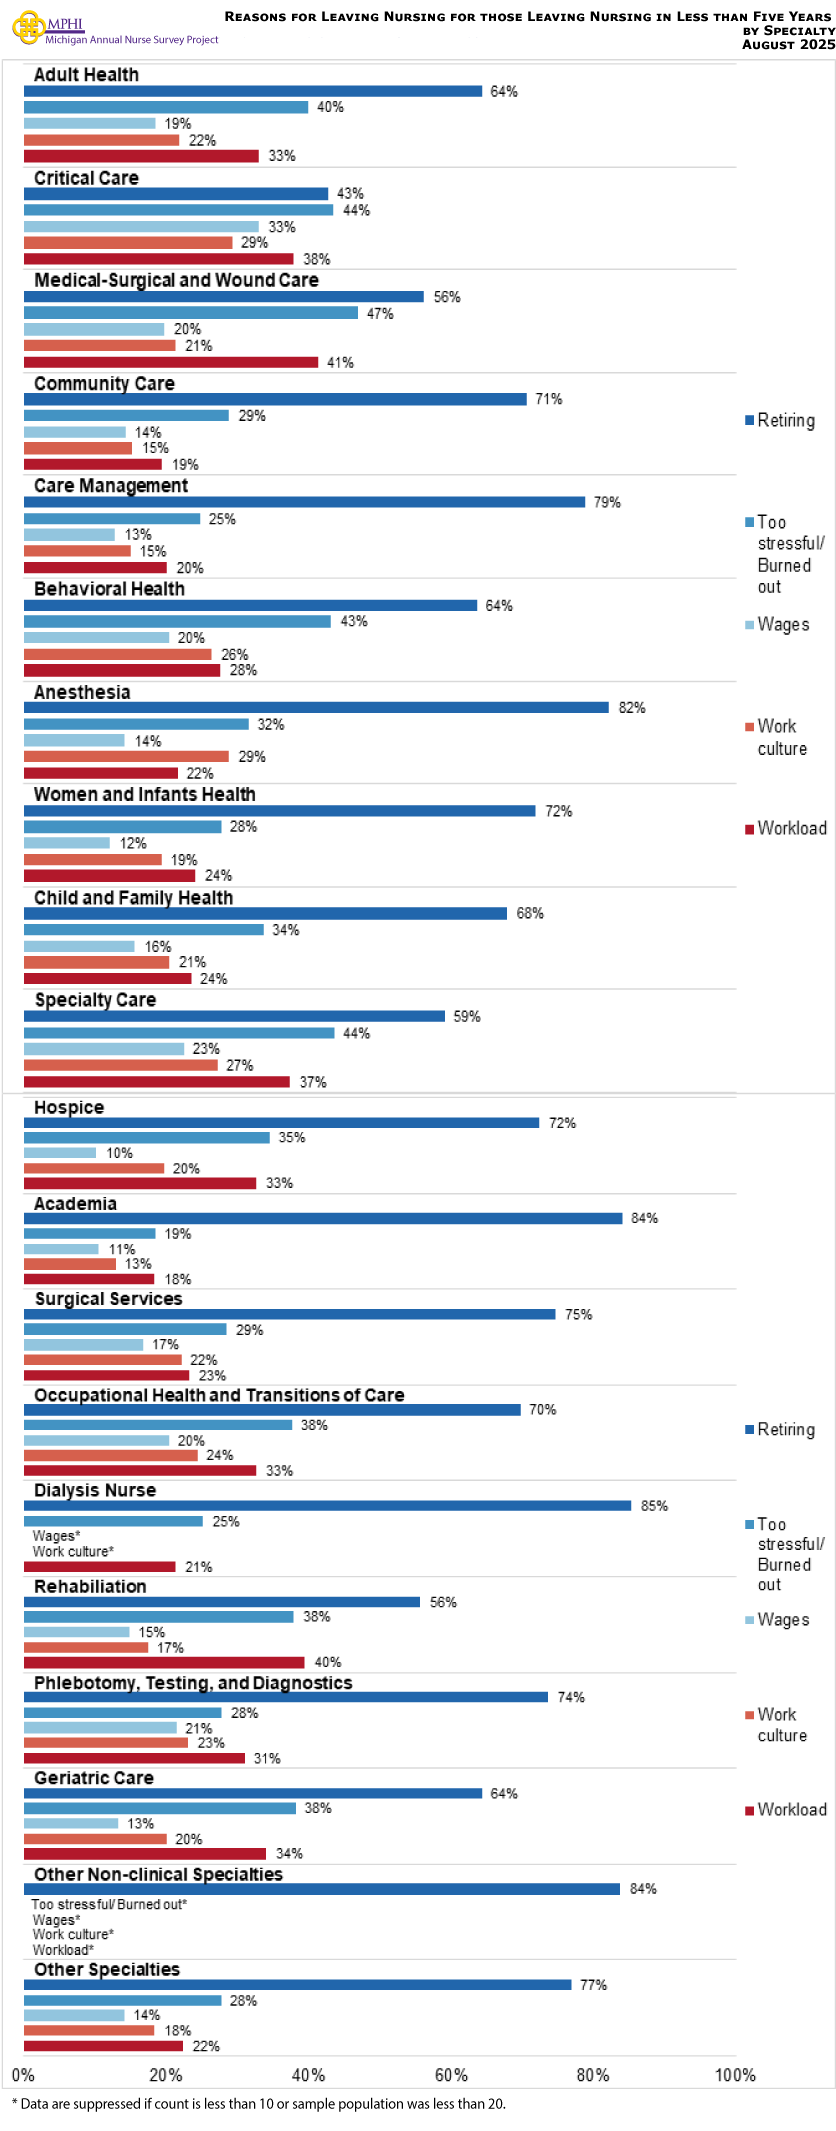
Reasons for Leaving Nursing for those Leaving Nursing in Less than Five Years by Specialty
New Nurse Experience
Preparedness for Entering Nursing Workforce
| Level of Preparedness | RN = 478 | LPN = 80 | ||
|---|---|---|---|---|
| Estimate | 95% CI | Estimate | 95% CI | |
| Adequately prepared | 38.6% | (34.3%, 43.0%) | 38.5% | (28.6%, 49.5%) |
| Not enough classroom time | 2.9% | (1.7%, 4.8%) | * | * |
| Not enough clinical time | 40.1% | (35.8%, 44.6%) | 38.1% | (28.2%, 49.1%) |
| Not enough skills lab/simulation time | 27.8% | (24.0%, 32.0%) | 34.2% | (24.7%, 45.1%) |
| Not enough critical thinking/ prioritization practice | 34.0% | (29.9%, 38.4%) | 23.0% | (15.1%, 33.3%) |
| Other | 1.7% | (0.9%, 3.3%) | * | * |
a Respondents were instructed to mark all that apply.
* Data are suppressed if count is less than 10 or sample population was less than 20.
Finding Employment for Nurses Entering Workforce
| Finding Employment | RN = 479 | LPN = 80 | ||
|---|---|---|---|---|
| Estimate | 95% CI | Estimate | 95% CI | |
| Difficulty Finding a Nursing Position | ||||
| Very difficult | * | * | * | * |
| Difficult | 3.9% | (2.5%, 6.0%) | * | * |
| Neutral | 20.0% | (16.7%, 23.8%) | 26.0% | (17.6%, 36.6%) |
| Easy | 30.6% | (26.6%, 34.9%) | 32.8% | (23.5%, 43.7%) |
| Very easy | 44.8% | (40.4%, 49.3%) | 35.3% | (25.7%, 46.3%) |
| Difficulty Finding a Nursing Position in Preferred Practice Area | ||||
| Very difficult | 8.0% | (5.9%, 10.8%) | 13.8% | (7.9%, 23.0%) |
| Difficult | 18.8% | (15.6%, 22.5%) | 17.1% | (10.4%, 26.8%) |
| Neutral | 24.0% | (20.4%, 28.0%) | 26.1% | (17.7%, 36.7%) |
| Easy | 25.3% | (21.6%, 29.4%) | 20.5% | (13.1%, 30.6%) |
| Very easy | 23.9% | (20.3%, 27.9%) | 22.5% | (14.7%, 32.8%) |
| Transition Semester/Intensive as Part of Nursing Program | ||||
| Yes | 33.8% | (29.6%, 38.2%) | 30.8% | (21.6%, 41.9%) |
| No | 66.2% | (61.8%, 70.4%) | 69.2% | (58.1%, 78.4%) |
| Satisfaction with Orientation at Place of Employment | ||||
| Very dissatisfied | 6.4% | (4.5%, 9.0%) | * | * |
| Dissatisfied | 8.3% | (6.1%, 11.2%) | 21.5% | (13.7%, 32.1%) |
| Neutral | 29.1% | (25.2%, 33.4%) | 32.0% | (22.5%, 43.2%) |
| Satisfied | 44.5% | (40.1%, 49.0%) | 29.7% | (20.6%, 40.8%) |
| Very satisfied | 11.6% | (9.0%, 14.8%) | 10.4% | (5.3%, 19.3%) |
* Data are suppressed if count is less than 10 or sample population was less than 20.
New Nurse Educational Program Experience
| New Nurse Educational Program Experience | RN = 444 | LPN = 73 | ||
|---|---|---|---|---|
| Estimate | 95% CI | Estimate | 95% CI | |
| Exposure to Nursing During Middle or High School | ||||
| Yes, programs completed in middle or high school to explore career in nursing | 17.3% | (14.1%, 21.1%) | 15.8% | (9.2%, 25.8%) |
| Yes, program completed in middle or high school to build academic skills related to nursing | 7.3% | (5.2%, 10.1%) | * | * |
| No | 73.2% | (68.9%, 77.1%) | 73.3% | (62.2%, 82.1%) |
| Other | 2.2% | (1.2%, 4.0%) | * | * |
| Nursing Program Characteristics | ||||
| Holistic admissions | 25.1% | (21.3%, 29.4%) | * | * |
| Public | 59.0% | (54.3%, 63.5%) | 39.9% | (29.4%, 51.4%) |
| Private | 24.1% | (20.3%, 28.3%) | 16.3% | (9.6%, 26.4%) |
| For profit institutions | 7.0% | (5.0%, 9.8%) | 15.0% | (8.6%, 24.9%) |
| Online | 22.5% | (18.8%, 26.6%) | 24.4% | (16.0%, 35.4%) |
| In-person | 56.2% | (51.5%, 60.8%) | 72.4% | (61.2%, 81.3%) |
| Hybrid online and in-person program | 47.7% | (43.1%, 52.4%) | 21.7% | (13.8%, 32.4%) |
| Full-time program | 84.7% | (81.0%, 87.8%) | 75.5% | (64.5%, 83.9%) |
| Part-time program | 11.6% | (8.9%, 14.9%) | * | * |
| Accelerated graduation date due to COVID | 2.8% | (1.6%, 4.8%) | * | * |
| Reduced in-person clinical experience due to COVID | 37.5% | (33.1%, 42.1%) | * | * |
| Nursing Program Supports | ||||
| Academic supports available | 87.5% | (84.0%, 90.3%) | 79.2% | (68.2%, 87.1%) |
| Supports available to navigate college experience | 45.1% | (40.4%, 49.8%) | 25.4% | (16.6%, 36.8%) |
| English as a second language supports available | 16.2% | (13.0%, 20.0%) | * | * |
| Mentorship | 29.6% | (25.5%, 34.1%) | 22.0% | (13.8%, 33.1%) |
| Scholarship | 64.4% | (59.7%, 68.8%) | 37.4% | (26.9%, 49.2%) |
| Work study | 23.9% | (20.1%, 28.2%) | 23.6% | (15.1%, 34.8%) |
| Student loans | 69.2% | (64.7%, 73.4%) | 67.9% | (56.2%, 77.7%) |
| Other | * | * | * | * |
a Respondents were instructed to mark all that apply.
* Data are suppressed if count is less than 10 or sample population was less than 20.
Nurse Residency among New Nurses
| Residency Placement | RN = 479 | LPN = 80 | ||
|---|---|---|---|---|
| Estimate | 95% CI | Estimate | 95% CI | |
| Yes | 59.9% | (55.4%, 64.2%) | 26.5% | (18.1%, 37.1%) |
| No | 40.1% | (35.8%, 44.6%) | 73.5% | (62.9%, 81.9%) |
Nurse Residency Length among New Nurses
| New Nurse Residency Length | N = 280 | |
|---|---|---|
| Estimate | 95% CI | |
| Less than a Month | 6.2% | (3.9%, 9.7%) |
| 1-3 Months | 21.4% | (17.0%, 26.6%) |
| 3-6 Months | 16.5% | (12.6%, 21.3%) |
| 6-12 Months | 52.9% | (47.1%, 58.7%) |
| 12-24 Months | * | * |
* Data are suppressed if count is less than 10 or sample population was less than 20.
Support for Residency among New Nurses
| Level of Support | N = 483 | |
|---|---|---|
| Estimate | 95% CI | |
| Not at all supported | 11.8% | (9.2%, 15.0%) |
| Somewhat supported | 27.2% | (23.4%, 31.3%) |
| Moderately supported | 30.8% | (26.8%, 35.1%) |
| Very supported | 23.0% | (19.5%, 27.0%) |
| Extremely supported | 7.1% | (5.1%, 9.7%) |
* Data are suppressed if count is less than 10 or sample population was less than 20.
Unanticipated Barriers and Challenges while Pursing Nursing Degree
| Barriers | RN = 435 | LPN = 71 | ||
|---|---|---|---|---|
| Estimate | 95% CI | Estimate | 95% CI | |
| No Unanticipated barriers | 10.5% | (8.0%, 13.7%) | * | * |
| Among those who did experience unanticipated barriers | ||||
| English as a second language | 2.4% | (1.3%, 4.3%) | * | * |
| Racial/ethnic disparities | 4.0% | (2.5%, 6.3%) | * | * |
| Learning difficulties and/or disabilities | 9.0% | (6.7%, 12.1%) | * | * |
| Lack of flexibility in work schedules | 28.9% | (24.8%, 33.3%) | 40.4% | (29.8%, 52.0%) |
| Childcare issues | 10.8% | (8.2%, 14.1%) | * | * |
| Pregnancy (i.e., as covered under Title IX) | 4.9% | (3.2%, 7.4%) | * | * |
| Other family issues | 17.3% | (14.0%, 21.1%) | 19.9% | (12.3%, 30.6%) |
| Cost of lost work time and benefits | 32.5% | (28.3%, 37.0%) | 49.3% | (38.0%, 60.7%) |
| Cost of tuition | 57.9% | (53.2%, 62.5%) | 56.5% | (44.9%, 67.4%) |
| Cost of materials, books, etc. | 53.2% | (48.5%, 57.8%) | 50.8% | (39.4%, 62.1%) |
| Student loans were not available/could not take enough loans | 12.4% | (9.6%, 15.8%) | 19.0% | (11.6%, 29.6%) |
| Financial aid | 29.6% | (25.5%, 34.1%) | 39.5% | (29.0%, 51.1%) |
| Commuting distance to educational program | 19.5% | (16.1%, 23.5%) | 28.2% | (19.1%, 39.6%) |
| Limited access to online learning or other online resources | 2.4% | (1.3%, 4.3%) | * | * |
| Scheduling or educational programs offered | 10.7% | (8.1%, 14.0%) | 16.2% | (9.4%, 26.5%) |
| Variability for clinical placements and experience | 27.5% | (23.5%, 31.9%) | 25.1% | (16.5%, 36.3%) |
| Younger/older classmates | 16.2% | (13.0%, 20.0%) | 22.6% | (14.4%, 33.6%) |
| Feeling “too young” or “too old” for the profession | 14.6% | (11.6%, 18.2%) | 18.6% | (11.3%, 29.2%) |
| Other | * | * | * | * |
* Data are suppressed if count is less than 10 or sample population was less than 20.
Workplace Violence
Type & Perpetrator of Workplace Violence
Demographic of Nurses Experiencing Workplace Violence in the Past Year
| Characteristics | RNs | LPNs | ||
|---|---|---|---|---|
| n | Estimate | n | Estimate | |
| Total | 9,911 | 47.3% | 827 | 37.6% |
| Age | ||||
| <25 years | 67 | 71.6% | * | * |
| 25 to 34 years | 927 | 62.9% | 64 | 46.9% |
| 35 to 44 years | 1,829 | 49.6% | 154 | 33.8% |
| 45 to 54 years | 2,534 | 41.9% | 205 | 41.0% |
| 55 to 64 years | 2,889 | 36.2% | 259 | 35.1% |
| 65+ years | 1,575 | 22.1% | 135 | 19.1% |
| Gender | ||||
| Female | 8,821 | 46.4% | 766 | 36.4% |
| Male | 936 | 52.3% | 48 | 52.3% |
| Gender non-binary/non-conforming, Genderqueer, Transgender | 23 | 87.6% | 0 | 0.0% |
| Prefer not to respond | 96 | 67.1% | * | * |
| Ethnicity | ||||
| Hispanic or Latinx | 238 | 52.3% | 26 | 53.5% |
| Middle Eastern | 132 | 47.8% | 12 | 34.5% |
| Race | ||||
| White | 8,900 | 48.2% | 600 | 39.6% |
| Black | 561 | 33.5% | 186 | 26.9% |
| American Indian | 156 | 48.5% | 23 | 63.8% |
| Asian/ Pacific Islander | 283 | 38.8% | 20 | 44.9% |
| Other | 197 | 62.3% | 28 | 41.8% |
| Employment Region | ||||
| Eastern/Central/Western UP | 335 | 47.7% | 58 | 34.2% |
| Northwest LP | 380 | 46.7% | 22 | 28.5% |
| Northeast LP | 168 | 51.9% | 22 | 46.4% |
| West/West Central | 1,426 | 46.9% | 140 | 39.3% |
| East Central | 519 | 54.5% | 59 | 47.5% |
| East | 664 | 47.9% | 62 | 56.2% |
| South Central | 479 | 49.3% | 24 | 40.3% |
| Southwest | 648 | 54.7% | 51 | 31.1% |
| Southeast | 1,147 | 49.7% | 87 | 35.3% |
| Detroit Metro | 2,886 | 47.2% | 247 | 33.6% |
| Outside of MI | 119 | 51.2% | 11 | 27.9% |
| Unknown MI Region | 1,140 | 34.9% | 44 | 34.5% |
| Region of Residence | ||||
| Upper Peninsula | 337 | 46.2% | 60 | 32.9% |
| Northwest LP | 390 | 46.8% | 24 | 35.8% |
| Northeast LP | 191 | 53.0% | 23 | 40.6% |
| West/West Central | 1,470 | 47.9% | 135 | 37.7% |
| East Central | 508 | 52.7% | 58 | 52.1% |
| East | 786 | 50.7% | 71 | 52.1% |
| South Central | 437 | 51.4% | 22 | 39.1% |
| Southwest | 669 | 52.7% | 59 | 36.3% |
| Southeast | 972 | 47.0% | 77 | 41.1% |
| Detroit Metro | 2,931 | 47.8% | 248 | 32.7% |
| Non-Michigan Residence | 102 | 39.3% | 12 | 43.0% |
| Unknown MI Region | 1,118 | 34.2% | 38 | 26.9% |
a Gender options have been combined for the purpose of increasing the likelihood of having enough responses to be included in the analysis. Should the number be high enough, we will revisit separating out options in future surveys.
b Respondents were instructed to mark all races that apply.
c Southeast Michigan includes the following counties: Livingston, Jackson, Washtenaw, Hillsdale, Lenawee and Monroe.
d Detroit Metro includes the following counties: Oakland, Wayne, and Macomb.
Ϯ The n represents the total number of nurses who responded to the workplace violence section of the survey
¥ Estimates reflect the weighted percentage of nurses who said “Yes” to experiencing workplace violence
* Data are suppressed if count is less than 10 or sample population was less than 20.
Demographics of those Nurses who Experienced Workplace Violence, 2024 & 2025
| Characteristics | 2024 | 2025 | ||||||
|---|---|---|---|---|---|---|---|---|
| RNs | LPNs | RNs | LPNs | |||||
| n | Estimate | n | Estimate | n | Estimate | n | Estimate | |
| Total | 15,450 | 46.3% | 1,466 | 32.7% | 9,911 | 47.3% | 827 | 37.6% |
| Age | ||||||||
| <25 years | 123 | 62.6% | * | * | 67 | 71.6% | * | * |
| 25 to 34 years | 1,574 | 59.8% | 127 | 41.7% | 927 | 62.9% | 64 | 46.9% |
| 35 to 44 years | 2,938 | 48.2% | 292 | 36.0% | 1,829 | 49.6% | 154 | 33.8% |
| 45 to 54 years | 3,593 | 42.6% | 347 | 25.6% | 2,534 | 41.9% | 205 | 41.0% |
| 55 to 64 years | 4,339 | 35.2% | 391 | 29.4% | 2,889 | 36.2% | 259 | 35.1% |
| 65+ years | 2,146 | 22.9% | 227 | 19.8% | 1,575 | 22.1% | 135 | 19.1% |
| Gender | ||||||||
| Female | 13,589 | 45.3% | 1,342 | 31.6% | 8,821 | 46.4% | 766 | 36.4% |
| Male | 1,407 | 52.7% | 76 | 40.9% | 936 | 52.3% | 48 | 52.3% |
| Gender non-binary/non-conforming, Genderqueer, Transgender | * | * | * | * | 23 | 87.6% | 0 | 0.0% |
| Prefer not to respond | 260 | 63.1% | 28 | 51.2% | 96 | 67.1% | * | * |
| Race | ||||||||
| White | 13,592 | 47.3% | 1,032 | 36.2% | 238 | 52.3% | 26 | 53.5% |
| Black | 937 | 34.7% | 73 | 21.6% | 132 | 47.8% | 12 | 34.5% |
| American Indian | 224 | 59.0% | 30 | 37.9% | ||||
| Asian/ Pacific Islander | 445 | 41.8% | * | * | 8,900 | 48.2% | 600 | 39.6% |
| Other | 387 | 51.8% | 57 | 46.5% | 561 | 33.5% | 186 | 26.9% |
| Ethnicity | 156 | 48.5% | 23 | 63.8% | ||||
| Hispanic or Latinx | 365 | 52.4% | 44 | 43.9% | 283 | 38.8% | 20 | 44.9% |
| Middle Eastern | 206 | 45.9% | * | * | 197 | 62.3% | 28 | 41.8% |
| Employment Region | ||||||||
| Upper Peninsula | 503 | 43.4% | 115 | 35.2% | 335 | 47.7% | 58 | 34.2% |
| Northwest LP | 577 | 45.0% | 36 | 40.1% | 380 | 46.7% | 22 | 28.5% |
| Northeast LP | 264 | 47.1% | * | * | 168 | 51.9% | 22 | 46.4% |
| West/West Central | 2,090 | 50.5% | 206 | 39.7% | 1,426 | 46.9% | 140 | 39.3% |
| East Central | 834 | 49.3% | 112 | 26.5% | 519 | 54.5% | 59 | 47.5% |
| East | 982 | 49.8% | 102 | 30.9% | 664 | 47.9% | 62 | 56.2% |
| South Central | 631 | 50.8% | 46 | 43.9% | 479 | 49.3% | 24 | 40.3% |
| Southwest | 999 | 54.8% | 106 | 40.9% | 648 | 54.7% | 51 | 31.1% |
| Southeast | 1,768 | 47.6% | 141 | 36.5% | 1,147 | 49.7% | 87 | 35.3% |
| Detroit Metro | 4,225 | 45.7% | 446 | 27.4% | 2,886 | 47.2% | 247 | 33.6% |
| Outside of MI | 2,046 | 33.7% | 71 | 25.3% | 119 | 51.2% | 11 | 27.9% |
| Unknown MI Region | 531 | 45.6% | 47 | 41.4% | 1,140 | 34.9% | 44 | 34.5% |
| Region of Residence | ||||||||
| Upper Peninsula | 482 | 42.3% | 109 | 34.7% | 337 | 46.2% | 60 | 32.9% |
| Northwest LP | 580 | 46.0% | 43 | 40.3% | 390 | 46.8% | 24 | 35.8% |
| Northeast LP | 291 | 44.7% | * | * | 191 | 53.0% | 23 | 40.6% |
| West/West Central | 2,157 | 49.8% | 212 | 38.4% | 1,470 | 47.9% | 135 | 37.7% |
| East Central | 800 | 49.8% | 101 | 27.4% | 508 | 52.7% | 58 | 52.1% |
| East | 1,220 | 49.5% | 122 | 29.3% | 786 | 50.7% | 71 | 52.1% |
| South Central | 613 | 53.7% | 41 | 55.0% | 437 | 51.4% | 22 | 39.1% |
| Southwest | 996 | 53.5% | 107 | 43.2% | 669 | 52.7% | 59 | 36.3% |
| Southeast | 1,491 | 47.2% | 129 | 30.7% | 972 | 47.0% | 77 | 41.1% |
| Detroit Metro | 4,303 | 45.6% | 447 | 28.0% | 2,931 | 47.8% | 248 | 32.7% |
| Non-Michigan Residence | 1,984 | 33.6% | 63 | 25.2% | 102 | 39.3% | 12 | 43.0% |
| Unknown MI Region | 533 | 51.9% | 51 | 50.1% | 1,118 | 34.2% | 38 | 26.9% |
a Gender options have been combined for the purpose of increasing the likelihood of having enough responses to be included in the analysis. Should the number be high enough, we will revisit separating out options in future surveys.
b Respondents were instructed to mark all races that apply.
c Southeast Michigan includes the following counties: Livingston, Jackson, Washtenaw, Hillsdale, Lenawee and Monroe.
d Detroit Metro includes the following counties: Oakland, Wayne, and Macomb.
Ϯ The n represents the total number of nurses who responded to the workplace violence section of the survey
¥ Estimates reflect the weighted percentage of nurses who said “Yes” to experiencing workplace violence
* Data are suppressed if count is less than 10 or sample population was less than 20.
Rate of Workplace Violence Experienced 2020-2025
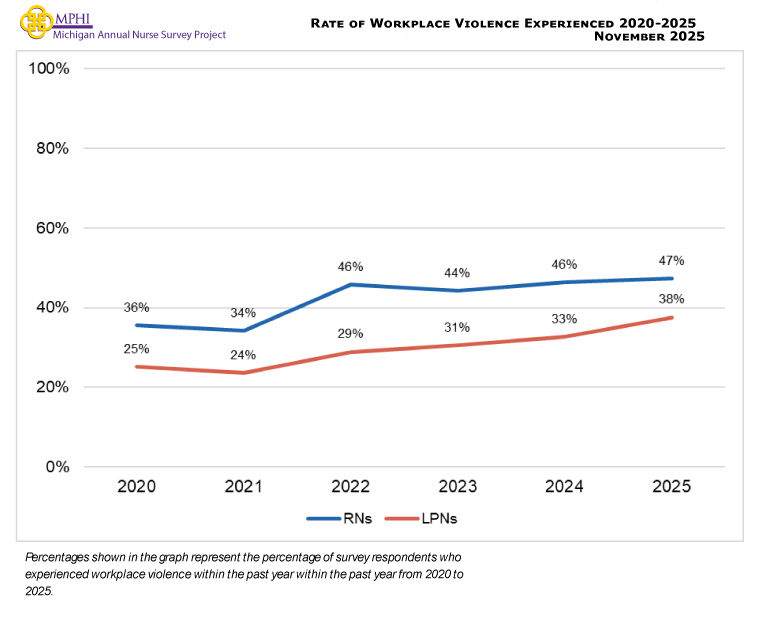
Nurses Who Experienced Workplace Violence by Setting
| Setting | RN = 12,920 | LPN = 1,158 | ||||
|---|---|---|---|---|---|---|
| n | Estimate | 95% CI | n | Estimate | 95% CI | |
| Emergent and Urgent Care | 1,010 | 75.0% | (72.2%, 77.6%) | 23 | 65.8% | (45.5%, 81.6%) |
| Acute Care | 4,468 | 61.6% | (60.2%, 63.0%) | 89 | 43.3% | (33.5%, 53.7%) |
| Corrections | 126 | 59.3% | (50.6%, 67.5%) | 21 | 39.5% | (21.8%, 60.4%) |
| Long-term care | 654 | 45.4% | (41.6%, 49.2%) | 381 | 43.4% | (38.5%, 48.4%) |
| Community Health | 605 | 40.5% | (36.7%, 44.5%) | 93 | 43.3% | (33.7%, 53.4%) |
| School of Nursing | 533 | 39.2% | (35.1%, 43.4%) | * | * | * |
| Ambulatory Care | 2,394 | 38.3% | (36.4%, 40.3%) | 149 | 39.3% | (31.8%, 47.3%) |
| School Health | 190 | 33.7% | (27.4%, 40.7%) | 24 | 46.8% | (28.7%, 65.8%) |
| Other Community-based Healthcare | 391 | 32.5% | (28.0%, 37.3%) | 109 | 33.5% | (25.3%, 42.8%) |
| Public Health | 431 | 31.2% | (27.0%, 35.7%) | 16 | 59.6% | (36.1%, 79.4%) |
| Mobile and Home Care | 571 | 27.1% | (23.6%, 30.9%) | 147 | 26.4% | (19.9%, 34.1%) |
| Non-Clinical | 1,326 | 25.3% | (23.0%, 27.7%) | 87 | 24.3% | (16.5%, 34.3%) |
| Other Community-based Care | 221 | 22.4% | (17.4%, 28.3%) | 11 | 35.8% | (14.8%, 64.1%) |
a Respondents were instructed to mark all that apply.
Ϯ The n represents the total number of nurses who responded to the workplace violence section of the survey
¥ Estimates reflect the weighted percentage of nurses who said “Yes” to experiencing workplace violence
* Data are suppressed if count is less than 10 or sample population was less than 20.
Nurses Who Experienced Workplace Violence by Position
| Position | RN = 13,438 | LPN = 1,089 | ||||
|---|---|---|---|---|---|---|
| n | Estimate | 95% CI | n | Estimate | 95% CI | |
| Travel Nurse | 252 | 67.9% | (61.9%, 73.4%) | 28 | 35.2% | (20.3%, 53.7%) |
| Staff Nurse | 5,316 | 58.5% | (57.2%, 59.8%) | 600 | 41.5% | (37.6%, 45.5%) |
| Military Health Services | 59 | 57.9% | (45.2%, 69.6%) | 12 | 58.2% | (31.8%, 80.6%) |
| Managerial | 954 | 46.7% | (43.6%, 49.9%) | 106 | 35.7% | (27.2%, 45.2%) |
| APN | 1,058 | 38.8% | (35.9%, 41.8%) | * | * | * |
| Faculty | 510 | 38.7% | (34.6%, 43.0%) | * | * | * |
| Education, Research, and Consulting | 1,065 | 37.5% | (34.6%, 40.4%) | 28 | 17.8% | (7.8%, 35.5%) |
| Patient Educator and other | 1,288 | 35.8% | (33.2%, 38.5%) | 114 | 36.5% | (28.2%, 45.6%) |
| Telehealth | 491 | 35.2% | (31.1%, 39.5%) | 27 | 35.9% | (20.6%, 54.7%) |
| School Nurse | 174 | 33.9% | (27.3%, 41.2%) | 22 | 53.0% | (33.3%, 71.8%) |
| Other health Non-related | 53 | 32.7% | (21.6%, 46.1%) | * | * | * |
| Executives | 548 | 32.2% | (28.4%, 36.2%) | 32 | 42.8% | (27.4%, 59.8%) |
| Other Health Services | 1,670 | 30.2% | (28.0%, 32.4%) | 106 | 20.6% | (14.0%, 29.3%) |
a Respondents were instructed to mark all that apply.
Ϯ The n represents the total number of nurses who responded to the workplace violence section of the survey
¥ Estimates reflect the weighted percentage of nurses who said “Yes” to experiencing workplace violence
* Data are suppressed if count is less than 10 or sample population was less than 20.
Nurses Who Experienced Workplace Violence by Specialty
| Specialty | RN = 17,921 | LPN = 1,765 | ||||
|---|---|---|---|---|---|---|
| n | Estimate | 95% CI | n | Estimate | 95% CI | |
| Critical Care | 1,411 | 68.9% | (66.4%, 71.3%) | 36 | 45.2% | (30.2%, 61.1%) |
| Medical-Surgical and Wound Care | 1,546 | 63.9% | (61.5%, 66.3%) | 191 | 47.5% | (40.5%, 54.6%) |
| Behavioral Health | 742 | 63.5% | (60.0%, 66.9%) | 58 | 51.8% | (39.2%, 64.1%) |
| Specialty Care | 1,380 | 59.1% | (56.5%, 61.7%) | 40 | 47.8% | (33.2%, 62.8%) |
| Phlebotomy, Testing, and Diagnostics | 253 | 57.6% | (51.4%, 63.5%) | 30 | 60.3% | (42.6%, 75.7%) |
| Adult Health | 2,176 | 55.2% | (53.1%, 57.3%) | 293 | 40.7% | (35.2%, 46.4%) |
| Geriatric Care | 1,067 | 54.5% | (51.5%, 57.5%) | 340 | 44.9% | (39.7%, 50.2%) |
| Hospice | 547 | 51.5% | (47.3%, 55.7%) | 83 | 50.5% | (40.0%, 61.0%) |
| Rehabilitation | 449 | 47.4% | (42.8%, 52.0%) | 162 | 42.5% | (35.1%, 50.2%) |
| Occupational Health and Transitions of Care | 449 | 47.3% | (42.7%, 51.9%) | 43 | 52.3% | (37.8%, 66.4%) |
| Surgical Services | 1,133 | 46.0% | (43.1%, 48.9%) | 16 | 39.0% | (19.6%, 62.7%) |
| Child and Family Health | 1,180 | 44.3% | (41.5%, 47.1%) | 170 | 38.4% | (31.4%, 45.9%) |
| Dialysis Nurse | 197 | 42.8% | (36.1%, 49.8%) | * | * | * |
| Women and Infant Health | 866 | 41.6% | (38.4%, 44.9%) | 28 | 51.1% | (33.6%, 68.3%) |
| Other Specialties | 1,644 | 40.6% | (38.3%, 43.0%) | 149 | 37.1% | (29.8%, 45.1%) |
| Anesthesia | 346 | 39.8% | (34.8%, 45.0%) | * | * | * |
| Community Care | 522 | 38.7% | (34.6%, 42.9%) | 34 | 39.4% | (24.9%, 56.1%) |
| Academia | 463 | 38.4% | (34.1%, 42.9%) | 15 | 29.1% | (12.4%, 54.3%) |
| Care Management | 1,345 | 29.8% | (27.4%, 32.3%) | 60 | 34.2% | (23.5%, 46.8%) |
| Other Non-clinical Specialties | 205 | 21.0% | (16.0%, 27.1%) | 12 | 24.4% | (8.6%, 52.7%) |
a Respondents were instructed to mark all that apply.
Ϯ The n represents the total number of nurses who responded to the workplace violence section of the survey
¥ Estimates reflect the weighted percentage of nurses who said “Yes” to experiencing workplace violence
* Data are suppressed if count is less than 10 or sample population was less than 20.
Type of Workplace Violence Nurses Experienced by Age for All Nurses
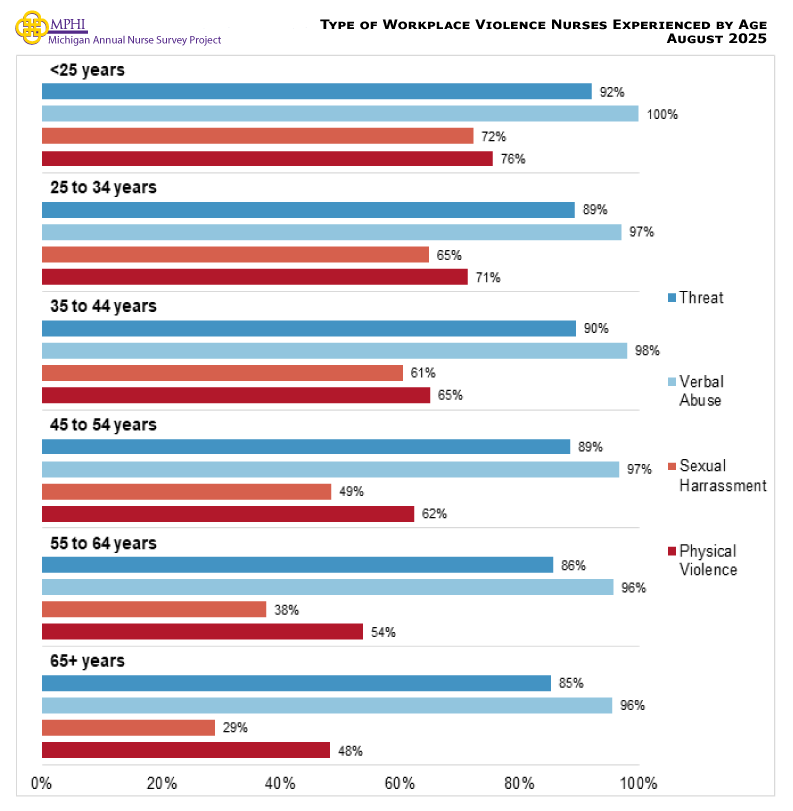
Frequency of Violence by Type
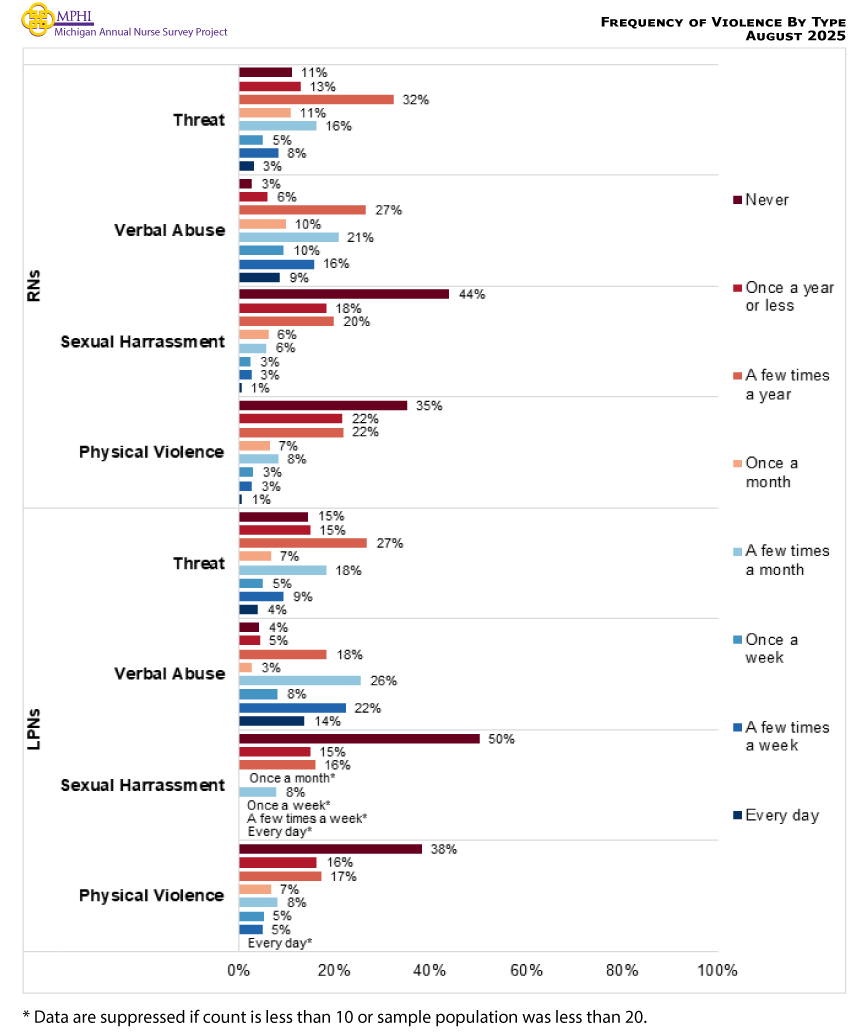
Perpetrator of Workplace Violence
| Perpetrator of WPV | RN = 4,001 | LPN = 283 | ||
|---|---|---|---|---|
| Estimate | 95% CI | Estimate | 95% CI | |
| Patient | 90.0% | (89.0%, 90.9%) | 88.3% | (84.0%, 91.5%) |
| Family or Friend of Patient | 62.4% | (60.9%, 63.9%) | 46.7% | (41.0%, 52.5%) |
| Supervisor | 9.9% | (9.0%, 10.9%) | 16.9% | (13.0%, 21.7%) |
| Physician | 17.7% | (16.5%, 18.9%) | 8.9% | (6.1%, 12.8%) |
| Peer | 17.7% | (16.5%, 18.9%) | 24.7% | (20.0%, 30.0%) |
| Other | 2.8% | (2.3%, 3.4%) | 5.2% | (3.2%, 8.4%) |
a In previous years, respondents noted issues with survey programming in which it only allowed them to pick one response option
Perpetrator & Type of Violence Experienced by Nurses
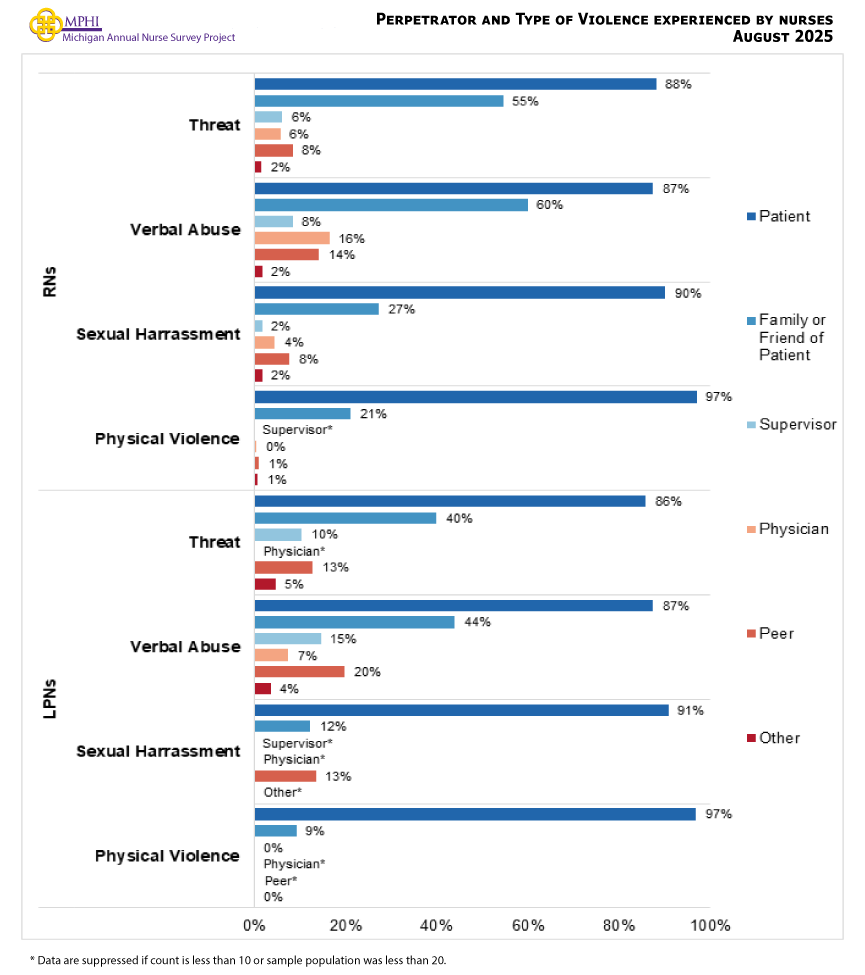
Reporting of Workplace Violence
Reporting of Workplace Violence Incidence
| Reporting of Workplace Violence | RN = 4,011 | LPN = 283 | ||
|---|---|---|---|---|
| Estimate | 95% CI | Estimate | 95% CI | |
| Knowledge of Organizational Process for Reporting Workplace Violence | ||||
| Yes | 73.9% | (72.5%, 75.2%) | 58.0% | (52.2%, 63.6%) |
| No | 9.1% | (8.2%, 10.0%) | 18.9% | (14.8%, 23.9%) |
| Don’t Know | 17.0% | (15.9%, 18.2%) | 23.1% | (18.6%, 28.4%) |
| Reported Workplace Violence Using Organizational Process | ||||
| Yes | 61.3% | (59.5%, 63.0%) | 73.1% | (65.9%, 79.3%) |
Rate of Workplace Violence Reported 2021-2025
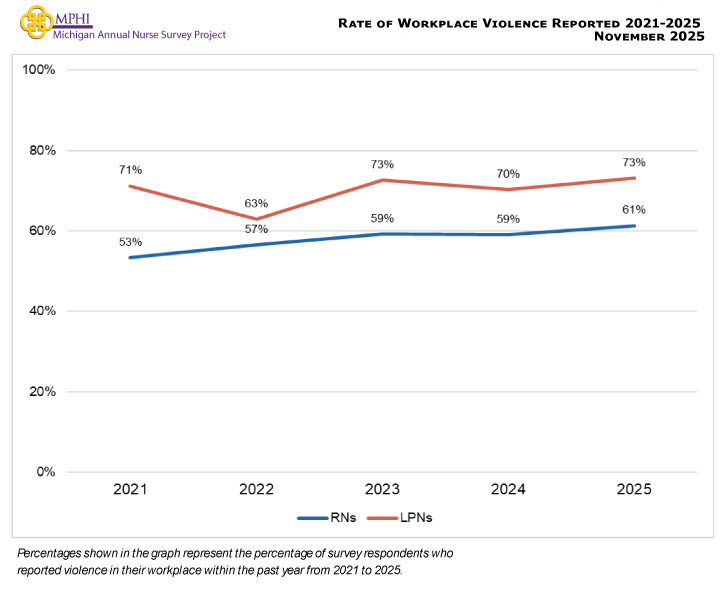
Knowledge of Reporting Process of Workplace Violence Incidence
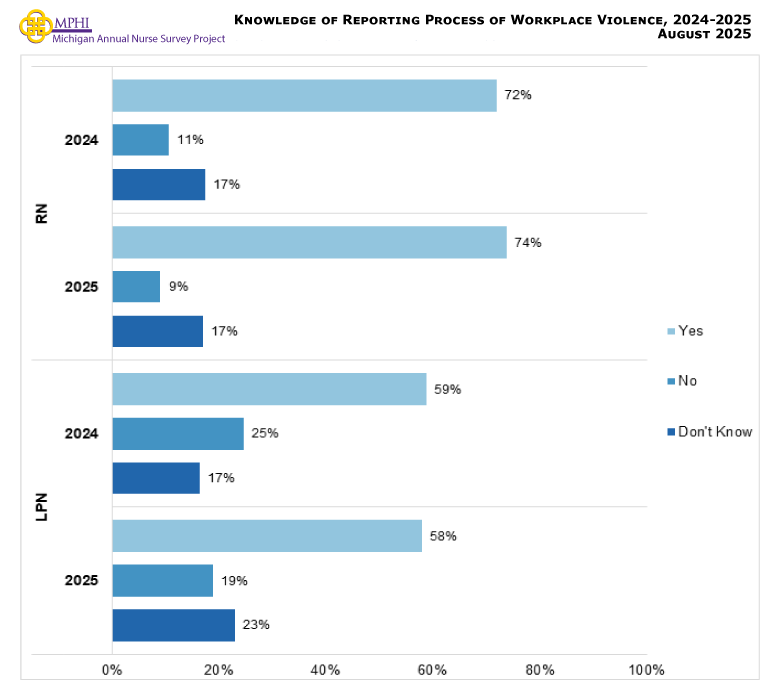
Knowledge of Organizational Reporting Process & Use of Reporting by Age
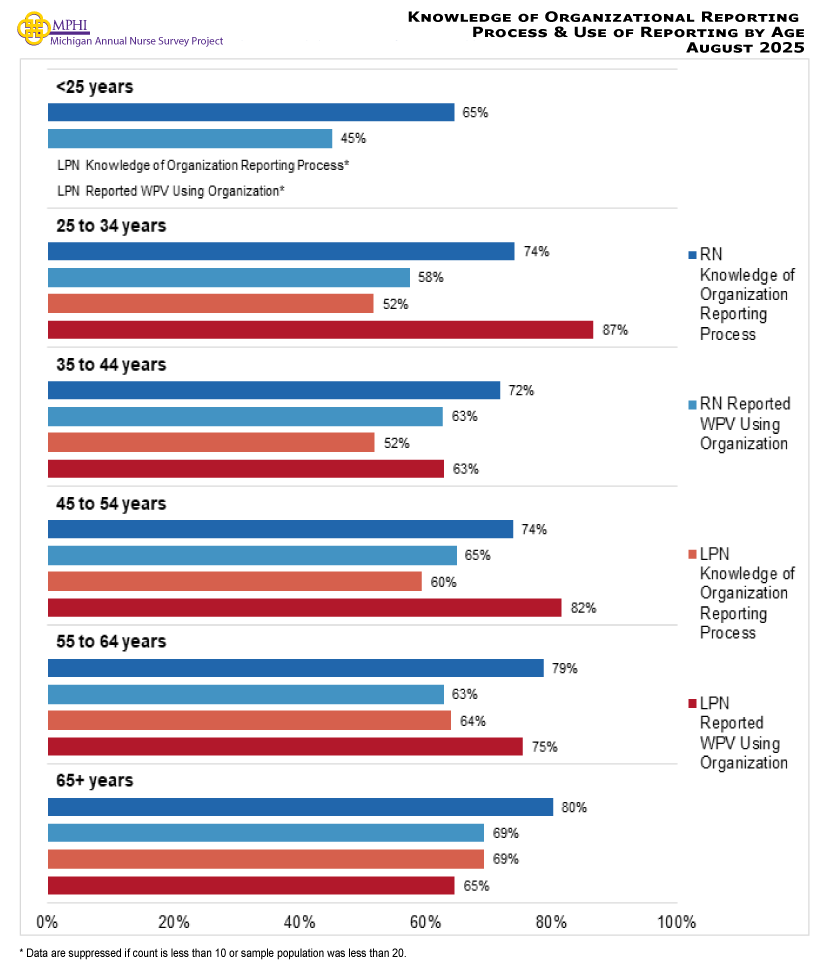
Methods of Reporting Workplace Violence
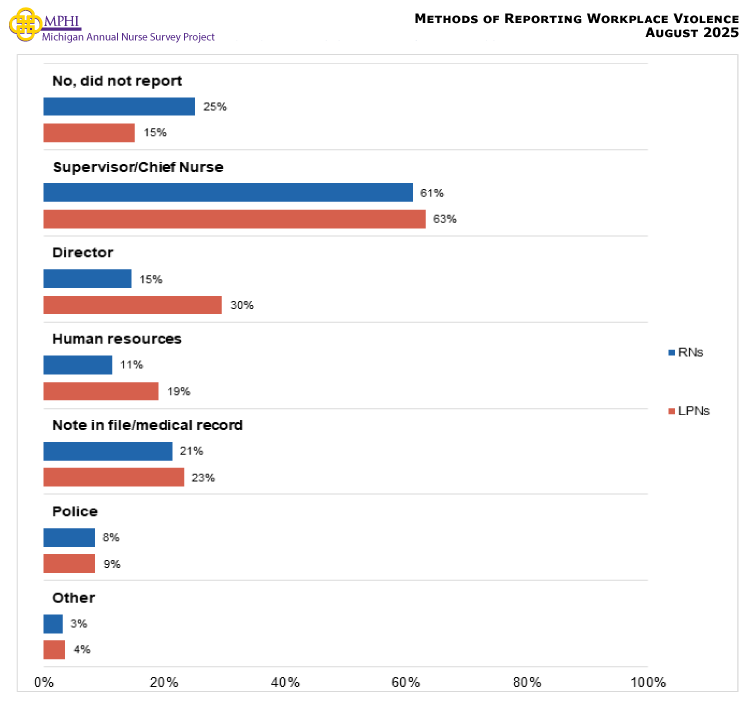
* Data are suppressed if count is less than 10 or sample population was less than 20.
Appendices
Second Degree Nurses
Type of Nursing Program
| Program Type | RN = 3,359 | LPN = 208 | ||
|---|---|---|---|---|
| Estimate | 95% CI | Estimate | 95% CI | |
| Associate | 49.0% | (47.3%, 50.7%) | 81.9% | (76.1%, 86.5%) |
| BSN | 22.8% | (21.4%, 24.2%) | 4.6% | (2.5%, 8.4%) |
| Accelerated BSN (ABSN) | 22.4% | (21.0%, 23.8%) | * | * |
| Entry Master’s program | 2.9% | (2.4%, 3.5%) | 0.0% | (0.0%, 0.3%) |
| Joint BSN-MSN entry program | 0.7% | (0.5%, 1.0%) | * | * |
| Other | 2.2% | (1.8%, 2.8%) | 12.1% | (8.3%, 17.2%) |
* Data are suppressed if count is less than 10 or sample population was less than 20.
Reason for Program Decision
| Reasons | RN = 3,277 | LPN = 203 | ||
|---|---|---|---|---|
| Estimate | 95% CI | Estimate | 95% CI | |
| Cost of tuition | 34.1% | (32.5%, 35.7%) | 33.5% | (27.4%, 40.2%) |
| Ability to qualify for federal student loans | 8.9% | (8.0%, 9.9%) | 11.1% | (7.5%, 16.2%) |
| Time commitment | 40.6% | (38.9%, 42.3%) | 34.2% | (28.0%, 41.0%) |
| Ability to work while attending the nursing program | 35.5% | (33.9%, 37.2%) | 36.4% | (30.1%, 43.2%) |
| Support the program offered to second-degree nursing students | 13.9% | (12.8%, 15.1%) | 4.6% | (2.5%, 8.4%) |
| Options to take courses online | 5.9% | (5.1%, 6.8%) | * | * |
| NCLEX pass rate | 14.6% | (13.4%, 15.9%) | 9.4% | (6.1%, 14.2%) |
| School location | 47.7% | (46.0%, 49.4%) | 29.5% | (23.7%, 36.1%) |
| Location of clinicals | 20.7% | (19.3%, 22.1%) | 12.0% | (8.2%, 17.2%) |
| Accepted credits or prerequisites | 1.3% | (1.0%, 1.7%) | * | * |
| Changing or following career path to be a nurse | 1.4% | (1.1%, 1.9%) | * | * |
| More opportunities and security | 0.5% | (0.3%, 0.8%) | * | * |
| Other reasons | 6.4% | (5.6%, 7.3%) | 7.2% | (4.4%, 11.6%) |
* Data are suppressed if count is less than 10 or sample population was less than 20.
Adequately Preparedness for First Nursing Job
| Preparedness | RNs = 3,349 | LPNs = 214 | ||
|---|---|---|---|---|
| Estimate | 95% CI | Estimate | 95% CI | |
| Yes | 80.7% | (79.3%, 82.0%) | 77.5% | (71.4%, 82.6%) |
| No | 19.3% | (18.0%, 20.7%) | 22.5% | (17.4%, 28.6%) |
| Among those who said they were not adequately prepared, what would have helped includes: | ||||
| Longer clinicals or preceptorships | 47.8% | (45.1%, 50.5%) | 32.7% | (24.6%, 42.0%) |
| Online resources | 5.3% | (4.2%, 6.6%) | * | * |
| More in-person training | 55.9% | (53.2%, 58.6%) | 47.6% | (38.5%, 56.9%) |
| Skills check off | 17.1% | (15.2%, 19.2%) | 23.6% | (16.6%, 32.4%) |
| Longer orientation | 31.8% | (29.3%, 34.4%) | 31.8% | (23.8%, 41.0%) |
| Nursing residency | 39.2% | (36.6%, 41.9%) | 22.3% | (15.5%, 31.0%) |
| Mentorship | 38.1% | (35.5%, 40.8%) | 38.1% | (29.5%, 47.5%) |
| Other | 7.4% | (6.1%, 8.9%) | 8.2% | (4.4%, 14.9%) |
a Respondents were instructed to mark all that apply.
Received Admissions Benefits for Entry into the Program
| Received Admissions Benefits | RNs = 3,304 | LPNs = 213 | ||
|---|---|---|---|---|
| Estimate | 95% CI | Estimate | 95% CI | |
| Yes | 57.3% | (55.6%, 59.0%) | 42.8% | (36.3%, 49.5%) |
| No | 42.7% | (41.0%, 44.4%) | 57.2% | (50.5%, 63.7%) |
Reason for Pursuing Nursing as a Second-Degree
| Reasons | RNs = 3,307 | LPNs = 213 | ||
|---|---|---|---|---|
| Estimate | 95% CI | Estimate | 95% CI | |
| Passion for the profession | 49.8% | (48.1%, 51.5%) | 51.2% | (44.5%, 57.8%) |
| Stable career opportunities | 60.3% | (58.6%, 62.0%) | 45.0% | (38.5%, 51.7%) |
| Time available | 6.1% | (5.3%, 7.0%) | 6.5% | (3.9%, 10.6%) |
| Seeking a higher paying profession | 41.5% | (39.8%, 43.2%) | 39.6% | (33.3%, 46.3%) |
| The ability to move around in the profession | 40.5% | (38.8%, 42.2%) | 25.7% | (20.3%, 32.0%) |
| Work Schedule | 25.7% | (24.2%, 27.2%) | 12.6% | (8.8%, 17.7%) |
| Other reason | 5.1% | (4.4%, 5.9%) | 5.3% | (3.0%, 9.2%) |
a Respondents were instructed to mark all that apply.
Challenges during Transition to Nursing
| Challenges | RNs = 2,802 | LPNs = 183 | ||
|---|---|---|---|---|
| Estimate | 95% CI | Estimate | 95% CI | |
| No challenges | 5.2% | (4.4%, 6.1%) | 5.7% | (3.2%, 10.1%) |
| Among those who did experienced challenges: | ||||
| Competency struggles | 12.9% | (11.7%, 14.2%) | 11.2% | (7.4%, 16.6%) |
| Imposter syndrome | 40.4% | (38.6%, 42.2%) | 30.2% | (24.0%, 37.2%) |
| Different work hours | 34.8% | (33.1%, 36.6%) | 37.9% | (31.2%, 45.1%) |
| COVID-19 pandemic | 21.0% | (19.5%, 22.5%) | 18.0% | (13.1%, 24.2%) |
| Knowing what to specialize in | 21.1% | (19.6%, 22.6%) | 13.7% | (9.5%, 19.4%) |
| Communication with colleagues | 21.6% | (20.1%, 23.2%) | 21.4% | (16.1%, 27.9%) |
| Bullying from nurse colleagues and/or instructors | 30.6% | (28.9%, 32.3%) | 33.9% | (27.4%, 41.0%) |
| Preceptor challenges | 16.1% | (14.8%, 17.5%) | * | * |
| Other | 2.5% | (2.0%, 3.1%) | * | * |
a Respondents were instructed to mark all that apply.
* Data are suppressed if count is less than 10 or sample population was less than 20.
Acute Care after Nursing School
| Acute Care after Nursing School | RNs = 3,325 | LPNs = 214 | ||
|---|---|---|---|---|
| Estimate | 95% CI | Estimate | 95% CI | |
| Yes | 82.5% | (81.2%, 83.8%) | 39.8% | (33.5%, 46.5%) |
| No | 17.5% | (16.2%, 18.8%) | 60.2% | (53.5%, 66.5%) |
Non-Traditional Position Options after Nursing School
| Non-Traditional Position Options after Nursing School | RNs = 3,299 | LPNs = 208 | ||
|---|---|---|---|---|
| Estimate | 95% CI | Estimate | 95% CI | |
| Yes | 32.0% | (30.4%, 33.6%) | 31.9% | (26.0%, 38.4%) |
| No | 68.0% | (66.4%, 69.6%) | 68.1% | (61.6%, 74.0%) |
Benefits of Previous Employment on Nursing Career
| Benefits | RNs = 3,188 | LPNs = 209 | ||
|---|---|---|---|---|
| Estimate | 95% CI | Estimate | 95% CI | |
| Transfer of common skills | 76.8% | (75.3%, 78.2%) | 68.0% | (61.4%, 74.0%) |
| Service/patient facing | 53.2% | (51.5%, 54.9%) | 46.9% | (40.3%, 53.7%) |
| Previous leadership and/or management experience | 27.7% | (26.2%, 29.3%) | 32.0% | (26.0%, 38.6%) |
| Prior clinical experience (e.g., CNA, Medical Assistant, Phlebotomy) | 42.2% | (40.5%, 43.9%) | 42.2% | (35.7%, 49.0%) |
| Other | 1.4% | (1.0%, 1.9%) | * | * |
a Respondents were instructed to mark all that apply.
* Data are suppressed if count is less than 10 or sample population was less than 20.
Management of Financial Aspects of Returning to School
| Aspects | RNs = 3,275 | LPNs = 207 | ||
|---|---|---|---|---|
| Estimate | 95% CI | Estimate | 95% CI | |
| Student loans | 63.0% | (61.3%, 64.6%) | 68.2% | (61.6%, 74.2%) |
| Worked in my previous career while attending nursing school, using my earnings to pay for school | 35.2% | (33.6%, 36.9%) | 33.2% | (27.1%, 39.9%) |
| Used personal savings to pay for school | 39.3% | (37.6%, 41.0%) | 25.1% | (19.7%, 31.4%) |
| Help from friends and family | 31.8% | (30.2%, 33.4%) | 20.9% | (15.9%, 26.9%) |
| Worked in a health-related capacity while attending nursing school | 28.6% | (27.1%, 30.2%) | 26.5% | (21.0%, 32.9%) |
| Tuition benefit from employer | 14.5% | (13.3%, 15.7%) | 5.9% | (3.4%, 10.0%) |
a Respondents were instructed to mark all that apply.
Support Systems
| Support Systems | RNs = 3,270 | LPNs = 210 | ||
|---|---|---|---|---|
| Estimate | 95% CI | Estimate | 95% CI | |
| Additional meetings with an advisor or counselor | 9.4% | (8.4%, 10.4%) | 11.3% | (7.7%, 16.3%) |
| Friends/family | 74.1% | (72.6%, 75.6%) | 71.1% | (64.6%, 76.8%) |
| Meeting with professors and/or clinician instructors | 31.0% | (29.4%, 32.6%) | 27.4% | (21.8%, 33.8%) |
| None of these | 15.6% | (14.4%, 16.9%) | 18.0% | (13.4%, 23.8%) |
| Other | 2.6% | (2.1%, 3.2%) | * | * |
a Respondents were instructed to mark all that apply.
* Data are suppressed if count is less than 10 or sample population was less than 20.
Second Degree Nurse Recommendations on Nursing as a Second Career Choice
| Recommend Nursing as a Second Degree | RNs = 3,278 | LPNs = 210 | ||
|---|---|---|---|---|
| Estimate | 95% CI | Estimate | 95% CI | |
| Yes | 70.1% | (68.5%, 71.6%) | 68.7% | (62.1%, 74.6%) |
| No | 29.9% | (28.4%, 31.5%) | 31.3% | (25.4%, 37.9%) |
Internationally Trained Nurses
Demographics
Area of Origin for Internationally Trained Nurses in Michigan
| Area of Origin | N = 403 | |
|---|---|---|
| n | Estimate | |
| Canada | 197 | 48.9% |
| Asia | 100 | 24.8% |
| Europe | 23 | 5.7% |
| Africa | 16 | 4.0% |
| India | 15 | 3.7% |
| Middle East | 14 | 3.5% |
| United States | 13 | 3.2% |
| Central/South America | * | * |
| Other | 19 | 4.7% |
* Data are suppressed if count is less than 10 or sample population was less than 20.
Length of Time Working as a Nurse
| Years | N = 403 | |
|---|---|---|
| Estimate | 95% CI | |
| Less than 3 years | 9.5% | (7.0%, 12.8%) |
| 3 to less than 6 years | 7.6% | (5.4%, 10.6%) |
| 6 to less than 10 years | 18.5% | (15.0%, 22.6%) |
| 10 to less than 20 years | 18.3% | (14.8%, 22.4%) |
| 20 or more years | 46.0% | (41.2%, 50.9%) |
Length of Time Working as a Nurse in Michigan
| Years | N = 383 | |
|---|---|---|
| Estimate | 95% CI | |
| Less than 3 years | 34.5% | (29.9%, 39.4%) |
| 3 to less than 6 years | 11.3% | (8.5%, 14.9%) |
| 6 to less than 10 years | 9.7% | (7.1%, 13.1%) |
| 10 to less than 20 years | 13.0% | (10.0%, 16.7%) |
| 20 or more years | 31.5% | (27.1%, 36.3%) |
Education/Licensure
Duration Since Passing NCLEX
| Years | N = 399 | |
|---|---|---|
| Estimate | 95% CI | |
| Less than a year ago | * | * |
| 1 to 5 years ago | 24.6% | (20.6%, 29.1%) |
| 5 to 10 years ago | 17.9% | (14.5%, 22.0%) |
| 10+ years ago | 54.0% | (49.1%, 58.8%) |
* Data are suppressed if count is less than 10 or sample population was less than 20.
Barriers When Obtaining Michigan Nurse Licensure
| Barriers | N = 398 | |
|---|---|---|
| Estimate | 95% CI | |
| No barriers experienced | 52.3% | (47.4%, 57.2%) |
| Among those who did experience unanticipated barriers | ||
| Financial Cost | 24.3% | (20.3%, 28.7%) |
| Time Commitment | 11.5% | (8.7%, 15.0%) |
| Language Barriers | 3.5% | (2.1%, 5.8%) |
| U.S. Employer Benefits | 15.0% | (11.8%, 18.8%) |
| Country of Origin Barriers | 20.5% | (16.8%, 24.7%) |
| Other | 2.9% | (1.6%, 5.1%) |
Supports while Obtaining Michigan Nurse Licensure
| Supports | N = 397 | |
|---|---|---|
| Estimate | 95% CI | |
| Not at all supported | 15.1% | (11.9%, 19.0%) |
| Somewhat supported | 26.7% | (22.6%, 31.3%) |
| Moderately supported | 14.2% | (11.1%, 18.0%) |
| Very supported | 27.8% | (23.6%, 32.4%) |
| Extremely supported | 16.2% | (12.9%, 20.1%) |
Workforce
Finding Nursing Jobs in Michigan
| Finding Nursing Jobs | N = 395 | |
|---|---|---|
| Estimate | 95% CI | |
| U.S Recruiter | 27.3% | (23.1%, 31.9%) |
| Country of origin recruiter | 3.5% | (2.1%, 5.8%) |
| Self-applied | 55.0% | (50.1%, 59.8%) |
| Referral | 7.8% | (5.5%, 10.9%) |
| Other | 3.1% | (1.8%, 5.3%) |
Nursing Career Outside of Michigan
| Nursing Career Locations | N = 263 | |
|---|---|---|
| Estimate | 95% CI | |
| Another U.S. state | 61.1% | (55.1%, 66.8%) |
| Country of origin | 29.2% | (24.0%, 35.0%) |
| Another country | 9.7% | (6.7%, 13.9%) |
Training on Healthcare Practices in Michigan
| Had Trainings | N = 391 | |
|---|---|---|
| Estimate | 95% CI | |
| Yes | 71.2% | (66.5%, 75.5%) |
| Among those that had training on healthcare practices in Michigan, was the training: | ||
| Not at all adequate | * | * |
| Somewhat adequate | 15.7% | (11.9%, 20.4%) |
| Moderately adequate | 23.3% | (18.8%, 28.6%) |
| Very adequate | 40.0% | (34.5%, 45.8%) |
| Extremely adequate | 20.1% | (15.8%, 25.2%) |
| No | 28.8% | (24.5%, 33.5%) |
| Among those that did not have training on healthcare practices in Michigan, what would have helped: | ||
| Shorter training | * | * |
| Longer training | 43.4% | (35.2%, 52.0%) |
| Online training | 23.0% | (16.6%, 30.9%) |
| In-person option | 29.7% | (22.5%, 38.0%) |
| Skills check off | 29.0% | (21.9%, 37.3%) |
| Other | 7.9% | (4.4%, 13.8%) |
* Data are suppressed if count is less than 10 or sample population was less than 20.
Cultural
Encountering Cultural Differences in Patient Care
| Cultural Differences | N = 392 | |
|---|---|---|
| Estimate | 95% CI | |
| Yes | 72.7% | (68.1%, 76.9%) |
| No | 27.3% | (23.1%, 31.9%) |
Strategies for Adapting to Work Environments
| Strategies | N = 354 | |
|---|---|---|
| Estimate | 95% CI | |
| Hospital onboarding program | 52.1% | (46.9%, 57.3%) |
| Connection with cultural community groups | 18.3% | (14.6%, 22.7%) |
| Connection with religious/spiritual community groups | 9.8% | (7.1%, 13.3%) |
| Mentor within facility | 52.7% | (47.5%, 57.8%) |
| Mentor in the community | 7.2% | (4.9%, 10.4%) |
| Other | 9.8% | (7.1%, 13.3%) |
Frequency of Cultural Misunderstandings or Conflicts
| Cultural Misunderstandings | N = 379 | |
|---|---|---|
| Estimate | 95% CI | |
| No | 35.4% | (30.8%, 40.3%) |
| Among those that had have experienced misunderstandings or conflicts: | ||
| Once a year or less | 24.8% | (20.7%, 29.4%) |
| A few times a year | 27.5% | (23.2%, 32.2%) |
| Monthly | 6.0% | (4.0%, 8.9%) |
| Weekly | 5.0% | (3.2%, 7.7%) |
| Daily | * | * |
* Data are suppressed if count is less than 10 or sample population was less than 20.
Effect of Misunderstandings or Conflicts on Nursing Care
| Effects | N = 316 | |
|---|---|---|
| Estimate | 95% CI | |
| Positively impacted my nursing care | 33.8% | (28.8%, 39.2%) |
| Negatively impacted my nursing care | 14.4% | (11.0%, 18.7%) |
| The impact on my nursing care was indifferent | 51.8% | (46.3%, 57.3%) |
Resources
Satisfaction with Support during Nursing Transitions
| Supports | N = 376 | |
|---|---|---|
| Estimate | 95% CI | |
| Provided by Colleagues, Mentors, and other staff | ||
| Not at all satisfied | 4.2% | (2.6%, 6.7%) |
| Somewhat satisfied | 18.3% | (14.7%, 22.5%) |
| Moderately satisfied | 28.2% | (23.9%, 33.0%) |
| Very satisfied | 35.2% | (30.5%, 40.2%) |
| Extremely satisfied | 14.1% | (10.9%, 18.0%) |
| Provided by Employer | ||
| Not at all satisfied | 10.9% | (8.1%, 14.5%) |
| Somewhat satisfied | 22.9% | (18.9%, 27.4%) |
| Moderately satisfied | 27.9% | (23.6%, 32.7%) |
| Very satisfied | 26.5% | (22.3%, 31.2%) |
| Extremely satisfied | 11.8% | (8.9%, 15.5%) |
Beneficial Additional Supports
| Supports | N = 245 | |
|---|---|---|
| Estimate | 95% CI | |
| Dedicated help for NCLEX | 22.2% | (17.4%, 27.8%) |
| Mentor | 37.1% | (31.3%, 43.3%) |
| Long-term preceptorship | 37.1% | (31.3%, 43.3%) |
| Familial support | 15.3% | (11.3%, 20.3%) |
| Housing support | 26.0% | (20.9%, 31.8%) |
| Food support | 12.6% | (9.0%, 17.3%) |
| Communication Support | 28.4% | (23.1%, 34.3%) |
| Other | 8.2% | (5.4%, 12.3%) |


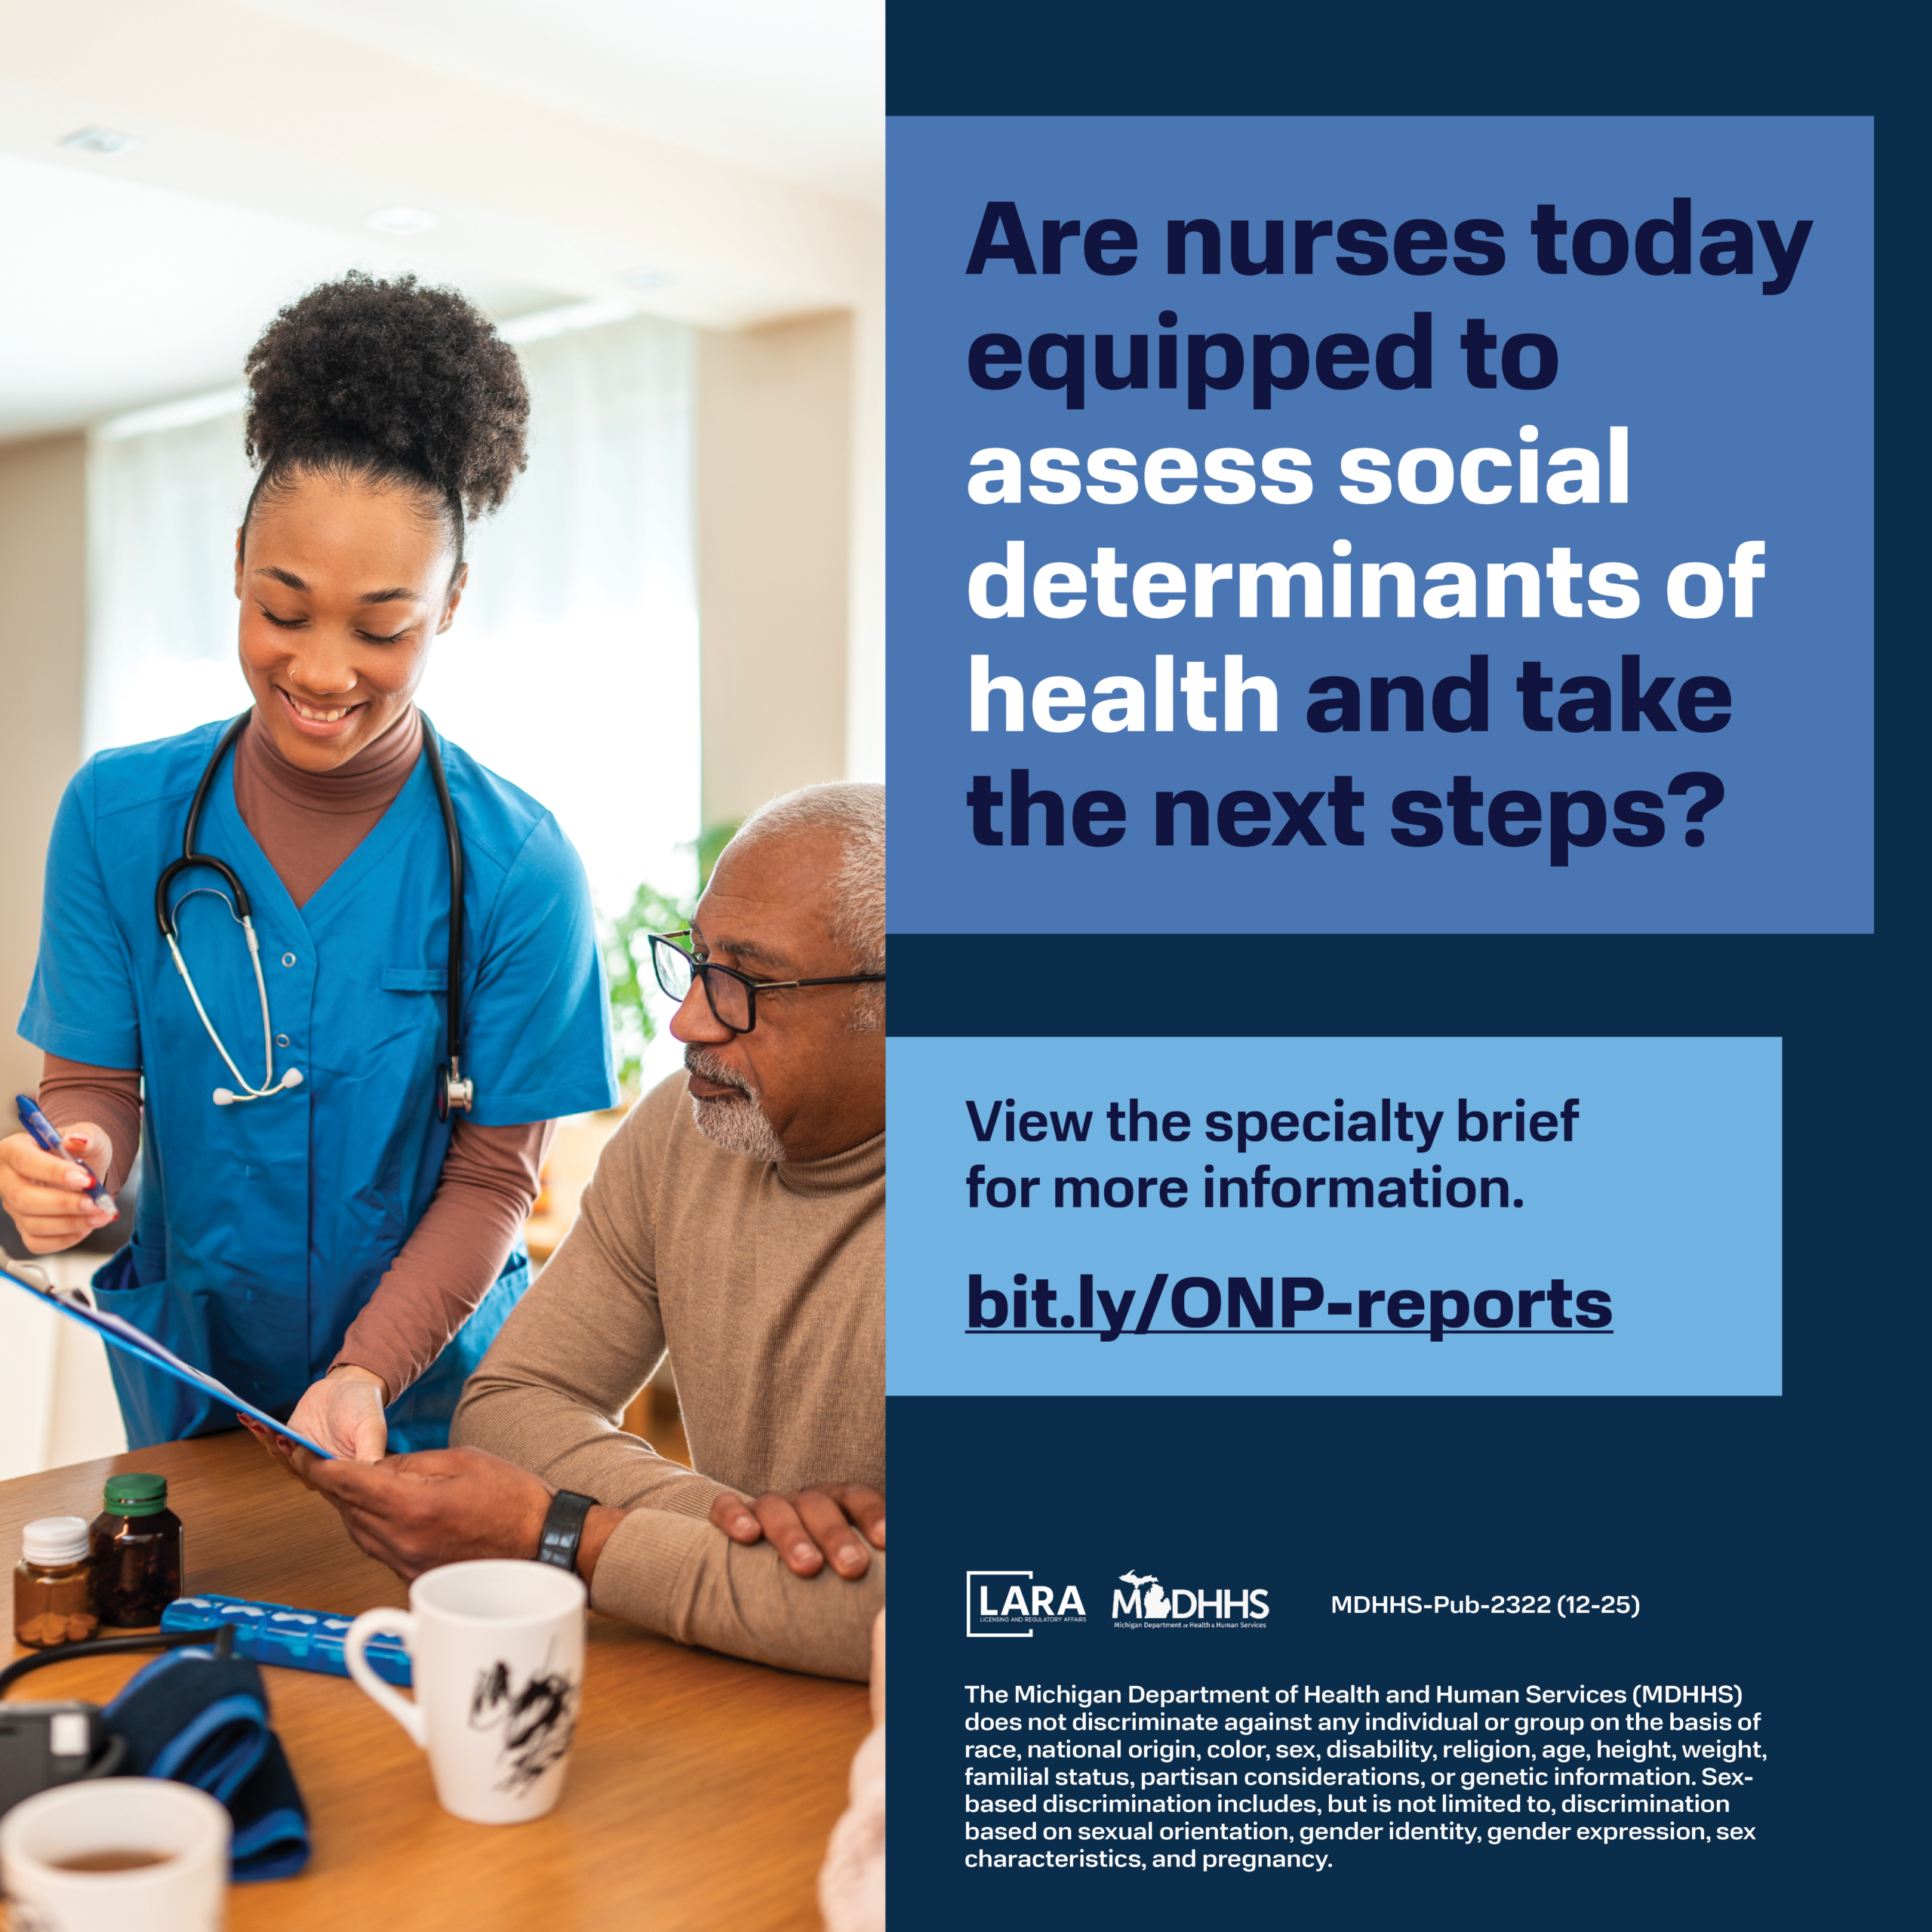
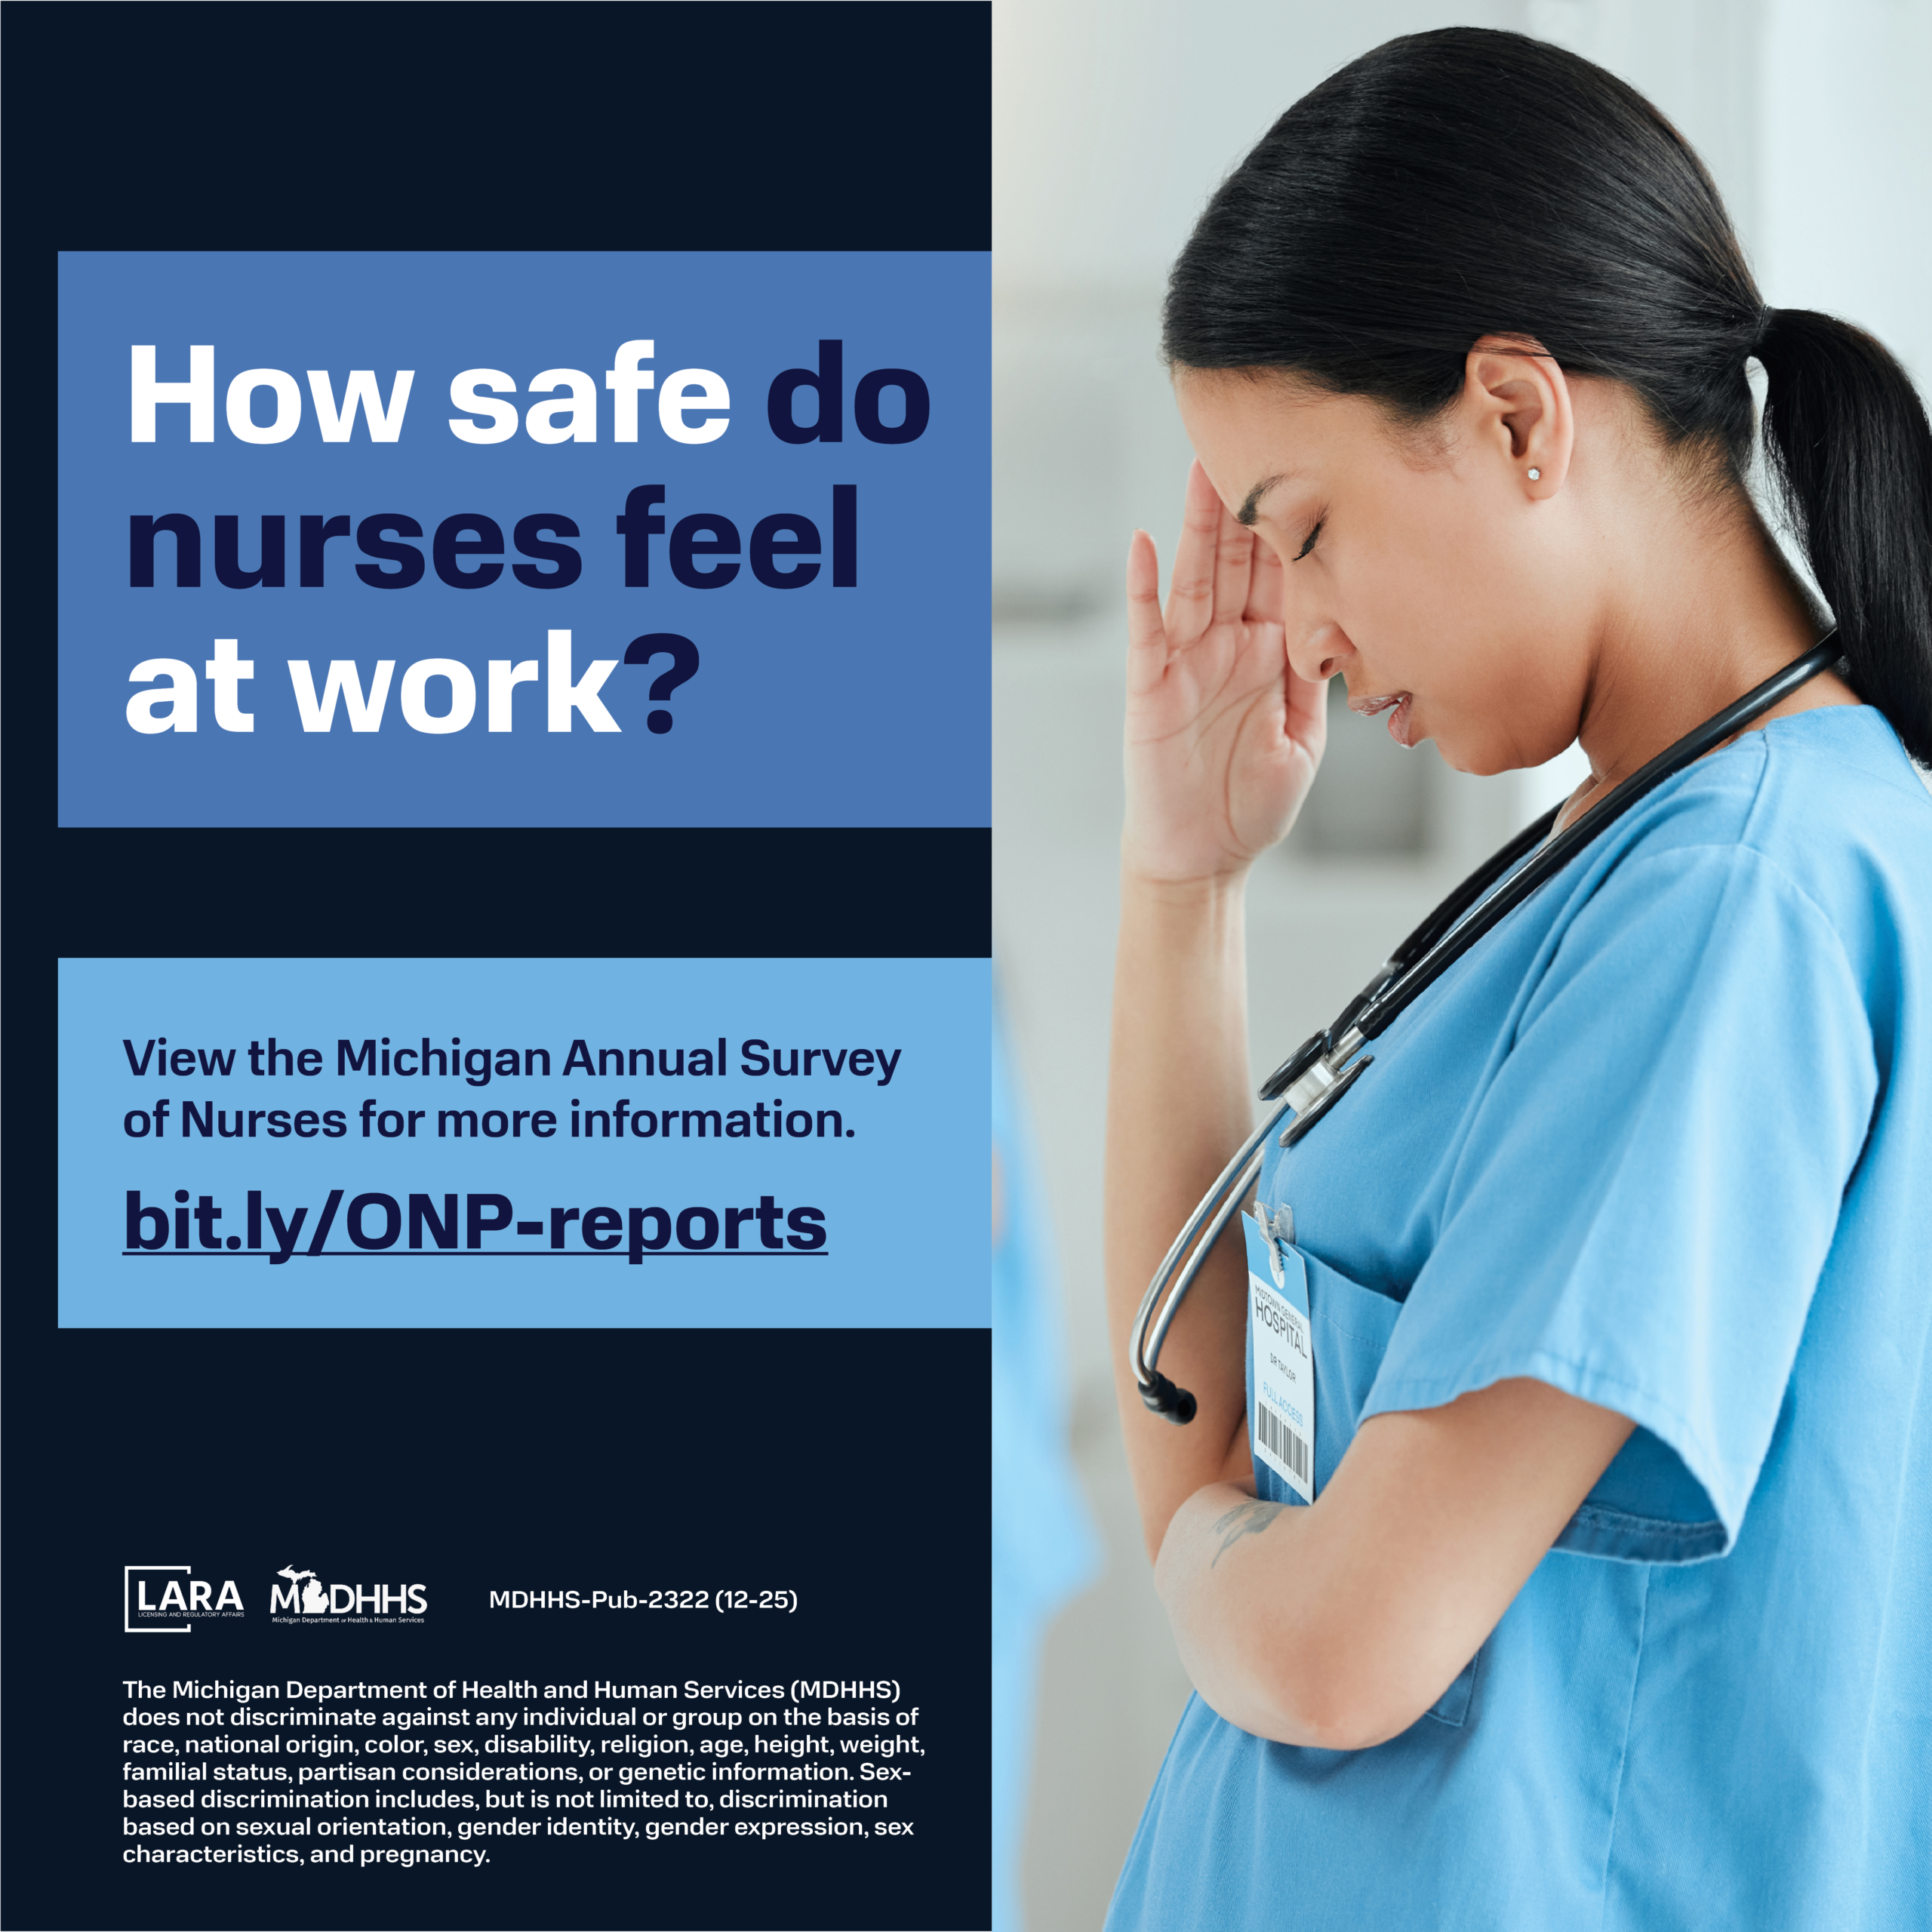