Michigan Nurse Licensure Data websites will be taken off minurse.org in Fall 2026. The Number & Rate of Michigan Nurses and Changes in Michigan Licensed Nurse Populations information will be moved to https://minurse.org/survey-data/. If you have any questions or concerns, please contact us at info@minurse.org.
This website focuses on data obtained from the Michigan Bureau of Professional Licensing and includes all nurses who are currently licensed to practice in Michigan. This website provides information that illustrates the distribution of nurses in Michigan, both in absolute numbers and relative to the State’s population distribution. Information regarding the age distribution of nurses across the state is also included. The information is presented in easy to use maps, tables and charts.
Michigan Overall
Michigan Licensed Nurses by Type and Residency
Residence
Total
RNs
LPNs
# of Nurses
%
# of Nurses
%
# of Nurses
%
Michigan
155,849
87.7
134,682
86.8
21,167
94.4
Ohio
3,001
1.7
2,701
1.7
300
1.3
Indiana
1,222
0.7
1,122
0.7
100
0.4
Wisconsin
949
0.5
842
0.5
107
0.5
Minnesota
296
0.2
285
0.2
11
0.0
Other U.S. States
13,091
7.4
12,385
8.0
706
3.1
Canada
2,837
1.6
2,799
1.8
38
0.2
Other Countries
388
0.2
383
0.2
*
*
Total
177,633
100.0
155,199
100.0
22,434
100.0
*Cells with less than 6 nurses were censored
License Type
Living in Michigan
Living Outside
Michigan
Total
#
%
#
%
Total
155,849
87.7%
21,784
12.3%
177,633
LPNs
21,167
94.4%
1,267
5.6%
22,434
RNs
134,682
86.8%
20,517
13.2%
155,199
NPs
8,405
88.7%
1,073
11.3%
9,478
CNAs
2,444
86.4%
386
13.6%
2,830
CNMs
405
89.4%
48
10.6%
453
CNSs
212
95.5%
10
4.5%
222
Total Michigan Nurses (LPNs and RNs) by Prosperity Region and County
Region
# of Nurses
Population*
Nurses per 10,000
Michigan*
177,633
9,995,915
177.7
Eastern/Central/Western UP
5,621
301,151
186.7
Northwest LP
5,536
305,938
181.0
Northeast LP
3,185
202,897
157.0
West/West Central
23,613
1,607,914
146.9
East Central
9,276
560,228
165.6
East
13,895
847,313
164.0
South Central
6,120
481,893
127.0
Southwest
11,256
785,264
143.3
Southeast
18,610
1,015,464
183.3
Detroit Metro
58,737
3,887,853
151.1
*Includes nurses who live outside of Michigan
*Population data are from 2016 census estimates obtained from www.michigan.gov/census.*Population data are from 2016 census estimates obtained from www.michigan.gov/census.
Region
County
# of Nurses
Population*
Nurses per 10,000
Eastern/ Central/ Western UP
5,621
301,151
186.7
Alger
134
9,097
147.3
Baraga
136
8,320
163.5
Chippewa
505
37,517
134.6
Delta
688
35,857
191.9
Dickinson
536
25,383
211.2
Gogebic
262
15,096
173.6
Houghton
697
36,219
192.4
Iron
186
11,117
167.3
Keweenaw
46
2,113
217.7
Luce
80
6,283
127.3
Mackinac
144
10,787
133.5
Marquette
1,697
66,516
255.1
Menominee
277
22,983
120.5
Ontonagon
90
5,795
155.3
Schoolcraft
143
8,068
177.2
Northwest LP
5,536
305,938
181.0
Antrim
311
23,365
133.1
Benzie
356
17,753
200.5
Charlevoix
447
26,244
170.3
Emmet
756
33,308
227.0
Grand Traverse
2,076
92,573
224.3
Kalkaska
184
17,824
103.2
Leelanau
469
21,764
215.5
Manistee
325
24,528
132.5
Missaukee
188
15,113
124.4
Wexford
424
33,466
126.7
Northeast LP
3,185
202,897
157.0
Alcona
144
10,362
139.0
Alpena
621
28,360
219.0
Cheboygan
326
25,413
128.3
Crawford
220
13,901
158.3
Iosco
354
25,081
141.1
Montmorency
112
9,265
120.9
Ogemaw
384
20,952
183.3
Oscoda
85
8,276
102.7
Otsego
393
24,665
159.3
Presque Isle
208
12,738
163.3
Roscommon
338
23,884
141.5
West/West Central
23,613
1,607,914
146.9
Allegan
1,553
117,327
132.4
Barry
1,007
61,157
164.7
Ionia
712
64,210
110.9
Kent
10,337
653,786
158.1
Lake
82
11,881
69.0
Mason
548
29,100
188.3
Mecosta
418
43,545
96.0
Montcalm
891
63,968
139.3
Muskegon
2,268
173,588
130.7
Newaygo
551
48,892
112.7
Oceana
270
26,625
101.4
Osceola
262
23,341
112.2
Ottawa
4,714
290,494
162.3
East Central
9,276
560,228
165.6
Arenac
273
15,041
181.5
Bay
2,193
103,923
211.0
Clare
400
30,757
130.1
Gladwin
416
25,337
164.2
Gratiot
590
40,599
145.3
Isabella
746
70,562
105.7
Midland
1,491
83,209
179.2
Saginaw
3,167
190,800
166.0
East
13,895
847,313
164.0
Genesee
6,538
406,892
160.7
Huron
545
31,166
174.9
Lapeer
1,487
88,028
168.9
Saint Clair
2,894
159,337
181.6
Sanilac
587
41,182
142.5
Shiawassee
997
68,192
146.2
Tuscola
847
52,516
161.3
South Central
6,120
481,893
127.0
Clinton
1,387
79,332
174.8
Eaton
1,570
109,826
143.0
Ingham
3,163
292,735
108.0
Southwest
11,256
785,264
143.3
Berrien
2,041
154,141
132.4
Branch
552
43,622
126.5
Calhoun
1,979
134,487
147.2
Cass
464
51,653
89.8
Kalamazoo
4,357
264,870
164.5
Saint Joseph
780
61,043
127.8
Van Buren
1,083
75,448
143.5
Southeast
18,610
1,015,464
183.3
Hillsdale
626
45,749
136.8
Jackson
2,659
158,823
167.4
Lenawee
1,530
98,266
155.7
Livingston
4,205
191,224
219.9
Monroe
3,001
150,439
199.5
Washtenaw
6,589
370,963
177.6
Detroit Metro
58,737
3,887,853
151.1
Macomb
14,106
874,759
161.3
Oakland
20,929
1,259,201
166.2
Wayne
23,702
1,753,893
135.1
Michigan*
177,633
9,995,915
177.7
*Includes nurses who live outside of Michigan
*Population data are based on 2023 census data
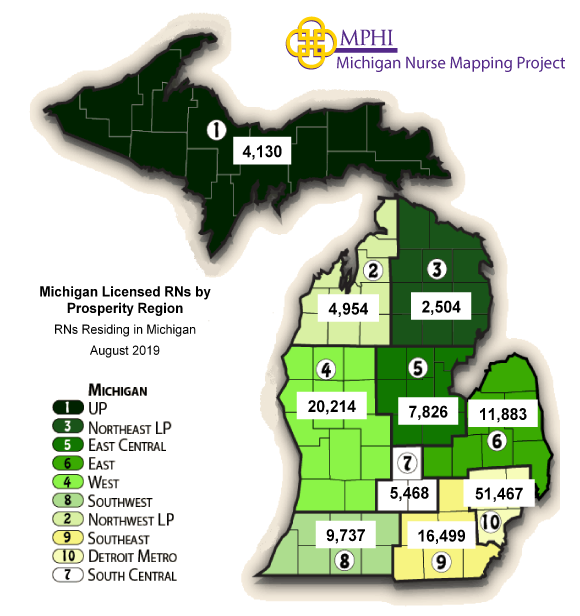
State Distribution
Michigan Licensed Registered Nurses (RNs)
Region
# of RNs
Population*
RNs per 10,000
Michigan
155,199
9,995,915
155.3
Eastern/Central/Western UP
4,130
301,151
137.1
Northwest LP
4,954
305,938
161.9
Northeast LP
2,504
202,897
123.4
West/West Central
20,214
1,607,914
125.7
East Central
7,826
560,228
139.7
East
11,883
847,313
140.2
South Central
5,468
481,893
113.5
Southwest
9,737
785,264
124.0
Southeast
16,499
1,015,464
162.5
Detroit Metro
51,467
3,887,853
132.4
*Population data are from 2016 census estimates obtained from www.michigan.gov/census.
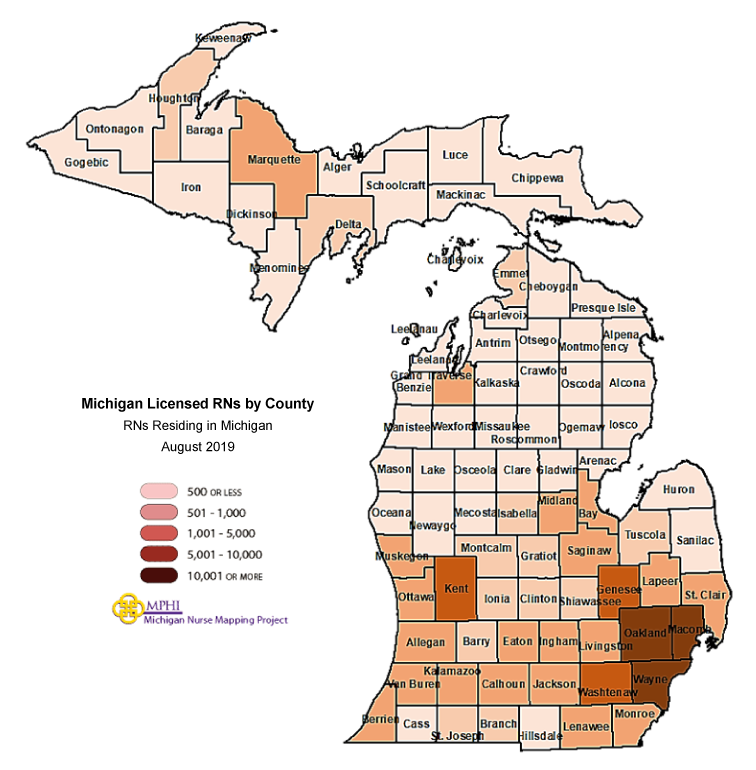
Region
County
# of RNs
Population*
RNs per 10,000
Eastern/ Central/ Western UP
4,130
301,151
137.1
Alger
94
9,097
103.3
Baraga
97
8,320
116.6
Chippewa
376
37,517
100.2
Delta
533
35,857
148.6
Dickinson
392
25,383
154.4
Gogebic
185
15,096
122.5
Houghton
580
36,219
160.1
Iron
145
11,117
130.4
Keweenaw
42
2,113
198.8
Luce
56
6,283
89.1
Mackinac
105
10,787
97.3
Marquette
1,165
66,516
175.1
Menominee
188
22,983
81.8
Ontonagon
71
5,795
122.5
Schoolcraft
101
8,068
125.2
Northwest LP
4,954
305,938
161.9
Antrim
255
23,365
109.1
Benzie
312
17,753
175.7
Charlevoix
413
26,244
157.4
Emmet
721
33,308
216.5
Grand Traverse
1,877
92,573
202.8
Kalkaska
151
17,824
84.7
Leelanau
429
21,764
197.1
Manistee
279
24,528
113.7
Missaukee
153
15,113
101.2
Wexford
364
33,466
108.8
Northeast LP
2,504
202,897
123.4
Alcona
109
10,362
105.2
Alpena
459
28,360
161.8
Cheboygan
293
25,413
115.3
Crawford
164
13,901
118.0
Iosco
265
25,081
105.7
Montmorency
90
9,265
97.1
Ogemaw
309
20,952
147.5
Oscoda
65
8,276
78.5
Otsego
328
24,665
133.0
Presque Isle
169
12,738
132.7
Roscommon
253
23,884
105.9
West/West Central
20,214
1,607,914
125.7
Allegan
1,345
117,327
114.6
Barry
852
61,157
139.3
Ionia
577
64,210
89.9
Kent
8,975
653,786
137.3
Lake
70
11,881
58.9
Mason
471
29,100
161.9
Mecosta
370
43,545
85.0
Montcalm
698
63,968
109.1
Muskegon
1,861
173,588
107.2
Newaygo
455
48,892
93.1
Oceana
222
26,625
83.4
Osceola
219
23,341
93.8
Ottawa
4,099
290,494
141.1
East Central
7,826
560,228
139.7
Arenac
213
15,041
141.6
Bay
1,860
103,923
179.0
Clare
315
30,757
102.4
Gladwin
344
25,337
135.8
Gratiot
475
40,599
117.0
Isabella
606
70,562
85.9
Midland
1,321
83,209
158.8
Saginaw
2,692
190,800
141.1
East
11,883
847,313
140.2
Genesee
5,874
406,892
144.4
Huron
360
31,166
115.5
Lapeer
1,316
88,028
149.5
Saint Clair
2,343
159,337
147.0
Sanilac
439
41,182
106.6
Shiawassee
910
68,192
133.4
Tuscola
641
52,516
122.1
South Central
5,468
481,893
113.5
Clinton
1,285
79,332
162.0
Eaton
1,385
109,826
126.1
Ingham
2,798
292,735
95.6
Southwest
9,737
785,264
124.0
Berrien
1,787
154,141
115.9
Branch
435
43,622
99.7
Calhoun
1,632
134,487
121.4
Cass
396
51,653
76.7
Kalamazoo
3,911
264,870
147.7
Saint Joseph
595
61,043
97.5
Van Buren
981
75,448
130.0
Southeast
16,499
1,015,464
162.5
Hillsdale
498
45,749
108.9
Jackson
2,235
158,823
140.7
Lenawee
1,231
98,266
125.3
Livingston
3,961
191,224
207.1
Monroe
2,321
150,439
154.3
Washtenaw
6,253
370,963
168.6
Detroit Metro
51,467
3,887,853
132.4
Macomb
12,567
874,759
143.7
Oakland
19,251
1,259,201
152.9
Wayne
19,649
1,753,893
112.0
Michigan
155,199
9,995,915
155.3
*To see other regions, please press the “Next” button at the bottom of the table.
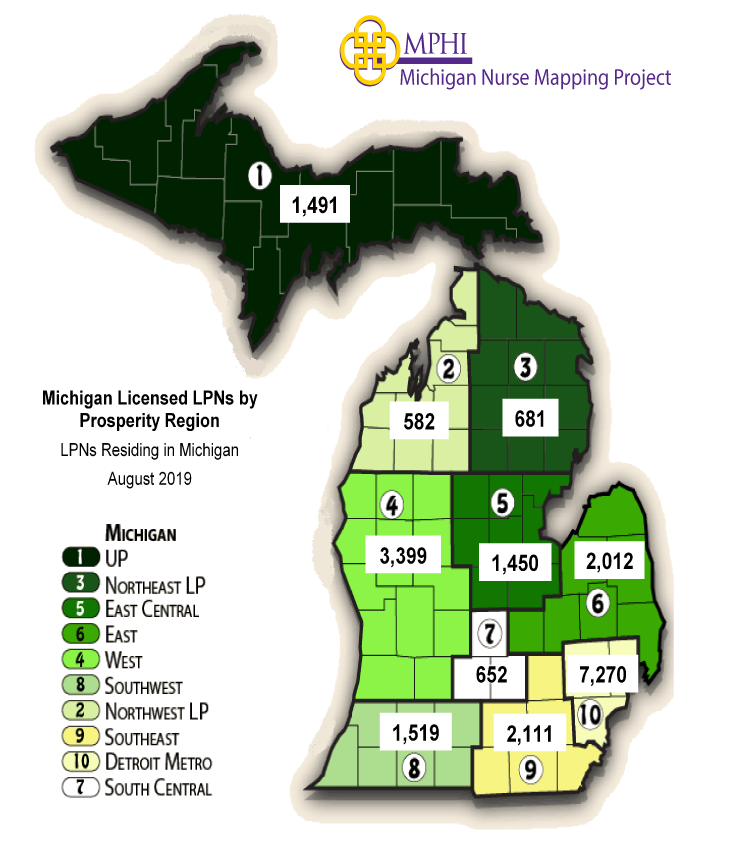
*Population data are from 2016 census estimates obtained from www.michigan.gov/census.Michigan Licensed Practical Nurses (LPNs)
Region
# of LPNs
Population*
LPNs per 10,000
Michigan
22,434
9,995,915
22.4
Eastern/Central/Western UP
1,491
301,151
49.5
Northwest LP
582
305,938
19.0
Northeast LP
681
202,897
33.6
West/West Central
3,399
1,607,914
21.1
East Central
1,450
560,228
25.9
East
2,012
847,313
23.7
South Central
652
481,893
13.5
Southwest
1,519
785,264
19.3
Southeast
2,111
1,015,464
20.8
Detroit Metro
7,270
3,887,853
18.7
*Population data are from 2016 census estimates obtained from www.michigan.gov/census.
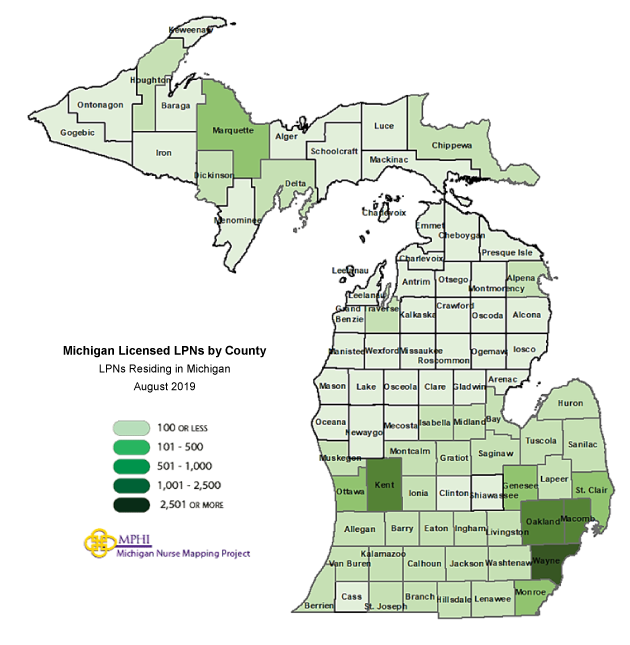
Region
County
# of LPNs
Population*
LPNs per 10,000
Eastern/ Central/ Western UP
1,491
301,151
49.5
Alger
40
9,097
44.0
Baraga
39
8,320
46.9
Chippewa
129
37,517
34.4
Delta
155
35,857
43.2
Dickinson
144
25,383
56.7
Gogebic
77
15,096
51.0
Houghton
117
36,219
32.3
Iron
41
11,117
36.9
Keweenaw
*
2,113
*
Luce
24
6,283
38.2
Mackinac
39
10,787
36.2
Marquette
532
66,516
80.0
Menominee
89
22,983
38.7
Ontonagon
19
5,795
32.8
Schoolcraft
42
8,068
52.1
Northwest LP
582
305,938
19.0
Antrim
56
23,365
24.0
Benzie
44
17,753
24.8
Charlevoix
34
26,244
13.0
Emmet
35
33,308
10.5
Grand Traverse
199
92,573
21.5
Kalkaska
33
17,824
18.5
Leelanau
40
21,764
18.4
Manistee
46
24,528
18.8
Missaukee
35
15,113
23.2
Wexford
60
33,466
17.9
Northeast LP
681
202,897
33.6
Alcona
35
10,362
33.8
Alpena
162
28,360
57.1
Cheboygan
33
25,413
13.0
Crawford
56
13,901
40.3
Iosco
89
25,081
35.5
Montmorency
22
9,265
23.7
Ogemaw
75
20,952
35.8
Oscoda
20
8,276
24.2
Otsego
65
24,665
26.4
Presque Isle
39
12,738
30.6
Roscommon
85
23,884
35.6
West/West Central
3,399
1,607,914
21.1
Allegan
208
117,327
17.7
Barry
155
61,157
25.3
Ionia
135
64,210
21.0
Kent
1,362
653,786
20.8
Lake
12
11,881
10.1
Mason
77
29,100
26.5
Mecosta
48
43,545
11.0
Montcalm
193
63,968
30.2
Muskegon
407
173,588
23.4
Newaygo
96
48,892
19.6
Oceana
48
26,625
18.0
Osceola
43
23,341
18.4
Ottawa
615
290,494
21.2
East Central
1,450
560,228
25.9
Arenac
60
15,041
39.9
Bay
333
103,923
32.0
Clare
85
30,757
27.6
Gladwin
72
25,337
28.4
Gratiot
115
40,599
28.3
Isabella
140
70,562
19.8
Midland
170
83,209
20.4
Saginaw
475
190,800
24.9
East
2,012
847,313
23.7
Genesee
664
406,892
16.3
Huron
185
31,166
59.4
Lapeer
171
88,028
19.4
Saint Clair
551
159,337
34.6
Sanilac
148
41,182
35.9
Shiawassee
87
68,192
12.8
Tuscola
206
52,516
39.2
South Central
652
481,893
13.5
Clinton
102
79,332
12.9
Eaton
185
109,826
16.8
Ingham
365
292,735
12.5
Southwest
1,519
785,264
19.3
Berrien
254
154,141
16.5
Branch
117
43,622
26.8
Calhoun
347
134,487
25.8
Cass
68
51,653
13.2
Kalamazoo
446
264,870
16.8
Saint Joseph
185
61,043
30.3
Van Buren
102
75,448
13.5
Southeast
2,111
1,015,464
20.8
Hillsdale
128
45,749
28.0
Jackson
424
158,823
26.7
Lenawee
299
98,266
30.4
Livingston
244
191,224
12.8
Monroe
680
150,439
45.2
Washtenaw
336
370,963
9.1
Detroit Metro
7,270
3,887,853
18.7
Macomb
1,539
874,759
17.6
Oakland
1,678
1,259,201
13.3
Wayne
4,053
1,753,893
23.1
Michigan
22,434
9,995,915
22.4
*To see other regions, please press the “Next” button at the bottom of the table.
*Cells with less than 6 nurses were censored
*Population data are from 2016 census estimates obtained from www.michigan.gov/census.
*Cells with less than 6 nurses were censored.Michigan Licensed Nurse Practitioners (NPs)
Region
# of Nurses
Population*
Nurses per 10,000
Michigan*
9,478
9,995,915
9.5
Eastern/Central/Western UP
258
301,151
8.6
Northwest LP
319
305,938
10.4
Northeast LP
151
202,897
7.4
West/West Central
1,236
1,607,914
7.7
East Central
419
560,228
7.5
East
478
847,313
5.6
South Central
306
481,893
6.3
Southwest
567
785,264
7.2
Southeast
1,172
1,015,464
11.5
Detroit Metro
3,499
3,887,853
9.0
*Population data are from 2016 census estimates obtained from www.michigan.gov/census.
Region
County
# of NPs
Population*
NPs per 10,000
Eastern/ Central/ Western UP
258
301,151
8.6
Alger
*
9,097
*
Baraga
*
8,320
*
Chippewa
35
37,517
9.3
Delta
24
35,857
6.7
Dickinson
20
25,383
7.9
Gogebic
9
15,096
6.0
Houghton
26
36,219
7.2
Iron
11
11,117
9.9
Keweenaw
*
2,113
*
Luce
*
6,283
*
Mackinac
8
10,787
7.4
Marquette
84
66,516
12.6
Menominee
11
22,983
4.8
Ontonagon
7
5,795
12.1
Schoolcraft
8
8,068
9.9
Northwest LP
319
305,938
10.4
Antrim
17
23,365
7.3
Benzie
15
17,753
8.4
Charlevoix
15
26,244
5.7
Emmet
49
33,308
14.7
Grand Traverse
137
92,573
14.8
Kalkaska
10
17,824
5.6
Leelanau
41
21,764
18.8
Manistee
17
24,528
6.9
Missaukee
*
15,113
*
Wexford
16
33,466
4.8
Northeast LP
151
202,897
7.4
Alcona
*
10,362
*
Alpena
33
28,360
11.6
Cheboygan
12
25,413
4.7
Crawford
8
13,901
5.8
Iosco
19
25,081
7.6
Montmorency
*
9,265
*
Ogemaw
19
20,952
9.1
Oscoda
*
8,276
*
Otsego
25
24,665
10.1
Presque Isle
*
12,738
*
Roscommon
17
23,884
7.1
West/West Central
1,236
1,607,914
7.7
Allegan
59
117,327
5.0
Barry
36
61,157
5.9
Ionia
24
64,210
3.7
Kent
711
653,786
10.9
Lake
*
11,881
*
Mason
16
29,100
5.5
Mecosta
16
43,545
3.7
Montcalm
30
63,968
4.7
Muskegon
80
173,588
4.6
Newaygo
15
48,892
3.1
Oceana
12
26,625
4.5
Osceola
6
23,341
2.6
Ottawa
229
290,494
7.9
East Central
419
560,228
7.5
Arenac
9
15,041
6.0
Bay
81
103,923
7.8
Clare
8
30,757
2.6
Gladwin
12
25,337
4.7
Gratiot
28
40,599
6.9
Isabella
29
70,562
4.1
Midland
75
83,209
9.0
Saginaw
177
190,800
9.3
East
478
847,313
5.6
Genesee
232
406,892
5.7
Huron
16
31,166
5.1
Lapeer
55
88,028
6.2
Saint Clair
98
159,337
6.2
Sanilac
18
41,182
4.4
Shiawassee
34
68,192
5.0
Tuscola
25
52,516
4.8
South Central
306
481,893
6.3
Clinton
68
79,332
8.6
Eaton
66
109,826
6.0
Ingham
172
292,735
5.9
Southwest
567
785,264
7.2
Berrien
98
154,141
6.4
Branch
23
43,622
5.3
Calhoun
97
134,487
7.2
Cass
21
51,653
4.1
Kalamazoo
248
264,870
9.4
Saint Joseph
35
61,043
5.7
Van Buren
45
75,448
6.0
Southeast
1,172
1,015,464
11.5
Hillsdale
21
45,749
4.6
Jackson
123
158,823
7.7
Lenawee
55
98,266
5.6
Livingston
232
191,224
12.1
Monroe
135
150,439
9.0
Washtenaw
606
370,963
16.3
Detroit Metro
3,499
3,887,853
9.0
Macomb
762
874,759
8.7
Oakland
1,574
1,259,201
12.5
Wayne
1,163
1,753,893
6.6
Michigan
9,478
9,995,915
9.5
“*To see other regions, please press the “”Next”” button at the bottom of the table.
*Cells with less than 6 nurses were censored “
Michigan Certified Nurse Midwives (CNMs)
Region
# of CNMs
Population*
CNMs per 10,000
Michigan
453
9,995,915
0.5
Eastern/Central/Western UP
9
301,151
0.3
Northwest LP
17
305,938
0.6
Northeast LP
*
202,897
*
West/West Central
55
1,607,914
0.3
East Central
18
560,228
0.3
East
10
847,313
0.1
South Central
13
481,893
0.3
Southwest
52
785,264
0.7
Southeast
82
1,015,464
0.8
Detroit Metro
146
3,887,853
0.4
*Population data are from 2016 census estimates obtained from www.michigan.gov/census.
*Cells with less than 6 nurses were censored.Michigan Certified Registered Nurse Anesthetists (CRNAs)
Region
# of CRNAs
Population*
CRNAs per 10,000
Michigan
2,830
9,995,915
2.8
Eastern/Central/Western UP
58
301,151
1.9
Northwest LP
68
305,938
2.2
Northeast LP
26
202,897
1.3
West/West Central
184
1,607,914
1.1
East Central
95
560,228
1.7
East
175
847,313
2.1
South Central
83
481,893
1.7
Southwest
139
785,264
1.8
Southeast
293
1,015,464
2.9
Detroit Metro
1,323
3,887,853
3.4
*Population data are from 2016 census estimates obtained from www.michigan.gov/census.
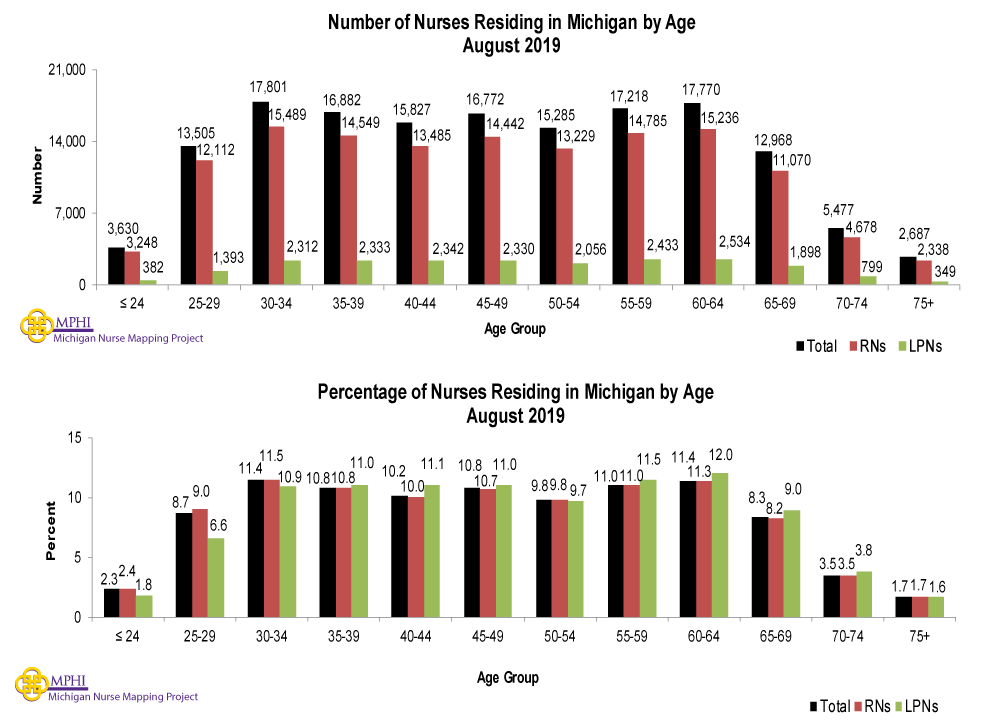
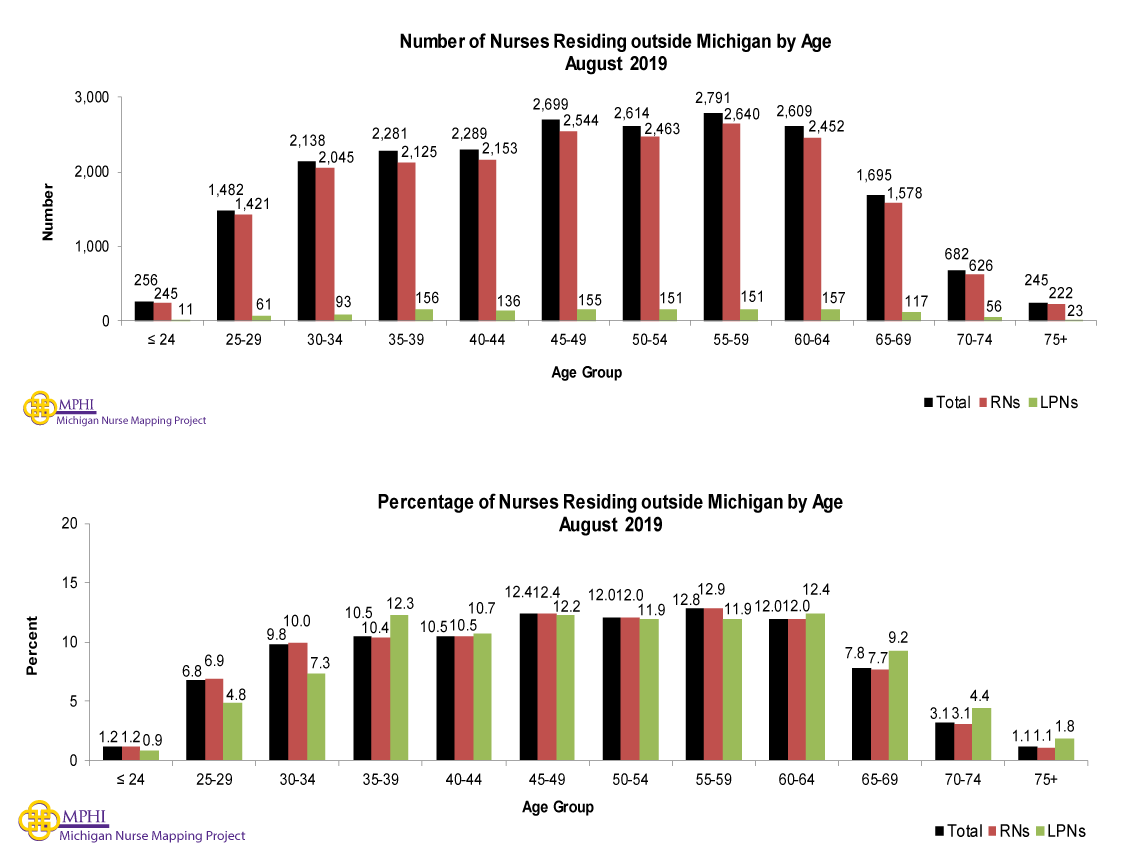
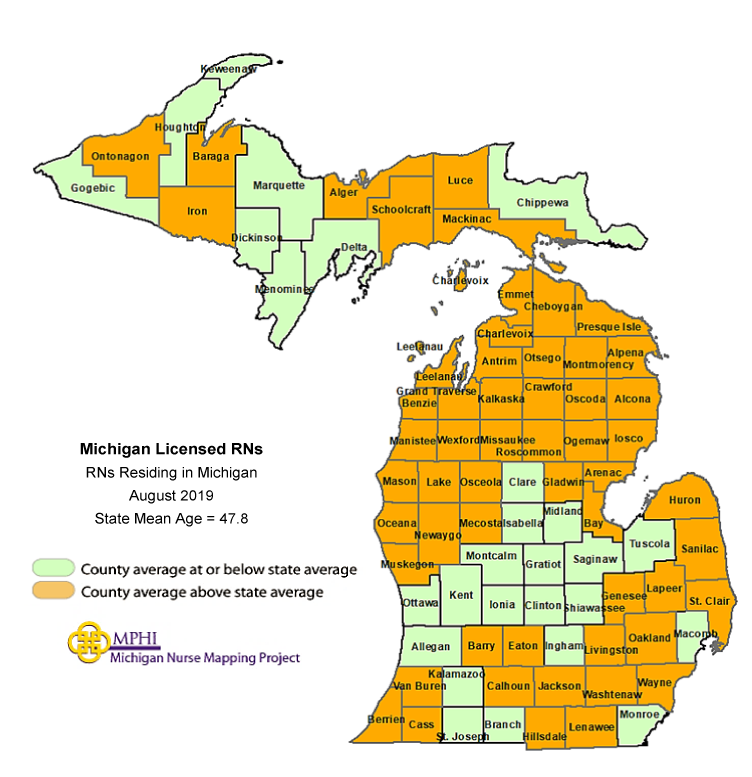
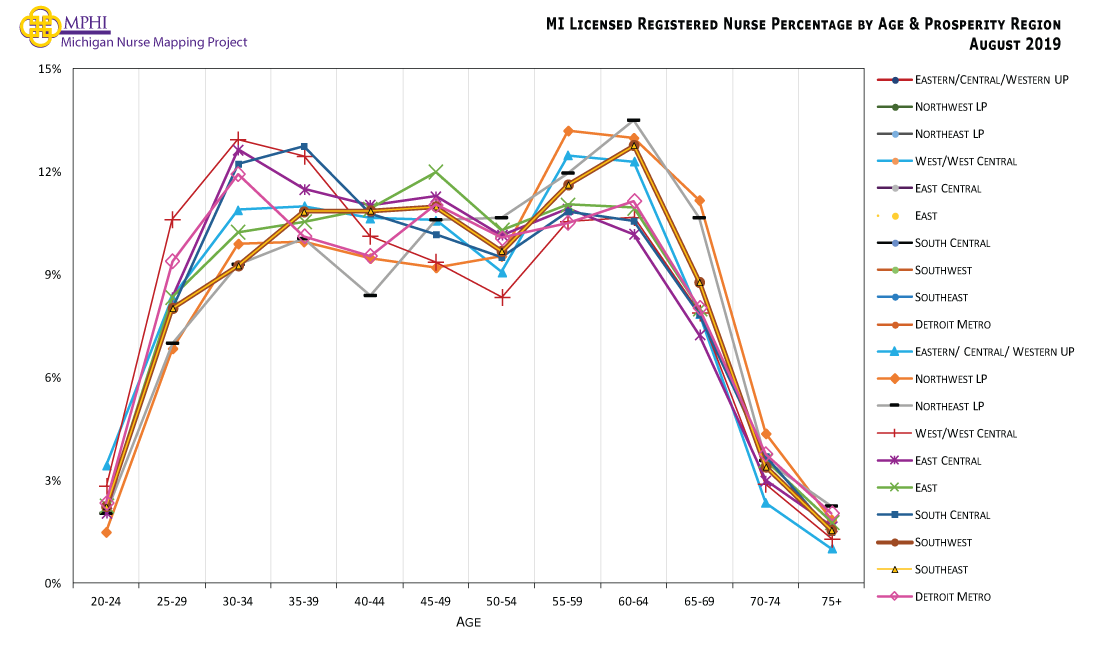
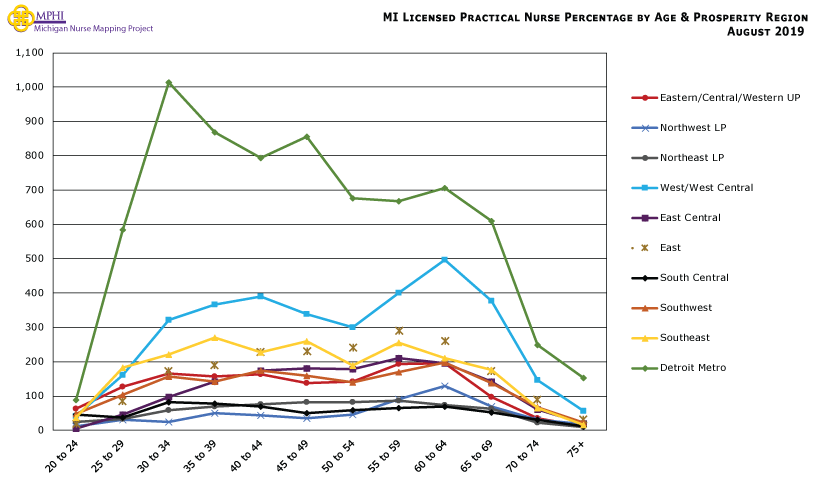
Age Distribution
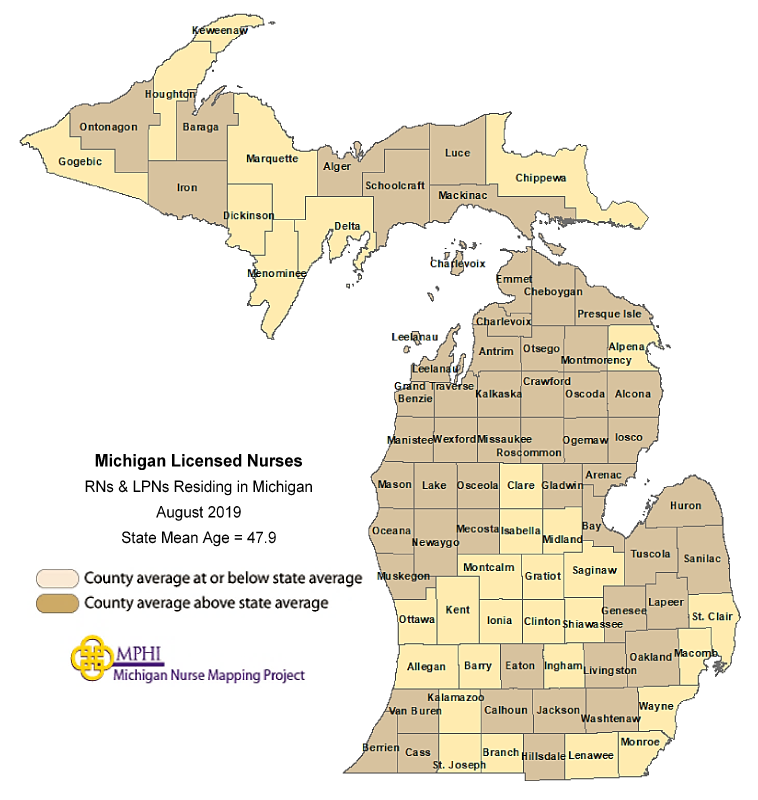
StatewideAge Distribution of Michigan Licensed Nurses Residing in MichiganAge Distribution of Michigan Licensed Nurses Residing Outside of MichiganCounty Michigan Licensed RNs Mean Age by County
Total RN
Average Age
Median Age
Michigan
155,199
47.9
48.0
Eastern/ Central/ Western UP
4,130
0.0
0.0
Alger
94
50.3
51.5
Baraga
97
50.8
54.0
Chippewa
376
47.3
48.0
Delta
533
45.9
45.0
Dickinson
392
46.6
47.0
Gogebic
185
46.7
48.0
Houghton
580
46.0
45.0
Iron
145
51.9
55.0
Keweenaw
42
47.4
47.0
Luce
56
50.1
50.0
Mackinac
105
49.3
50.0
Marquette
1,165
47.3
47.0
Menominee
188
46.2
45.0
Ontonagon
71
47.6
49.0
Schoolcraft
101
48.7
52.0
Northwest LP
4,954
0.0
0.0
Antrim
255
53.3
56.0
Benzie
312
49.7
50.0
Charlevoix
413
50.7
53.0
Emmet
721
51.4
53.0
Grand Traverse
1,877
48.4
48.0
Kalkaska
151
48.4
49.0
Leelanau
429
53.0
57.0
Manistee
279
51.3
53.0
Missaukee
153
48.3
50.0
Wexford
364
48.6
48.0
Northeast LP
2,504
0.0
0.0
Alcona
109
53.8
55.0
Alpena
459
47.5
47.0
Cheboygan
293
51.8
53.0
Crawford
164
50.5
51.0
Iosco
265
51.2
53.0
Montmorency
90
49.8
51.0
Ogemaw
309
48.6
48.0
Oscoda
65
52.2
52.0
Otsego
328
48.3
49.0
Presque Isle
169
48.6
50.0
Roscommon
253
54.8
54.0
West/West Central
20,214
0.0
0.0
Allegan
1,345
46.9
46.0
Barry
852
48.4
48.0
Ionia
577
45.1
43.0
Kent
8,975
45.3
43.0
Lake
70
51.2
52.5
Mason
471
49.6
50.0
Mecosta
370
48.7
50.5
Montcalm
698
46.2
44.0
Muskegon
1,861
48.3
48.0
Newaygo
455
48.2
50.0
Oceana
222
50.4
53.0
Osceola
219
52.1
47.0
Ottawa
4,099
46.0
44.0
East Central
7,826
0.0
0.0
Arenac
213
48.2
48.0
Bay
1,860
47.8
48.0
Clare
315
46.9
45.0
Gladwin
344
49.0
49.0
Gratiot
475
45.9
45.0
Isabella
606
46.0
45.0
Midland
1,321
46.3
45.0
Saginaw
2,692
47.1
46.0
East
11,883
0.0
0.0
Genesee
5,874
48.4
48.0
Huron
360
49.5
51.0
Lapeer
1,316
48.3
48.0
Saint Clair
2,343
47.9
48.0
Sanilac
439
48.1
48.0
Shiawassee
910
47.3
47.0
Tuscola
641
48.1
48.0
South Central
5,468
0.0
0.0
Clinton
1,285
45.9
45.0
Eaton
1,385
47.8
48.0
Ingham
2,798
47.8
47.0
Southwest
9,737
0.0
0.0
Berrien
1,787
49.5
51.0
Branch
435
48.2
48.0
Calhoun
1,632
48.7
48.0
Cass
396
49.0
50.5
Kalamazoo
3,911
47.7
47.0
Saint Joseph
595
46.7
46.0
Van Buren
981
51.4
52.0
Southeast
16,499
0.0
0.0
Hillsdale
498
48.4
49.0
Jackson
2,235
48.8
49.0
Lenawee
1,231
48.3
48.0
Livingston
3,961
48.2
49.0
Monroe
2,321
46.1
46.0
Washtenaw
6,253
48.4
48.0
Detroit Metro
51,467
0.0
0.0
Macomb
12,567
46.9
47.0
Oakland
19,251
48.6
49.0
Wayne
19,649
47.8
47.0
Outside Michigan
20,517
0.0
0.0
*To see other regions, please press the “Next” button at the bottom of the table.
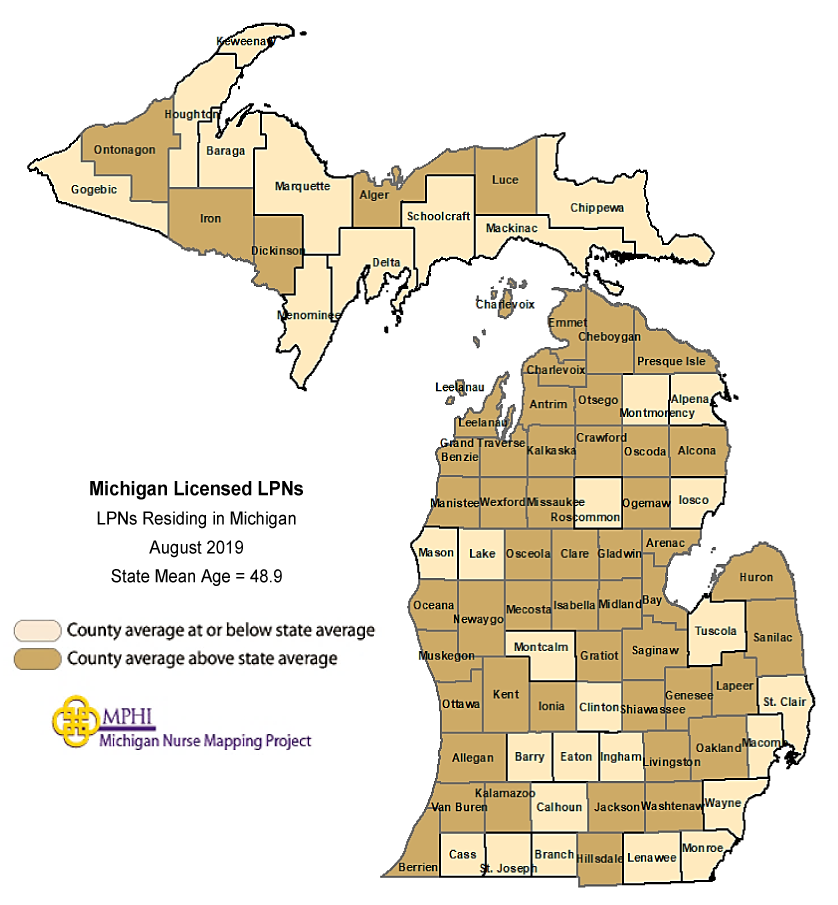
*Population data are from 2016 census estimates obtained from www.michigan.gov/census.Michigan Licensed LPNs Mean Age by County
Total
LPN
Average Age
Median Age
Michigan
22,434
49.0
49.0
Eastern/ Central/ Western UP
1,491
0.0
0.0
Alger
40
52.7
54.5
Baraga
39
48.6
54.0
Chippewa
129
48.1
48.0
Delta
155
44.4
42.0
Dickinson
144
49.4
53.0
Gogebic
77
45.2
42.0
Houghton
117
41.0
38.0
Iron
41
49.9
48.0
Keweenaw
*
*
*
Luce
24
50.1
50.5
Mackinac
39
48.6
51.0
Marquette
532
47.1
47.0
Menominee
89
46.9
50.0
Ontonagon
19
50.1
48.0
Schoolcraft
42
46.0
47.5
Northwest LP
582
0.0
0.0
Antrim
56
51.6
53.0
Benzie
44
58.4
62.5
Charlevoix
34
54.0
57.0
Emmet
35
58.4
62.0
Grand Traverse
199
55.2
55.0
Kalkaska
33
52.2
53.0
Leelanau
40
57.8
62.5
Manistee
46
54.7
57.0
Missaukee
35
57.7
58.0
Wexford
60
54.3
58.5
Northeast LP
681
0.0
0.0
Alcona
35
53.7
57.0
Alpena
162
45.9
46.5
Cheboygan
33
55.9
60.0
Crawford
56
51.5
52.0
Iosco
89
49.2
50.0
Montmorency
22
48.1
46.5
Ogemaw
75
49.1
50.0
Oscoda
20
48.9
53.0
Otsego
65
48.9
47.0
Presque Isle
39
48.2
48.0
Roscommon
85
48.4
47.0
West/West Central
3,399
0.0
0.0
Allegan
208
50.6
51.0
Barry
155
47.3
46.0
Ionia
135
53.5
46.0
Kent
1,362
50.2
51.0
Lake
12
46.8
42.0
Mason
77
45.8
44.0
Mecosta
48
52.2
52.5
Montcalm
193
48.9
49.0
Muskegon
407
51.2
51.0
Newaygo
96
51.2
51.5
Oceana
48
48.2
49.5
Osceola
43
57.2
59.0
Ottawa
615
52.0
54.0
East Central
1,450
0.0
0.0
Arenac
60
50.5
52.5
Bay
333
51.0
52.0
Clare
85
51.0
51.0
Gladwin
72
53.3
53.5
Gratiot
115
52.4
54.0
Isabella
140
53.2
53.5
Midland
170
51.7
53.0
Saginaw
475
50.0
50.0
East
2,012
0.0
0.0
Genesee
664
52.4
54.0
Huron
185
51.6
53.0
Lapeer
171
52.5
53.0
Saint Clair
551
47.5
47.0
Sanilac
148
49.8
48.0
Shiawassee
87
52.4
55.0
Tuscola
206
48.7
49.0
South Central
652
0.0
0.0
Clinton
102
48.5
48.0
Eaton
185
47.8
47.0
Ingham
365
46.0
44.0
Southwest
1,519
0.0
0.0
Berrien
254
53.0
54.0
Branch
117
44.6
43.0
Calhoun
347
46.9
46.0
Cass
68
47.8
47.5
Kalamazoo
446
49.3
48.0
Saint Joseph
185
45.9
45.0
Van Buren
102
51.9
55.0
Southeast
2,111
0.0
0.0
Hillsdale
128
48.5
49.0
Jackson
424
49.8
50.0
Lenawee
299
45.4
45.0
Livingston
244
51.8
55.0
Monroe
680
43.4
42.0
Washtenaw
336
50.0
50.0
Detroit Metro
7,270
0.0
0.0
Macomb
1,539
47.0
46.0
Oakland
1,678
51.6
50.0
Wayne
4,053
46.6
45.0
Outside Michigan
1,267
0.0
0.0
*To see other regions, please press the “Next” button at the bottom of the table.
*Cells with less than 6 nurses were censored
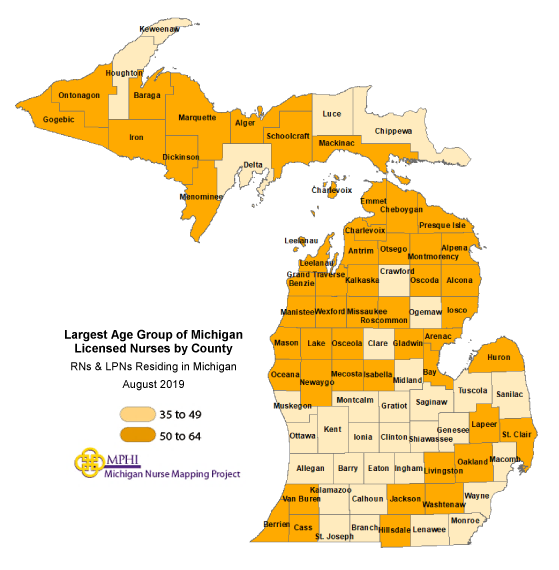
Michigan Nurses Above or Below Mean Age
Total Nurses
Average Age
Median Age
Michigan
177,633
48.0
48.0
Eastern/ Central/ Western UP
5,621
0.0
0.0
Alger
134
51.0
54.0
Baraga
136
50.2
54.0
Chippewa
505
47.5
48.0
Delta
688
45.5
45.0
Dickinson
536
47.4
48.0
Gogebic
262
46.3
47.0
Houghton
697
45.1
44.0
Iron
186
51.5
55.0
Keweenaw
46
46.6
46.5
Luce
80
50.1
50.5
Mackinac
144
49.1
50.5
Marquette
1,697
47.2
47.0
Menominee
277
46.4
47.0
Ontonagon
90
48.1
48.5
Schoolcraft
143
47.9
49.0
Northwest LP
5,536
0.0
0.0
Antrim
311
53.0
55.0
Benzie
356
50.8
52.0
Charlevoix
447
51.0
53.0
Emmet
756
51.7
54.0
Grand Traverse
2,076
49.1
49.0
Kalkaska
184
49.1
50.0
Leelanau
469
53.4
57.0
Manistee
325
51.8
54.0
Missaukee
188
50.1
53.5
Wexford
424
49.4
49.5
Northeast LP
3,185
0.0
0.0
Alcona
144
53.8
55.0
Alpena
621
47.1
47.0
Cheboygan
326
52.2
53.0
Crawford
220
50.8
51.5
Iosco
354
50.7
53.0
Montmorency
112
49.5
51.0
Ogemaw
384
48.7
48.0
Oscoda
85
51.4
52.0
Otsego
393
48.4
49.0
Presque Isle
208
48.5
49.5
Roscommon
338
53.2
52.0
West/West Central
23,613
0.0
0.0
Allegan
1,553
47.4
47.0
Barry
1,007
48.3
47.0
Ionia
712
46.7
44.0
Kent
10,337
45.9
44.0
Lake
82
50.5
51.5
Mason
548
49.1
50.0
Mecosta
418
49.1
51.0
Montcalm
891
46.8
45.0
Muskegon
2,268
48.8
49.0
Newaygo
551
48.7
50.0
Oceana
270
50.0
52.0
Osceola
262
52.9
51.0
Ottawa
4,714
46.8
45.0
East Central
9,276
0.0
0.0
Arenac
273
48.7
48.0
Bay
2,193
48.3
49.0
Clare
400
47.8
47.0
Gladwin
416
49.7
50.0
Gratiot
590
47.2
47.0
Isabella
746
47.3
47.0
Midland
1,491
46.9
46.0
Saginaw
3,167
47.6
47.0
East
13,895
0.0
0.0
Genesee
6,538
48.8
48.0
Huron
545
50.2
52.0
Lapeer
1,487
48.8
49.0
Saint Clair
2,894
47.8
48.0
Sanilac
587
48.5
48.0
Shiawassee
997
47.8
48.0
Tuscola
847
48.2
49.0
South Central
6,120
0.0
0.0
Clinton
1,387
46.1
45.0
Eaton
1,570
47.8
48.0
Ingham
3,163
47.6
47.0
Southwest
11,256
0.0
0.0
Berrien
2,041
49.9
51.0
Branch
552
47.4
47.0
Calhoun
1,979
48.4
48.0
Cass
464
48.8
50.0
Kalamazoo
4,357
47.9
47.0
Saint Joseph
780
46.5
46.0
Van Buren
1,083
51.4
52.0
Southeast
18,610
0.0
0.0
Hillsdale
626
48.4
49.0
Jackson
2,659
48.9
49.0
Lenawee
1,530
47.7
48.0
Livingston
4,205
48.4
49.0
Monroe
3,001
45.5
45.0
Washtenaw
6,589
48.4
49.0
Detroit Metro
58,737
0.0
0.0
Macomb
14,106
47.0
46.0
Oakland
20,929
48.9
49.0
Wayne
23,702
47.6
47.0
Outside Michigan
21,784
0.0
0.0
*To see other regions, please press the “Next” button at the bottom of the table.
*Population data are from 2016 census estimates obtained from www.michigan.gov/census.Largest Age Group of Michigan Licensed Nurses by County