Michigan Nurse Licensure Data websites will be taken off minurse.org in Fall 2026. The Number & Rate of Michigan Nurses and Changes in Michigan Licensed Nurse Populations information will be moved to https://minurse.org/survey-data/. If you have any questions or concerns, please contact us at info@minurse.org.
This website focuses on data obtained from the Michigan Bureau of Professional Licensing and includes all nurses who are currently licensed to practice in Michigan. This website provides information that illustrates the distribution of nurses in Michigan, both in absolute numbers and relative to the State’s population distribution. Information regarding the age distribution of nurses across the state is also included. The information is presented in easy to use maps, tables and charts.
Michigan Overall
Michigan Licensed Nurses by Type and Residency
Residence
Total
RNs
LPNs
# of Nurses
%
# of Nurses
%
# of Nurses
%
Michigan
159,157
85.5
138,963
84.4
20,194
93.5
Ohio
3,808
2.0
3,463
2.1
345
1.6
Indiana
1,420
0.8
1,317
0.8
103
0.5
Wisconsin
1,182
0.6
1,066
0.6
116
0.5
Minnesota
379
0.2
368
0.2
11
0.1
Other U.S. States
16,907
9.1
16,109
9.8
798
3.7
Canada
3,049
1.6
3,015
1.8
34
0.2
Other Countries
325
0.2
322
0.2
*
*
Total
186,227
100.0
164,623
100.0
21,604
100.0
*Population data are based on 2020 census data.
*Cells with less than 6 nurses were censored.
License Type
Living in Michigan
Living Outside
Michigan
Total
#
%
#
%
Total
159,157
85.5%
27,070
14.5%
186,227
LPNs
20,194
93.5%
1,410
6.5%
21,604
RNs
138,963
84.4%
25,660
15.6%
164,623
NPs
9,856
85.2%
1,718
14.8%
11,574
CNAs
2,568
85.4%
438
14.6%
3,006
CNMs
440
89.1%
54
10.9%
494
CNSs
252
93.3%
18
6.7%
270
Total Michigan Nurses (LPNs and RNs) by Prosperity Region and County
Region
# of Nurses
Population*
Nurses per 10,000
Michigan*
186,227
10,077,331
184.8
Eastern/Central/Western UP
5,550
301,608
184.0
Northwest LP
5,573
310,802
179.3
Northeast LP
3,210
202,552
158.5
West/West Central
24,088
1,626,731
148.1
East Central
9,351
554,873
168.5
East
14,157
848,648
166.8
South Central
6,264
473,203
132.4
Southwest
11,234
783,273
143.4
Southeast
19,053
1,026,468
185.6
Detroit Metro
60,677
3,949,173
153.6
*Includes nurses who live outside of Michigan
*Population data are based on 2020 census data
Region
County
# of Nurses
Population*
Nurses per 10,000
Eastern/ Central/ Western UP
5,550
301,608
184.0
Alger
138
8,842
156.1
Baraga
134
8,158
164.3
Chippewa
502
36,785
136.5
Delta
660
36,903
178.8
Dickinson
534
25,947
205.8
Gogebic
241
14,380
167.6
Houghton
673
37,361
180.1
Iron
192
11,631
165.1
Keweenaw
48
2,046
234.6
Luce
85
5,339
159.2
Mackinac
158
10,834
145.8
Marquette
1,679
66,017
254.3
Menominee
273
23,502
116.2
Ontonagon
87
5,816
149.6
Schoolcraft
146
8,047
181.4
Northwest LP
5,573
287,371
193.9
Antrim
310
23,431
132.3
Benzie
351
17,970
195.3
Charlevoix
477
26,054
183.1
Emmet
734
34,112
215.2
Grand Traverse
2,112
95,238
221.8
Kalkaska
185
17,939
103.1
Leelanau
461
22,301
206.7
Manistee
319
25,032
127.4
Missaukee
192
15,052
127.6
Wexford
432
33,673
128.3
Northeast LP
3,210
192,385
166.9
Alcona
140
10,167
137.7
Alpena
602
28,907
208.3
Cheboygan
342
25,579
133.7
Crawford
218
12,988
167.8
Iosco
350
25,237
138.7
Montmorency
118
9,153
128.9
Ogemaw
399
20,770
192.1
Oscoda
101
8,219
122.9
Otsego
405
25,091
161.4
Presque Isle
208
12,982
160.2
Roscommon
327
23,459
139.4
West/West Central
24,088
1,506,229
159.9
Allegan
1,600
120,502
132.8
Barry
1,029
62,423
164.8
Ionia
764
66,804
114.4
Kent
10,542
657,974
160.2
Lake
80
12,096
66.1
Mason
525
29,052
180.7
Mecosta
438
39,714
110.3
Montcalm
897
66,614
134.7
Muskegon
2,289
175,824
130.2
Newaygo
578
49,978
115.7
Oceana
278
26,659
104.3
Osceola
268
22,891
117.1
Ottawa
4,800
296,200
162.1
East Central
9,351
539,871
173.2
Arenac
254
15,002
169.3
Bay
2,198
103,856
211.6
Clare
404
30,856
130.9
Gladwin
430
25,386
169.4
Gratiot
583
41,761
139.6
Isabella
737
64,394
114.5
Midland
1,517
83,494
181.7
Saginaw
3,228
190,124
169.8
East
14,157
442,437
320.0
Genesee
6,676
406,211
164.3
Huron
543
31,407
172.9
Lapeer
1,550
88,619
174.9
Saint Clair
2,936
160,383
183.1
Sanilac
582
40,611
143.3
Shiawassee
1,014
68,094
148.9
Tuscola
856
53,323
160.5
South Central
6,264
394,075
159.0
Clinton
1,467
79,128
185.4
Eaton
1,582
109,175
144.9
Ingham
3,215
284,900
112.8
Southwest
11,234
628,957
178.6
Berrien
2,073
154,316
134.3
Branch
533
44,862
118.8
Calhoun
1,942
134,310
144.6
Cass
476
51,589
92.3
Kalamazoo
4,353
261,670
166.4
Saint Joseph
764
60,939
125.4
Van Buren
1,093
75,587
144.6
Southeast
19,053
980,722
194.3
Hillsdale
626
45,746
136.8
Jackson
2,678
160,366
167.0
Lenawee
1,581
99,423
159.0
Livingston
4,374
193,866
225.6
Monroe
3,109
154,809
200.8
Washtenaw
6,685
372,258
179.6
Detroit Metro
60,677
3,067,956
197.8
Macomb
14,605
881,217
165.7
Oakland
21,533
1,274,395
169.0
Wayne
24,539
1,793,561
136.8
Michigan*
186,227
10,077,331
184.8
*Includes nurses who live outside of Michigan
*Population data are based on 2023 census data
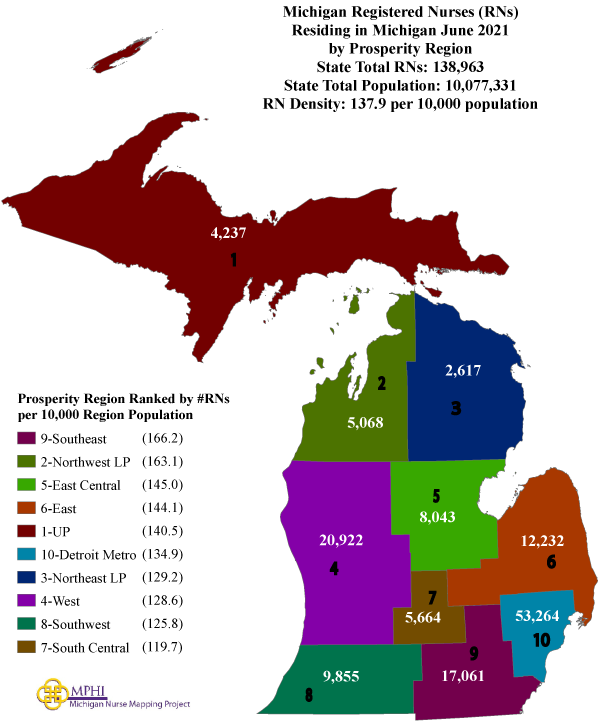
State Distribution
Michigan Licensed Registered Nurses (RNs)
Region
# of RNs
Population*
RNs per 10,000
Michigan
164,623
10,077,331
163.4
Eastern/Central/Western UP
4,237
301,608
140.5
Northwest LP
5,068
310,802
163.1
Northeast LP
2,617
202,552
129.2
West/West Central
20,922
1,626,731
128.6
East Central
8,043
554,873
145.0
East
12,232
848,648
144.1
South Central
5,664
473,203
119.7
Southwest
9,855
783,273
125.8
Southeast
17,061
1,026,468
166.2
Detroit Metro
53,264
3,949,173
134.9
*Population data are based on 2020 census data.
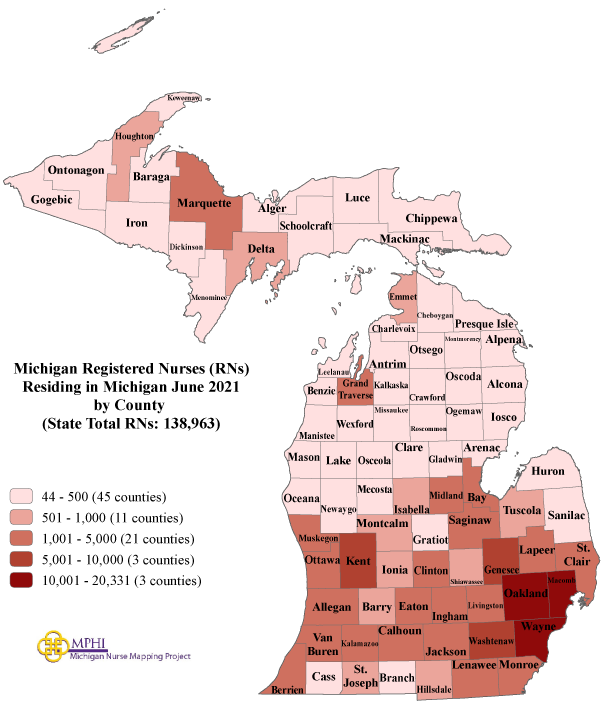
Region
County
# of RNs
Population*
RNs per 10,000
Eastern/ Central/ Western UP
4,237
301,608
140.5
Alger
97
8,842
109.7
Baraga
102
8,158
125.0
Chippewa
390
36,785
106.0
Delta
534
36,903
144.7
Dickinson
407
25,947
156.9
Gogebic
175
14,380
121.7
Houghton
578
37,361
154.7
Iron
153
11,631
131.5
Keweenaw
44
2,046
215.1
Luce
63
5,339
118.0
Mackinac
125
10,834
115.4
Marquette
1,202
66,017
182.1
Menominee
191
23,502
81.3
Ontonagon
72
5,816
123.8
Schoolcraft
104
8,047
129.2
Northwest LP
5,068
287,371
176.4
Antrim
262
23,431
111.8
Benzie
313
17,970
174.2
Charlevoix
448
26,054
172.0
Emmet
702
34,112
205.8
Grand Traverse
1,940
95,238
203.7
Kalkaska
152
17,939
84.7
Leelanau
427
22,301
191.5
Manistee
282
25,032
112.7
Missaukee
161
15,052
107.0
Wexford
381
33,673
113.1
Northeast LP
2,617
192,385
136.0
Alcona
114
10,167
112.1
Alpena
470
28,907
162.6
Cheboygan
313
25,579
122.4
Crawford
168
12,988
129.4
Iosco
269
25,237
106.6
Montmorency
99
9,153
108.2
Ogemaw
330
20,770
158.9
Oscoda
80
8,219
97.3
Otsego
343
25,091
136.7
Presque Isle
179
12,982
137.9
Roscommon
252
23,459
107.4
West/West Central
20,922
1,506,229
138.9
Allegan
1,403
120,502
116.4
Barry
881
62,423
141.1
Ionia
637
66,804
95.4
Kent
9,238
657,974
140.4
Lake
69
12,096
57.0
Mason
470
29,052
161.8
Mecosta
388
39,714
97.7
Montcalm
734
66,614
110.2
Muskegon
1,922
175,824
109.3
Newaygo
488
49,978
97.6
Oceana
232
26,659
87.0
Osceola
228
22,891
99.6
Ottawa
4,232
296,200
142.9
East Central
8,043
539,871
149.0
Arenac
202
15,002
134.6
Bay
1,905
103,856
183.4
Clare
326
30,856
105.7
Gladwin
368
25,386
145.0
Gratiot
479
41,761
114.7
Isabella
625
64,394
97.1
Midland
1,367
83,494
163.7
Saginaw
2,771
190,124
145.7
East
12,232
442,437
276.5
Genesee
6,019
406,211
148.2
Huron
379
31,407
120.7
Lapeer
1,396
88,619
157.5
Saint Clair
2,387
160,383
148.8
Sanilac
446
40,611
109.8
Shiawassee
940
68,094
138.0
Tuscola
665
53,323
124.7
South Central
5,664
394,075
143.7
Clinton
1,369
79,128
173.0
Eaton
1,405
109,175
128.7
Ingham
2,890
284,900
101.4
Southwest
9,855
628,957
156.7
Berrien
1,828
154,316
118.5
Branch
434
44,862
96.7
Calhoun
1,628
134,310
121.2
Cass
410
51,589
79.5
Kalamazoo
3,954
261,670
151.1
Saint Joseph
599
60,939
98.3
Van Buren
1,002
75,587
132.6
Southeast
17,061
980,722
174.0
Hillsdale
503
45,746
110.0
Jackson
2,287
160,366
142.6
Lenawee
1,303
99,423
131.1
Livingston
4,158
193,866
214.5
Monroe
2,453
154,809
158.5
Washtenaw
6,357
372,258
170.8
Detroit Metro
53,264
3,067,956
173.6
Macomb
13,023
881,217
147.8
Oakland
19,910
1,274,395
156.2
Wayne
20,331
1,793,561
113.4
Michigan
164,623
10,077,331
163.4
*To see other regions, please press the “Next” button at the bottom of the table.
*Population data are based on 2020 census data.Michigan Licensed Practical Nurses (LPNs)
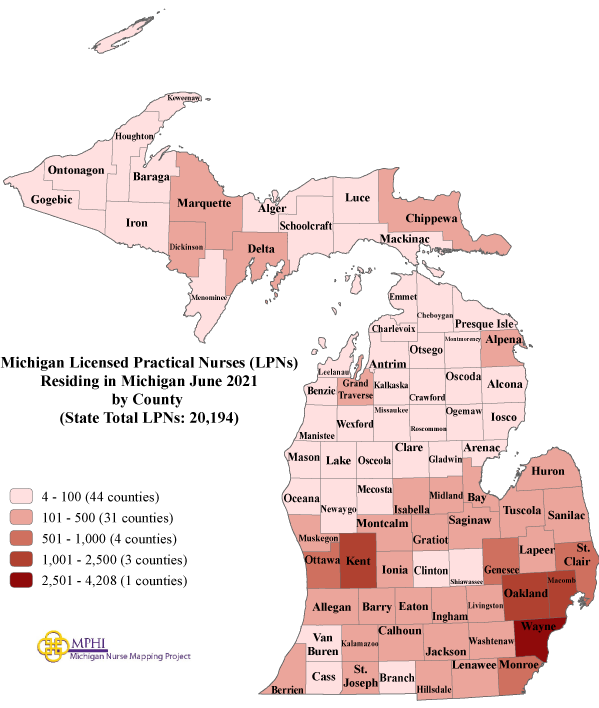
Region
# of LPNs
Population*
LPNs per 10,000
Michigan
21,604
10,077,331
21.4
Eastern/Central/Western UP
1,313
301,608
43.5
Northwest LP
505
310,802
16.2
Northeast LP
593
202,552
29.3
West/West Central
3,166
1,626,731
19.5
East Central
1,308
554,873
23.6
East
1,925
848,648
22.7
South Central
600
473,203
12.7
Southwest
1,379
783,273
17.6
Southeast
1,992
1,026,468
19.4
Detroit Metro
7,413
3,949,173
18.8
*Population data are based on 2020 census data.
Region
County
# of LPNs
Population*
LPNs per 10,000
Eastern/ Central/ Western UP
1,313
301,608
43.5
Alger
41
8,842
46.4
Baraga
32
8,158
39.2
Chippewa
112
36,785
30.4
Delta
126
36,903
34.1
Dickinson
127
25,947
48.9
Gogebic
66
14,380
45.9
Houghton
95
37,361
25.4
Iron
39
11,631
33.5
Keweenaw
*
2,046
*
Luce
22
5,339
41.2
Mackinac
33
10,834
30.5
Marquette
477
66,017
72.3
Menominee
82
23,502
34.9
Ontonagon
15
5,816
25.8
Schoolcraft
42
8,047
52.2
Northwest LP
505
287,371
17.6
Antrim
48
23,431
20.5
Benzie
38
17,970
21.1
Charlevoix
29
26,054
11.1
Emmet
32
34,112
9.4
Grand Traverse
172
95,238
18.1
Kalkaska
33
17,939
18.4
Leelanau
34
22,301
15.2
Manistee
37
25,032
14.8
Missaukee
31
15,052
20.6
Wexford
51
33,673
15.1
Northeast LP
593
192,385
30.8
Alcona
26
10,167
25.6
Alpena
132
28,907
45.7
Cheboygan
29
25,579
11.3
Crawford
50
12,988
38.5
Iosco
81
25,237
32.1
Montmorency
19
9,153
20.8
Ogemaw
69
20,770
33.2
Oscoda
21
8,219
25.6
Otsego
62
25,091
24.7
Presque Isle
29
12,982
22.3
Roscommon
75
23,459
32.0
West/West Central
3,166
1,506,229
21.0
Allegan
197
120,502
16.3
Barry
148
62,423
23.7
Ionia
127
66,804
19.0
Kent
1,304
657,974
19.8
Lake
11
12,096
9.1
Mason
55
29,052
18.9
Mecosta
50
39,714
12.6
Montcalm
163
66,614
24.5
Muskegon
367
175,824
20.9
Newaygo
90
49,978
18.0
Oceana
46
26,659
17.3
Osceola
40
22,891
17.5
Ottawa
568
296,200
19.2
East Central
1,308
539,871
24.2
Arenac
52
15,002
34.7
Bay
293
103,856
28.2
Clare
78
30,856
25.3
Gladwin
62
25,386
24.4
Gratiot
104
41,761
24.9
Isabella
112
64,394
17.4
Midland
150
83,494
18.0
Saginaw
457
190,124
24.0
East
1,925
442,437
43.5
Genesee
657
406,211
16.2
Huron
164
31,407
52.2
Lapeer
154
88,619
17.4
Saint Clair
549
160,383
34.2
Sanilac
136
40,611
33.5
Shiawassee
74
68,094
10.9
Tuscola
191
53,323
35.8
South Central
600
394,075
15.2
Clinton
98
79,128
12.4
Eaton
177
109,175
16.2
Ingham
325
284,900
11.4
Southwest
1,379
628,957
21.9
Berrien
245
154,316
15.9
Branch
99
44,862
22.1
Calhoun
314
134,310
23.4
Cass
66
51,589
12.8
Kalamazoo
399
261,670
15.2
Saint Joseph
165
60,939
27.1
Van Buren
91
75,587
12.0
Southeast
1,992
980,722
20.3
Hillsdale
123
45,746
26.9
Jackson
391
160,366
24.4
Lenawee
278
99,423
28.0
Livingston
216
193,866
11.1
Monroe
656
154,809
42.4
Washtenaw
328
372,258
8.8
Detroit Metro
7,413
3,067,956
24.2
Macomb
1,582
881,217
18.0
Oakland
1,623
1,274,395
12.7
Wayne
4,208
1,793,561
23.5
Michigan
21,604
10,077,331
21.4
*To see other regions, please press the “Next” button at the bottom of the table.
*Cells with less than 6 nurses were censored
*Population data are based on 2020 census data.
*Cells with less than 6 nurses were censored.Michigan Licensed Nurse Practitioners (NPs)
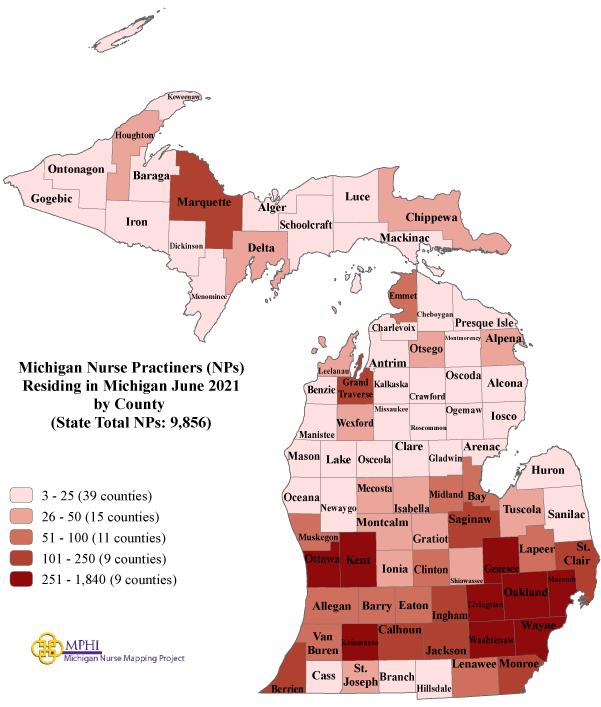
Region
# of NPs
Population*
NPs per 10,000
Michigan
11,574
10,077,331
11.5
Eastern/Central/Western UP
305
301,608
10.1
Northwest LP
375
310,802
12.1
Northeast LP
170
202,552
8.4
West/West Central
1,485
1,626,731
9.1
East Central
491
554,873
8.8
East
589
848,648
6.9
South Central
376
473,203
7.9
Southwest
649
783,273
8.3
Southeast
1,332
1,026,468
13.0
Detroit Metro
4,084
3,949,173
10.3
*Population data are based on 2020 census data.
Region
County
# of NPs
Population*
NPs per 10,000
Eastern/ Central/ Western UP
305
301,608
10.1
Alger
*
8,842
*
Baraga
*
8,158
*
Chippewa
39
36,785
10.6
Delta
27
36,903
7.3
Dickinson
24
25,947
9.2
Gogebic
9
14,380
6.3
Houghton
27
37,361
7.2
Iron
11
11,631
9.5
Keweenaw
*
2,046
*
Luce
*
5,339
*
Mackinac
11
10,834
10.2
Marquette
111
66,017
16.8
Menominee
11
23,502
4.7
Ontonagon
8
5,816
13.8
Schoolcraft
10
8,047
12.4
Northwest LP
375
287,371
13.0
Antrim
18
23,431
7.7
Benzie
18
17,970
10.0
Charlevoix
25
26,054
9.6
Emmet
55
34,112
16.1
Grand Traverse
158
95,238
16.6
Kalkaska
9
17,939
5.0
Leelanau
44
22,301
19.7
Manistee
17
25,032
6.8
Missaukee
*
15,052
*
Wexford
26
33,673
7.7
Northeast LP
170
192,385
8.8
Alcona
7
10,167
6.9
Alpena
36
28,907
12.5
Cheboygan
16
25,579
6.3
Crawford
8
12,988
6.2
Iosco
17
25,237
6.7
Montmorency
*
9,153
*
Ogemaw
23
20,770
11.1
Oscoda
*
8,219
*
Otsego
29
25,091
11.6
Presque Isle
10
12,982
7.7
Roscommon
16
23,459
6.8
West/West Central
1,485
1,506,229
9.9
Allegan
72
120,502
6.0
Barry
51
62,423
8.2
Ionia
38
66,804
5.7
Kent
824
657,974
12.5
Lake
*
12,096
*
Mason
22
29,052
7.6
Mecosta
26
39,714
6.5
Montcalm
49
66,614
7.4
Muskegon
94
175,824
5.3
Newaygo
21
49,978
4.2
Oceana
15
26,659
5.6
Osceola
9
22,891
3.9
Ottawa
261
296,200
8.8
East Central
491
539,871
9.1
Arenac
11
15,002
7.3
Bay
92
103,856
8.9
Clare
10
30,856
3.2
Gladwin
12
25,386
4.7
Gratiot
31
41,761
7.4
Isabella
31
64,394
4.8
Midland
98
83,494
11.7
Saginaw
206
190,124
10.8
East
589
442,437
13.3
Genesee
284
406,211
7.0
Huron
20
31,407
6.4
Lapeer
71
88,619
8.0
Saint Clair
121
160,383
7.5
Sanilac
23
40,611
5.7
Shiawassee
37
68,094
5.4
Tuscola
33
53,323
6.2
South Central
376
394,075
9.5
Clinton
81
79,128
10.2
Eaton
92
109,175
8.4
Ingham
203
284,900
7.1
Southwest
649
628,957
10.3
Berrien
116
154,316
7.5
Branch
21
44,862
4.7
Calhoun
105
134,310
7.8
Cass
25
51,589
4.8
Kalamazoo
280
261,670
10.7
Saint Joseph
46
60,939
7.5
Van Buren
56
75,587
7.4
Southeast
1,332
980,722
13.6
Hillsdale
21
45,746
4.6
Jackson
152
160,366
9.5
Lenawee
69
99,423
6.9
Livingston
275
193,866
14.2
Monroe
160
154,809
10.3
Washtenaw
655
372,258
17.6
Detroit Metro
4,084
3,067,956
13.3
Macomb
893
881,217
10.1
Oakland
1,840
1,274,395
14.4
Wayne
1,351
1,793,561
7.5
Michigan
11,574
10,077,331
11.5
*To see other regions, please press the “Next” button at the bottom of the table.
*Cells with less than 6 nurses were censored
*Population data are based on 2020 census data.
*Cells with less than 6 nurses were censored.Michigan Certified Nurse Midwives (CNMs)
Region
# of CNMs
Population*
CNMs per 10,000
Michigan
494
10,077,331
0.5
Eastern/Central/Western UP
8
301,608
0.3
Northwest LP
21
310,802
0.7
Northeast LP
*
202,552
*
West/West Central
61
1,626,731
0.4
East Central
20
554,873
0.4
East
13
848,648
0.2
South Central
15
473,203
0.3
Southwest
57
783,273
0.7
Southeast
83
1,026,468
0.8
Detroit Metro
157
3,949,173
0.4
*Population data are based on 2020 census data.
*Cells with less than 6 nurses were censoredMichigan Certified Registered Nurse Anesthetists (CRNAs)
Region
# of CRNAs
Population*
CRNAs per 10,000
Michigan
3,006
10,077,331
3.0
Eastern/Central/Western UP
59
301,608
2.0
Northwest LP
69
310,802
2.2
Northeast LP
28
202,552
1.4
West/West Central
204
1,626,731
1.3
East Central
92
554,873
1.7
East
176
848,648
2.1
South Central
85
473,203
1.8
Southwest
131
783,273
1.7
Southeast
325
1,026,468
3.2
Detroit Metro
1,399
3,949,173
3.5
*Population data are based on 2020 census data.
Age Distribution
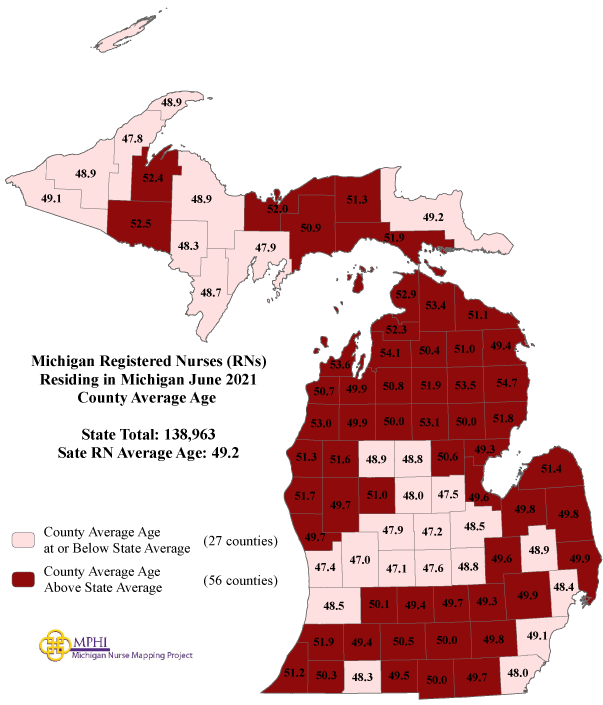
County Michigan Licensed RNs Mean Age by County
Total RN
Average Age
Median Age
Michigan
164,623
49.4
50.0
Eastern/ Central/ Western UP
4,237
49.0
50.0
Alger
97
52.0
53.0
Baraga
102
52.4
53.0
Chippewa
390
49.2
50.0
Delta
534
47.9
49.0
Dickinson
407
48.3
50.0
Gogebic
175
49.1
50.0
Houghton
578
47.8
49.0
Iron
153
52.5
51.0
Keweenaw
44
48.9
49.5
Luce
63
51.3
50.0
Mackinac
125
51.9
51.0
Marquette
1,202
48.9
50.0
Menominee
191
48.7
50.0
Ontonagon
72
48.9
50.0
Schoolcraft
104
50.9
50.5
Northwest LP
5,068
51.3
51.0
Antrim
262
54.1
56.0
Benzie
313
50.7
50.0
Charlevoix
448
52.3
53.0
Emmet
702
52.9
54.0
Grand Traverse
1,940
49.9
50.0
Kalkaska
152
50.8
51.5
Leelanau
427
53.6
56.0
Manistee
282
53.0
53.0
Missaukee
161
50.0
50.0
Wexford
381
49.9
50.0
Northeast LP
2,617
51.4
51.0
Alcona
114
54.7
56.0
Alpena
470
49.4
50.0
Cheboygan
313
53.4
54.0
Crawford
168
51.9
51.0
Iosco
269
51.8
52.0
Montmorency
99
51.0
50.0
Ogemaw
330
50.0
50.0
Oscoda
80
53.5
52.0
Otsego
343
50.4
50.0
Presque Isle
179
51.1
50.0
Roscommon
252
53.1
55.0
West/West Central
20,922
47.9
48.0
Allegan
1,403
48.5
49.0
Barry
881
50.1
50.0
Ionia
637
47.1
47.0
Kent
9,238
47.0
47.0
Lake
69
51.6
53.0
Mason
470
51.3
52.0
Mecosta
388
51.0
50.0
Montcalm
734
47.9
49.0
Muskegon
1,922
49.7
50.0
Newaygo
488
49.7
50.0
Oceana
232
51.7
51.0
Osceola
228
48.9
49.0
Ottawa
4,232
47.4
47.0
East Central
8,043
48.6
50.0
Arenac
202
49.3
50.0
Bay
1,905
49.6
50.0
Clare
326
48.8
50.0
Gladwin
368
50.6
50.0
Gratiot
479
47.2
47.0
Isabella
625
48.0
49.0
Midland
1,367
47.5
48.0
Saginaw
2,771
48.5
49.0
East
12,232
49.6
50.0
Genesee
6,019
49.6
50.0
Huron
379
51.4
51.0
Lapeer
1,396
48.9
50.0
Saint Clair
2,387
49.9
50.0
Sanilac
446
49.8
50.0
Shiawassee
940
48.8
50.0
Tuscola
665
49.8
50.0
South Central
5,664
49.1
50.0
Clinton
1,369
47.6
48.0
Eaton
1,405
49.4
50.0
Ingham
2,890
49.7
50.0
Southwest
9,855
50.2
50.0
Berrien
1,828
51.2
50.0
Branch
434
49.5
50.0
Calhoun
1,628
50.5
50.0
Cass
410
50.3
50.0
Kalamazoo
3,954
49.4
50.0
Saint Joseph
599
48.3
49.0
Van Buren
1,002
51.9
51.0
Southeast
17,061
49.5
50.0
Hillsdale
503
50.0
50.0
Jackson
2,287
50.0
50.0
Lenawee
1,303
49.7
50.0
Livingston
4,158
49.3
50.0
Monroe
2,453
48.0
50.0
Washtenaw
6,357
49.8
50.0
Detroit Metro
53,264
49.2
50.0
Macomb
13,023
48.4
50.0
Oakland
19,910
49.9
50.0
Wayne
20,331
49.1
50.0
Outside Michigan
25,660
50.3
50.0
*To see other regions, please press the “Next” button at the bottom of the table.
Michigan Licensed LPNs Mean Age by County
Total LPN
Average Age
Median Age
Michigan
21,604
48.9
49.0
Eastern/ Central/ Western UP
1,313
48.2
49.0
Alger
41
52.8
56.0
Baraga
32
53.5
60.5
Chippewa
112
49.4
50.0
Delta
126
46.2
43.5
Dickinson
127
49.9
53.0
Gogebic
66
45.6
43.0
Houghton
95
44.0
42.0
Iron
39
48.0
46.0
Keweenaw
*
*
*
Luce
22
48.6
48.0
Mackinac
33
51.4
54.0
Marquette
477
48.2
49.0
Menominee
82
48.8
52.5
Ontonagon
15
53.6
52.0
Schoolcraft
42
46.3
47.5
Northwest LP
505
54.3
58.0
Antrim
48
52.5
55.0
Benzie
38
58.1
62.0
Charlevoix
29
51.8
53.0
Emmet
32
57.4
62.0
Grand Traverse
172
53.0
57.5
Kalkaska
33
49.5
50.0
Leelanau
34
58.1
63.0
Manistee
37
55.8
58.0
Missaukee
31
56.2
58.0
Wexford
51
55.5
60.0
Northeast LP
593
51.0
52.0
Alcona
26
57.5
59.5
Alpena
132
48.4
50.0
Cheboygan
29
57.7
62.0
Crawford
50
53.7
55.5
Iosco
81
51.4
54.0
Montmorency
19
50.2
47.0
Ogemaw
69
50.7
50.0
Oscoda
21
49.5
46.0
Otsego
62
49.3
47.5
Presque Isle
29
53.1
56.0
Roscommon
75
50.2
48.0
West/West Central
3,166
51.3
51.0
Allegan
197
51.4
51.0
Barry
148
47.9
47.0
Ionia
127
47.9
47.5
Kent
1,304
50.9
51.0
Lake
11
45.7
43.0
Mason
55
50.1
50.0
Mecosta
50
53.3
52.0
Montcalm
163
51.6
52.0
Muskegon
367
52.3
52.0
Newaygo
90
50.8
52.0
Oceana
46
50.5
52.5
Osceola
40
59.2
61.0
Ottawa
568
52.5
54.0
East Central
1,308
51.8
52.5
Arenac
52
50.8
51.0
Bay
293
52.0
53.0
Clare
78
52.3
52.0
Gladwin
62
55.1
55.0
Gratiot
104
52.4
53.0
Isabella
112
55.8
57.0
Midland
150
53.2
54.0
Saginaw
457
49.8
49.0
East
1,925
50.2
51.0
Genesee
657
51.1
52.0
Huron
164
53.2
55.0
Lapeer
154
52.7
53.0
Saint Clair
549
47.6
48.0
Sanilac
136
50.2
49.5
Shiawassee
74
50.8
52.0
Tuscola
191
49.7
50.0
South Central
600
47.6
46.0
Clinton
98
46.7
45.0
Eaton
177
48.1
45.0
Ingham
325
47.6
47.0
Southwest
1,379
49.9
50.0
Berrien
245
54.2
55.0
Branch
99
47.2
48.0
Calhoun
314
47.4
47.0
Cass
66
48.3
46.5
Kalamazoo
399
50.4
50.0
Saint Joseph
165
48.9
49.0
Van Buren
91
51.6
53.0
Southeast
1,992
48.0
48.0
Hillsdale
123
48.9
49.0
Jackson
391
51.5
52.0
Lenawee
278
45.3
45.5
Livingston
216
53.0
57.0
Monroe
656
44.5
43.0
Washtenaw
328
49.4
49.0
Detroit Metro
7,413
46.8
45.0
Macomb
1,582
46.6
45.0
Oakland
1,623
49.5
49.0
Wayne
4,208
45.9
44.0
Outside Michigan
1,410
49.1
49.0
*To see other regions, please press the “Next” button at the bottom of the table.
*Cells with less than 6 nurses were censored.
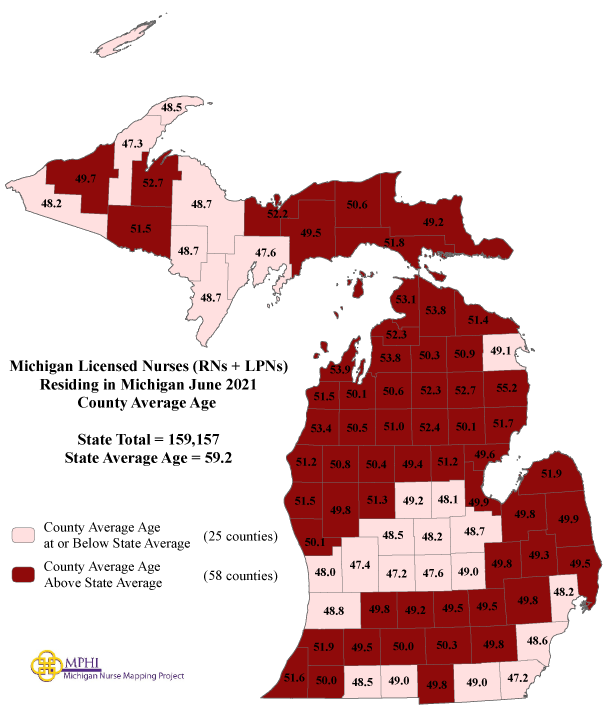
Michigan Nurses Above or Below Mean Age
Total Nurses
Average Age
Median Age
Michigan
186,227
49.4
50.0
Eastern/ Central/ Western UP
5,550
48.8
50.0
Alger
138
52.2
54.0
Baraga
134
52.7
54.0
Chippewa
502
49.2
50.0
Delta
660
47.6
48.0
Dickinson
534
48.7
50.0
Gogebic
241
48.2
50.0
Houghton
673
47.3
48.0
Iron
192
51.5
50.0
Keweenaw
48
48.5
49.5
Luce
85
50.6
50.0
Mackinac
158
51.8
52.5
Marquette
1,679
48.7
50.0
Menominee
273
48.7
50.0
Ontonagon
87
49.7
50.0
Schoolcraft
146
49.5
50.0
Northwest LP
5,573
51.6
51.0
Antrim
310
53.8
55.5
Benzie
351
51.5
52.0
Charlevoix
477
52.3
53.0
Emmet
734
53.1
54.0
Grand Traverse
2,112
50.1
50.0
Kalkaska
185
50.6
51.0
Leelanau
461
53.9
56.5
Manistee
319
53.4
54.0
Missaukee
192
51.0
52.5
Wexford
432
50.5
50.0
Northeast LP
3,210
51.3
51.0
Alcona
140
55.2
56.0
Alpena
602
49.1
50.0
Cheboygan
342
53.8
55.0
Crawford
218
52.3
52.0
Iosco
350
51.7
52.0
Montmorency
118
50.9
50.0
Ogemaw
399
50.1
50.0
Oscoda
101
52.7
51.0
Otsego
405
50.3
50.0
Presque Isle
208
51.4
51.0
Roscommon
327
52.4
52.5
West/West Central
24,088
48.3
49.0
Allegan
1,600
48.8
49.0
Barry
1,029
49.8
50.0
Ionia
764
47.2
47.0
Kent
10,542
47.4
48.0
Lake
80
50.8
51.0
Mason
525
51.2
51.0
Mecosta
438
51.3
50.0
Montcalm
897
48.5
50.0
Muskegon
2,289
50.1
50.0
Newaygo
578
49.8
50.0
Oceana
278
51.5
51.0
Osceola
268
50.4
50.0
Ottawa
4,800
48.0
48.0
East Central
9,351
49.1
50.0
Arenac
254
49.6
50.0
Bay
2,198
49.9
50.0
Clare
404
49.4
50.0
Gladwin
430
51.2
50.0
Gratiot
583
48.2
49.0
Isabella
737
49.2
50.0
Midland
1,517
48.1
48.0
Saginaw
3,228
48.7
49.0
East
14,157
49.7
50.0
Genesee
6,676
49.8
50.0
Huron
543
51.9
52.0
Lapeer
1,550
49.3
50.0
Saint Clair
2,936
49.5
50.0
Sanilac
582
49.9
50.0
Shiawassee
1,014
49.0
50.0
Tuscola
856
49.8
50.0
South Central
6,264
49.0
50.0
Clinton
1,467
47.6
48.0
Eaton
1,582
49.2
50.0
Ingham
3,215
49.5
50.0
Southwest
11,234
50.1
50.0
Berrien
2,073
51.6
51.0
Branch
533
49.0
50.0
Calhoun
1,942
50.0
50.0
Cass
476
50.0
50.0
Kalamazoo
4,353
49.5
50.0
Saint Joseph
764
48.5
49.0
Van Buren
1,093
51.9
51.5
Southeast
19,053
49.3
50.0
Hillsdale
626
49.8
50.0
Jackson
2,678
50.3
50.0
Lenawee
1,581
49.0
50.0
Livingston
4,374
49.5
50.0
Monroe
3,109
47.2
48.0
Washtenaw
6,685
49.8
50.0
Detroit Metro
60,677
49.0
50.0
Macomb
14,605
48.2
50.0
Oakland
21,533
49.8
50.0
Wayne
24,539
48.6
50.0
Outside Michigan
27,070
50.3
50.0
*To see other regions, please press the “Next” button at the bottom of the table.
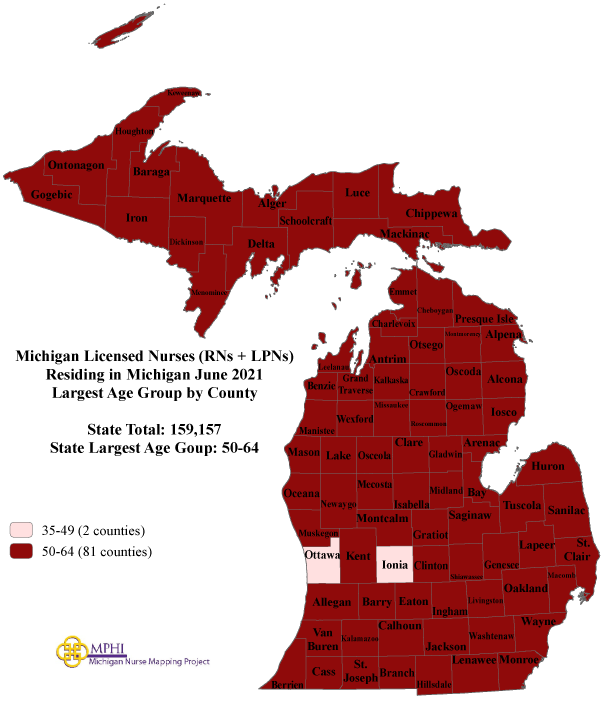
Largest Age Group of Michigan Licensed Nurses by County