2024 Annual Survey of Nurses
Survey Data Tables
Analysis of the survey responses are presented in tables and charts below:
Survey Respondents & Response Rates
Demographic Characteristics of Survey Respondents
| Demographics | RN = 24,518 | LPN = 2,494 | ||
|---|---|---|---|---|
| n | Estimate | n | Estimate | |
| Age | ||||
| <25 years | 138 | 0.6% | * | * |
| 25 to 34 years | 1,760 | 7.2% | 143 | 5.7% |
| 35 to 44 years | 3,340 | 13.6% | 346 | 13.9% |
| 45 to 54 years | 4,136 | 16.9% | 434 | 17.4% |
| 55 to 64 years | 5,798 | 23.6% | 566 | 22.7% |
| 65 to 74 years | 5,526 | 22.5% | 517 | 20.7% |
| 75+ years | 913 | 3.7% | 73 | 2.9% |
| Unknown | 2,907 | 11.9% | 407 | 16.3% |
| Gender | ||||
| Female | 20,112 | 82.0% | 2,026 | 81.2% |
| Male | 1,844 | 7.5% | 108 | 4.3% |
| Gender non-binary/ Genderqueer/Transgender | 37 | 0.2% | * | * |
| Prefer not to respond | 384 | 1.6% | 38 | 1.5% |
| Unknown | 2,141 | 8.7% | 314 | 12.6% |
| Race | ||||
| White | 20,068 | 81.9% | 1,638 | 65.7% |
| Black | 1,265 | 5.2% | 453 | 18.2% |
| American Indian | 325 | 1.3% | 46 | 1.8% |
| Asian/ Pacific Islander | 578 | 2.4% | 39 | 1.6% |
| Other | 542 | 2.2% | 86 | 3.4% |
| Unknown | 2,332 | 9.5% | 329 | 13.2% |
| Hispanic or Latinx | ||||
| Yes | 453 | 1.8% | 68 | 2.7% |
| No | 21,606 | 88.1% | 2,083 | 83.5% |
| Unknown | 2,459 | 10.0% | 343 | 13.8% |
| Middle Eastern | ||||
| Yes | 286 | 1.2% | 15 | 0.6% |
| No | 21,841 | 89.1% | 2,137 | 85.7% |
| Unknown | 2,391 | 9.8% | 342 | 13.7% |
| Region | ||||
| Upper Peninsula | 717 | 2.9% | 155 | 6.2% |
| Northwest LP | 914 | 3.7% | 92 | 3.7% |
| Northeast LP | 450 | 1.8% | 64 | 2.6% |
| West/West Central | 3,154 | 12.9% | 335 | 13.4% |
| East Central | 1,162 | 4.7% | 144 | 5.8% |
| East | 1,749 | 7.1% | 193 | 7.7% |
| South Central | 889 | 3.6% | 65 | 2.6% |
| Southwest | 1,443 | 5.9% | 158 | 6.3% |
| Southeast | 2,247 | 9.2% | 196 | 7.9% |
| Detroit Metro | 6,446 | 26.3% | 621 | 24.9% |
| MI, Unknown Region | 892 | 3.6% | 93 | 3.7% |
| Outside MI | 2,742 | 11.2% | 111 | 4.5% |
| Unknown | 1,713 | 7.0% | 267 | 10.7% |
a The gender options have been combined for the purpose of increasing the likelihood of having enough responses to be included in the analysis. Should the number be high enough, we will revisit separating out options in future surveys.
b Respondents were instructed to select all races that apply to them.
* Data are suppressed if count is less than 10 or sample population was less than 20.
Demographics of APNs who Completed National APN Certification & LARA-Certified APRNs and Nurse Anesthetists
| Demographics | Completed National APN Certification N = 2,747 | LARA-Certified APRNs N = 2,362 |
||
|---|---|---|---|---|
| Estimate | 95% CI | Estimate | 95% CI | |
| Total | 11.9% | (11.5%, 12.3%) | 90.2% | (89.0%, 91.3%) |
| Age | ||||
| <25 years | 0.0% | (0.0%, 0.0%) | 0.0% | (0.0%, 0.0%) |
| 25 to 34 years | 8.7% | (7.5%, 10.1%) | 92.3% | (86.6%, 95.7%) |
| 35 to 44 years | 16.1% | (14.9%, 17.4%) | 96.7% | (94.7%, 98.0%) |
| 45 to 54 years | 13.5% | (12.5%, 14.6%) | 91.2% | (88.4%, 93.4%) |
| 55 to 64 years | 10.4% | (9.6%, 11.2%) | 86.4% | (83.5%, 88.9%) |
| 65+ years | 11.0% | (10.3%, 11.8%) | 73.1% | (69.7%, 76.2%) |
| Gender | ||||
| Female | 11.8% | (11.4%, 12.3%) | 89.8% | (88.5%, 91.0%) |
| Male | 14.4% | (12.9%, 16.1%) | 93.2% | (89.5%, 95.6%) |
| Gender non-binary, Genderqueer, Transgender | * | * | * | * |
| Prefer not to respond | 8.8% | (6.4%, 12.1%) | 95.1% | (84.0%, 98.6%) |
| Race | ||||
| White | 11.8% | (11.3%, 12.3%) | 90.1% | (88.7%, 91.4%) |
| Black | 12.2% | (10.5%, 14.1%) | 93.5% | (87.8%, 96.6%) |
| American Indian | 6.0% | (3.9%, 9.1%) | 91.8% | (73.3%, 97.9%) |
| Asian/ Pacific Islander | 12.9% | (10.4%, 15.9%) | 86.5% | (74.9%, 93.2%) |
| Other Race | 10.1% | (7.8%, 12.9%) | 90.0% | (79.2%, 95.5%) |
| Hispanic or Latinx | ||||
| Yes | 10.6% | (8.1%, 13.8%) | 96.1% | (85.9%, 99.0%) |
| Middle Eastern | ||||
| Yes | 14.4% | (10.8%, 18.9%) | 87.4% | (73.1%, 94.7%) |
| Region of Residence | ||||
| Upper Peninsula | 12.9% | (10.6%, 15.6%) | 93.3% | (86.0%, 96.9%) |
| Northwest LP | 11.8% | (9.9%, 14.1%) | 90.1% | (83.1%, 94.4%) |
| Northeast LP | 13.9% | (11.0%, 17.4%) | 91.5% | (80.7%, 96.5%) |
| West/West Central | 8.6% | (7.7%, 9.6%) | 88.5% | (84.2%, 91.8%) |
| East Central | 10.2% | (8.6%, 12.1%) | 92.5% | (86.2%, 96.0%) |
| East | 10.7% | (9.3%, 12.2%) | 91.9% | (86.8%, 95.1%) |
| South Central | 12.7% | (10.7%, 15.1%) | 89.9% | (82.9%, 94.3%) |
| Southwest | 9.9% | (8.5%, 11.5%) | 93.3% | (88.1%, 96.3%) |
| Southeast | 14.3% | (12.9%, 15.8%) | 92.2% | (88.6%, 94.7%) |
| Detroit Metro | 13.8% | (13.0%, 14.7%) | 93.1% | (91.1%, 94.7%) |
| Unknown MI Region | 9.8% | (8.0%, 11.9%) | 100.0% | (95.7%, 100.0%) |
| Outside MI | 11.9% | (10.7%, 13.2%) | 76.4% | (71.6%, 80.6%) |
| Region of Employment | ||||
| Upper Peninsula | 13.7% | (11.0%, 16.9%) | 94.3% | (86.1%, 97.8%) |
| Northwest LP | 13.0% | (10.6%, 15.9%) | 91.3% | (83.1%, 95.7%) |
| Northeast LP | 15.1% | (11.4%, 19.8%) | 92.4% | (78.3%, 97.6%) |
| West/West Central | 9.0% | (7.9%, 10.3%) | 93.7% | (89.5%, 96.3%) |
| East Central | 11.7% | (9.7%, 14.0%) | 95.8% | (90.0%, 98.3%) |
| East | 13.8% | (11.8%, 16.0%) | 95.8% | (90.9%, 98.1%) |
| South Central | 14.3% | (11.8%, 17.2%) | 91.8% | (84.3%, 95.9%) |
| Southwest | 10.9% | (9.2%, 12.9%) | 98.0% | (93.6%, 99.4%) |
| Southeast | 15.8% | (14.2%, 17.5%) | 96.4% | (93.6%, 98.0%) |
| Detroit Metro | 14.5% | (13.5%, 15.6%) | 94.3% | (92.2%, 95.9%) |
| Unknown MI Region | 11.5% | (9.3%, 14.1%) | 87.6% | (77.7%, 93.5%) |
| Outside MI | 12.6% | (11.3%, 14.1%) | 80.1% | (75.1%, 84.3%) |
a The gender options have been combined for the purpose of increasing the likelihood of having enough responses to be included in the analysis. Should the number be high enough, we will revisit separating out options in future surveys.
b Respondents were instructed to select all races that apply to them.
* Data are suppressed if count is less than 10 or sample population was less than 20.
Comparison of Survey Respondents to All Nurses Licensed in Michigan
| Characteristics | RNs | LPNs | ||||||
|---|---|---|---|---|---|---|---|---|
| Nurse Population | Survey Participants | Nurse Population | Survey Participants | |||||
| # | % | # | % | # | % | # | % | |
| Total | 175,187 | – | 24,518 | – | 21,011 | – | 2,494 | – |
| Age | ||||||||
| <25 years | 3,897 | 2.2% | 138 | 0.6% | 392 | 1.9% | * | * |
| 25 to 34 years | 36,758 | 21.0% | 1,760 | 7.2% | 3,575 | 17.0% | 143 | 5.7% |
| 35 to 44 years | 42,640 | 24.3% | 3,340 | 13.6% | 5,309 | 25.3% | 346 | 13.9% |
| 45 to 54 years | 36,618 | 20.9% | 4,136 | 16.9% | 4,855 | 23.1% | 434 | 17.4% |
| 55 to 64 years | 32,591 | 18.6% | 5,798 | 23.6% | 4,045 | 19.3% | 566 | 22.7% |
| 65 to 74 years | 19,651 | 11.2% | 5,526 | 22.5% | 2,445 | 11.6% | 517 | 20.7% |
| 75+ years | 3,001 | 1.7% | 913 | 3.7% | 382 | 1.8% | 73 | 2.9% |
| Unknown | 31 | 0.0% | 2,907 | 11.9% | * | * | 407 | 16.3% |
| Region of Residence | ||||||||
| Eastern/Central/ Western UP | 4,817 | 2.7% | 717 | 2.9% | 1,280 | 6.1% | 155 | 6.2% |
| Northwest LP | 26,089 | 14.9% | 914 | 3.7% | 4,961 | 23.6% | 92 | 3.7% |
| Northeast LP | 6,615 | 3.8% | 450 | 1.8% | 892 | 4.2% | 64 | 2.6% |
| West/West Central | 37,370 | 21.3% | 3,154 | 12.9% | 3,928 | 18.7% | 335 | 13.4% |
| East Central | 5,641 | 3.2% | 1,162 | 4.7% | 792 | 3.8% | 144 | 5.8% |
| East | 12,347 | 7.0% | 1,749 | 7.1% | 1,647 | 7.8% | 193 | 7.7% |
| South Central | 5,631 | 3.2% | 889 | 3.6% | 589 | 2.8% | 65 | 2.6% |
| Southwest | 11,401 | 6.5% | 1,443 | 5.9% | 1,774 | 8.4% | 158 | 6.3% |
| Southeast | 11,890 | 6.8% | 2,247 | 9.2% | 1,679 | 8.0% | 196 | 7.9% |
| Detroit Metro | 19,859 | 11.3% | 6,446 | 26.3% | 1,957 | 9.3% | 621 | 24.9% |
| MI, Unknown Region | 3,640 | 2.1% | 892 | 3.6% | 43 | 0.2% | 93 | 3.7% |
| Non-Michigan | 29,050 | 16.6% | 2,742 | 11.2% | 1,330 | 6.3% | 111 | 4.5% |
| Unknown Region | 837 | 0.5% | 1,713 | 7.0% | 139 | 0.7% | 267 | 10.7% |
| LARA-certified APRN (Advanced Practitioner Registered Nurse) | ||||||||
| Nurse Practitioner | 14,972 | 8.5% | 1,736 | 7.1% | – | – | – | – |
| Anesthetist | 3,147 | 1.8% | 362 | 1.5% | – | – | – | – |
| Midwife | 565 | 0.3% | 108 | 0.4% | – | – | – | – |
| Clinical Specialist | 325 | 0.2% | 156 | 0.6% | – | – | – | – |
* Data are suppressed if count is less than 10 or sample population was less than 20.
– Data are not available/data are not applicable.
Education
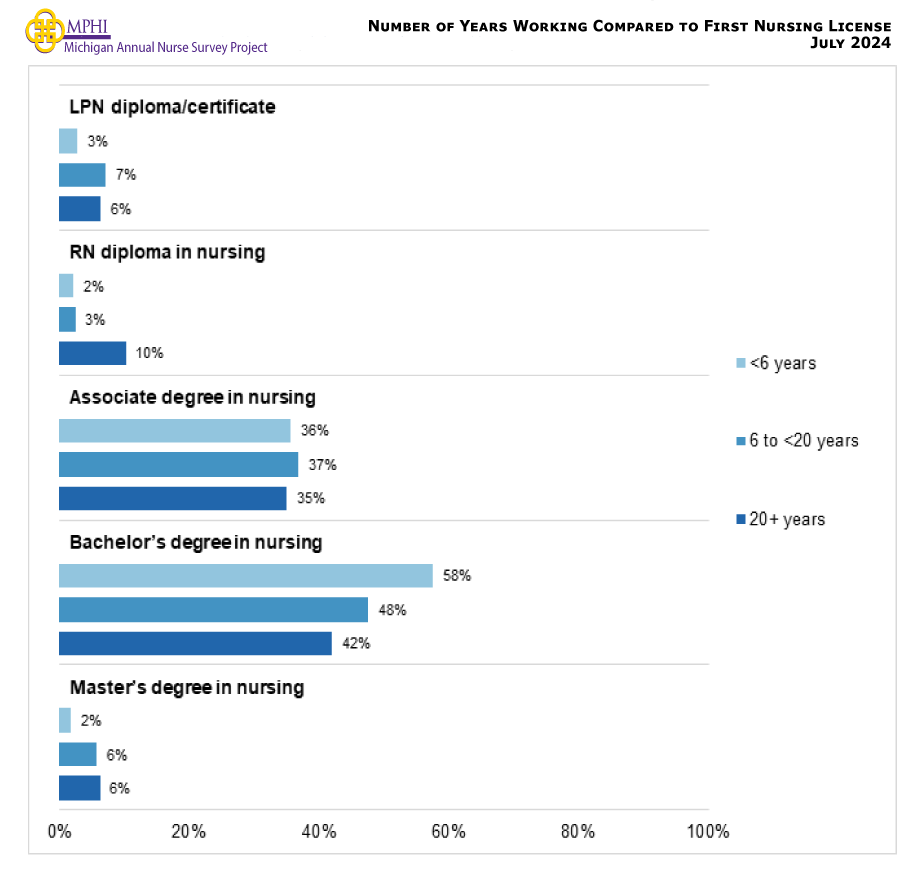
Educational Background that Qualified for First Nursing License among RNs
| Education Level | RN = 24,518 | ||
|---|---|---|---|
| N | Estimate | 95% CI | |
| LPN diploma/certificate | 1,512 | 5.9% | (5.6%, 6.2%) |
| RN diploma in nursing | 2,564 | 6.7% | (6.4%, 7.0%) |
| Associate degree in nursing | 9,287 | 36.0% | (35.4%, 36.6%) |
| Bachelor’s degree in nursing | 9,963 | 46.7% | (46.1%, 47.3%) |
| Master’s degree in nursing | 1,192 | 4.7% | (4.4%, 5.0%) |
Highest Level of Nursing-Related Education
| Educational Level | RN = 24,518 | LPN = 2,494 | ||||
|---|---|---|---|---|---|---|
| N | Estimate | 95% CI | N | Estimate | 95% CI | |
| LPN diploma/certificate | * | * | * | 2,320 | 92.6% | (91.5%, 93.6%) |
| RN diploma in nursing | 1,589 | 4.0% | (3.8%, 4.3%) | 21 | 0.8% | (0.5%, 1.2%) |
| Associate degree in nursing | 7,147 | 26.6% | (26.1%, 27.2%) | 128 | 5.5% | (4.7%, 6.5%) |
| Bachelor’s degree in nursing | 11,214 | 51.0% | (50.4%, 51.6%) | 20 | 0.8% | (0.5%, 1.2%) |
| Master’s degree in nursing | 3,808 | 15.3% | (14.9%, 15.8%) | * | * | * |
| Doctorate in Nursing Practice (DNP) | 500 | 2.3% | (2.1%, 2.5%) | 0 | 0.0% | (0.0%, 0.2%) |
| Doctor of Nurse Anesthesia (DNAP) | 32 | 0.1% | (0.1%, 0.1%) | 0 | 0.0% | (0.0%, 0.2%) |
| Doctor of Philosophy in Nursing (PhD) | 203 | 0.6% | (0.5%, 0.7%) | 0 | 0.0% | (0.0%, 0.2%) |
| Other doctoral degree in nursing | 20 | 0.0% | (0.0%, 0.0%) | * | * | * |
* Data are suppressed if count is less than 10 or sample population was less than 20.
Highest Level of Non-Nursing Education
| Education Level | RN =24,518 | LPN = 1,592 | ||||
|---|---|---|---|---|---|---|
| N | Estimate | 95% CI | N | Estimate | 95% CI | |
| Non-nursing associate degree | 3,433 | 14.1% | (13.7%, 14.5%) | 679 | 26.4% | (24.7%, 28.2%) |
| Non-nursing bachelor’s degree | 3,731 | 16.1% | (15.6%, 16.6%) | 168 | 6.5% | (5.6%, 7.5%) |
| Non-nursing master’s degree | 1,742 | 5.3% | (5.0%, 5.6%) | 47 | 1.8% | (1.3%, 2.4%) |
| Non-nursing doctoral degree | 235 | 0.6% | (0.5%, 0.7%) | * | * | * |
| Not applicable | 15,377 | 63.9% | (63.3%, 64.5%) | 1,592 | 65.0% | (63.1%, 66.8%) |
* Data are suppressed if count is less than 10 or sample population was less than 20.
Nurses’ First Nursing Degree Compared to their Highest Nursing Degree
| First Nursing Degree to Highest Nursing Degree | n | Estimate | 95% CI |
|---|---|---|---|
| LPN Diploma/Certificate as First Nursing Degree | |||
| LPN diploma/certificate | 2,494 | 67.1% | (65.6%, 68.5%) |
| RN diploma/associate degree | 745 | 15.0% | (13.9%, 16.1%) |
| Bachelor’s degree in nursing | 490 | 11.9% | (10.9%, 12.9%) |
| Master’s or Doctorate in nursing | 273 | 6.1% | (5.4%, 6.9%) |
| RN Diploma/Associate degree as First Nursing Degree | |||
| RN diploma/associate degree | 7,965 | 65.0% | (63.5%, 66.5%) |
| Bachelor’s degree in nursing | 2,567 | 24.4% | (23.1%, 25.8%) |
| Master’s degree in nursing | 1,082 | 8.7% | (7.9%, 9.6%) |
| Doctorate in nursing | 236 | 1.9% | (1.5%, 2.4%) |
| Bachelor’s degree in nursing as First Nursing Degree | |||
| Bachelor’s degree in nursing | 8,152 | 82.6% | (81.4%, 83.7%) |
| Master’s degree in nursing | 1,399 | 13.6% | (12.6%, 14.7%) |
| Doctorate in nursing | 386 | 3.9% | (3.3%, 4.5%) |
| Master’s Degree as First Nursing Degree | |||
| Master’s degree in nursing | 1,095 | 93.1% | (92.3%, 93.8%) |
| Doctorate in nursing | 92 | 6.9% | (6.2%, 7.7%) |
a Associate degrees were included with RNs because many who start with an associate degree now have an RN degree as their highest level of education. Additionally, LPNs who did not answer the survey question about their highest level of education were categorized in the LPN diploma category. For this reason, sample size numbers may vary across tables.
b Doctorate degrees include PhD, DNP, DNAP, or other nursing doctorate degrees.
Number of Years Compared to the First Nursing License, 2023
Current Enrollment in Nursing Educational Programs
| Degree | RN = 1,313 | LPN = 249 | ||||
|---|---|---|---|---|---|---|
| N | Estimate | 95% CI | N | Estimate | 95% CI | |
| Associate Degree in Nursing (ADN) | 24 | 1.1% | (0.7%, 1.8%) | 212 | 81.4% | (76.1%, 85.7%) |
| Bachelor of Science in Nursing (BSN) | 561 | 41.5% | (38.9%, 44.2%) | 40 | 20.8% | (16.2%, 26.3%) |
| Master of Science in Nursing (MSN) | 526 | 39.6% | (37.0%, 42.3%) | * | * | * |
| Doctor of Nursing Practice (DNP) | 196 | 17.0% | (15.1%, 19.1%) | 0 | 0.0% | (0.0%, 1.5%) |
| Doctor of Nurse Anesthesia (DNAP) | 20 | 2.6% | (1.9%, 3.6%) | 0 | 0.0% | (0.0%, 1.5%) |
| Doctor of Philosophy in Nursing (PhD) | 44 | 3.0% | (2.2%, 4.1%) | 0 | 0.0% | (0.0%, 1.5%) |
a Respondents were instructed to mark all that apply.
* Data are suppressed if count is less than 10 or sample population was less than 20.
Current Enrollment in Educational Programs Associated with APN Nursing Specialty Certification Exams among all RNs
| Certification | RN = 642 | |
|---|---|---|
| Estimate | 95% CI | |
| Nurse Practitioner | 59.5% | (55.7%, 63.2%) |
| Nurse Midwife | 2.4% | (1.5%, 3.9%) |
| Nurse Anesthetist | 7.4% | (5.6%, 9.7%) |
| Clinical Nurse Specialist | 4.8% | (3.4%, 6.7%) |
| Other | 25.9% | (22.7%, 29.4%) |
Current Program Type
| Program Type | RN = 1,297 | LPN = 248 | ||
|---|---|---|---|---|
| Estimate | 95% CI | Estimate | 95% CI | |
| In-person | 8.0% | (6.6%, 9.6%) | 58.3% | (52.1%, 64.3%) |
| Online | 73.2% | (70.7%, 75.5%) | 12.1% | (8.6%, 16.7%) |
| Hybrid | 18.8% | (16.8%, 21.0%) | 29.6% | (24.3%, 35.6%) |
Unanticipated Barriers and Challenges while Pursing Nursing Degree
| Barriers | RN = 821 | LPN = 158 | ||
|---|---|---|---|---|
| Estimate | 95% CI | Estimate | 95% CI | |
| No Unanticipated barriers | 11.1% | (9.1%, 13.4%) | 14.4% | (9.8%, 20.7%) |
| Among those who did experience unanticipated barriers | ||||
| English as a second language | 2.4% | (1.6%, 3.7%) | * | * |
| Racial/ethnic disparities | 5.3% | (4.0%, 7.1%) | * | * |
| Learning difficulties and/or disabilities | 5.8% | (4.4%, 7.6%) | 6.6% | (3.7%, 11.6%) |
| Lack of flexibility in work schedules | 30.9% | (27.8%, 34.1%) | 33.5% | (26.6%, 41.2%) |
| Childcare issues | 8.9% | (7.1%, 11.0%) | 14.9% | (10.2%, 21.3%) |
| Pregnancy (i.e., as covered under Title IX) | 3.4% | (2.4%, 4.9%) | * | * |
| Other family issues | 15.3% | (13.0%, 17.9%) | 15.1% | (10.4%, 21.5%) |
| Cost of lost work time and benefits | 33.6% | (30.5%, 36.9%) | 37.3% | (30.1%, 45.1%) |
| Cost of tuition, materials, books, etc. | 64.2% | (60.9%, 67.4%) | 51.6% | (43.9%, 59.3%) |
| Student loans were not available/could not take enough loans | 9.0% | (7.2%, 11.2%) | 11.2% | (7.2%, 17.1%) |
| Financial aid | 26.6% | (23.7%, 29.7%) | 23.4% | (17.5%, 30.6%) |
| Commuting distance to educational program | 17.6% | (15.1%, 20.4%) | 17.7% | (12.5%, 24.4%) |
| Limited access to online learning or other online resources | 5.7% | (4.3%, 7.5%) | 6.8% | (3.8%, 11.8%) |
| Scheduling or educational programs offered | 9.7% | (7.9%, 11.9%) | 8.3% | (4.9%, 13.7%) |
| Variability for clinical placements and experience | 33.0% | (29.9%, 36.3%) | 20.5% | (14.9%, 27.5%) |
| Other | 1.5% | (0.9%, 2.6%) | * | * |
* Data are suppressed if count is less than 10 or sample population was less than 20.
Social Determinants of Health
Preparedness for Assessing Social Determinants of Health
| Preparedness | RN = 17,127 | LPN = 1,697 | ||
|---|---|---|---|---|
| Estimate | 95% CI | Estimate | 95% CI | |
| Not at all prepared | 1.3% | (1.1%, 1.5%) | 0.9% | (0.5%, 1.5%) |
| Somewhat prepared | 8.4% | (8.0%, 8.8%) | 5.6% | (4.6%, 6.8%) |
| Moderately prepared | 20.8% | (20.2%, 21.4%) | 17.2% | (15.5%, 19.1%) |
| Very prepared | 43.4% | (42.7%, 44.1%) | 45.4% | (43.0%, 47.8%) |
| Extremely prepared | 26.1% | (25.4%, 26.8%) | 30.9% | (28.7%, 33.1%) |
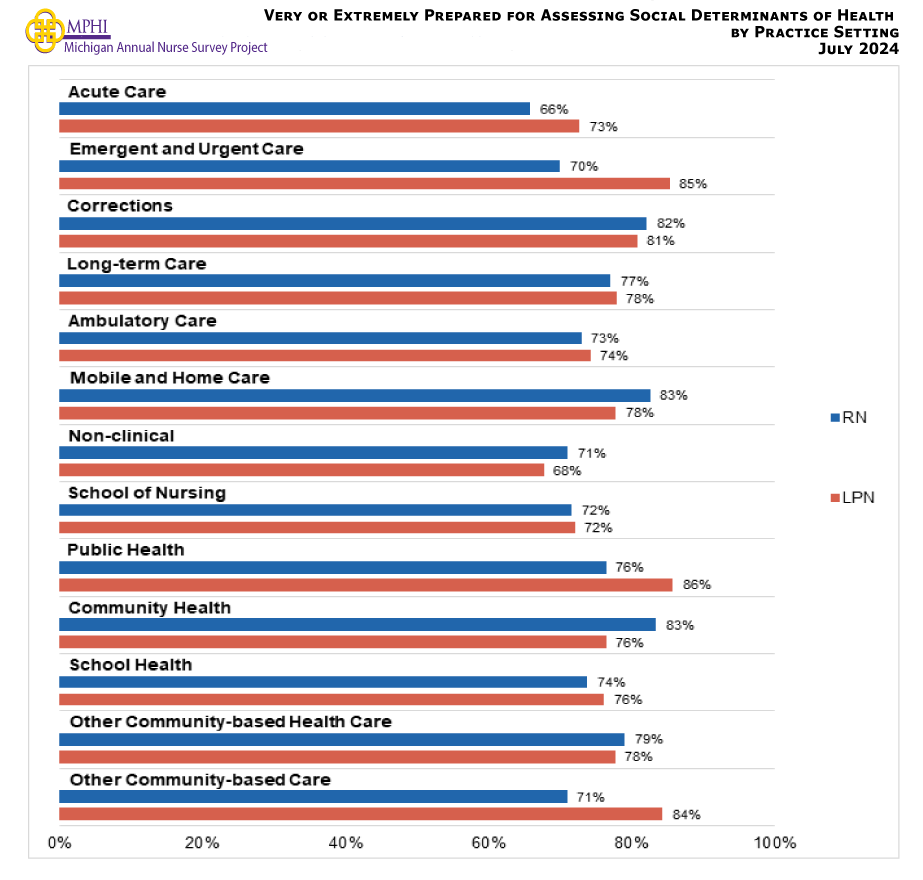
Very or Extremely Prepared for Assessing Social Determinants of Health by Practice Setting
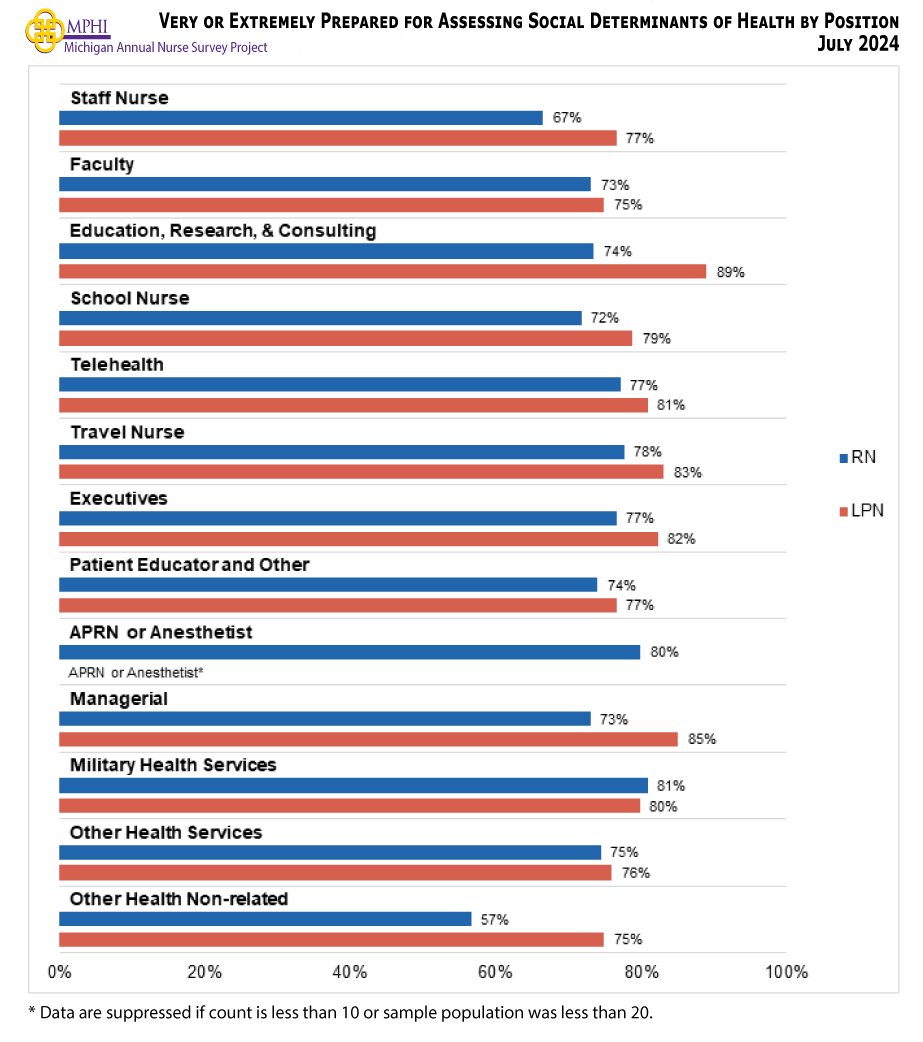
Very or Extremely Prepared for Assessing Social Determinants of Health by Position
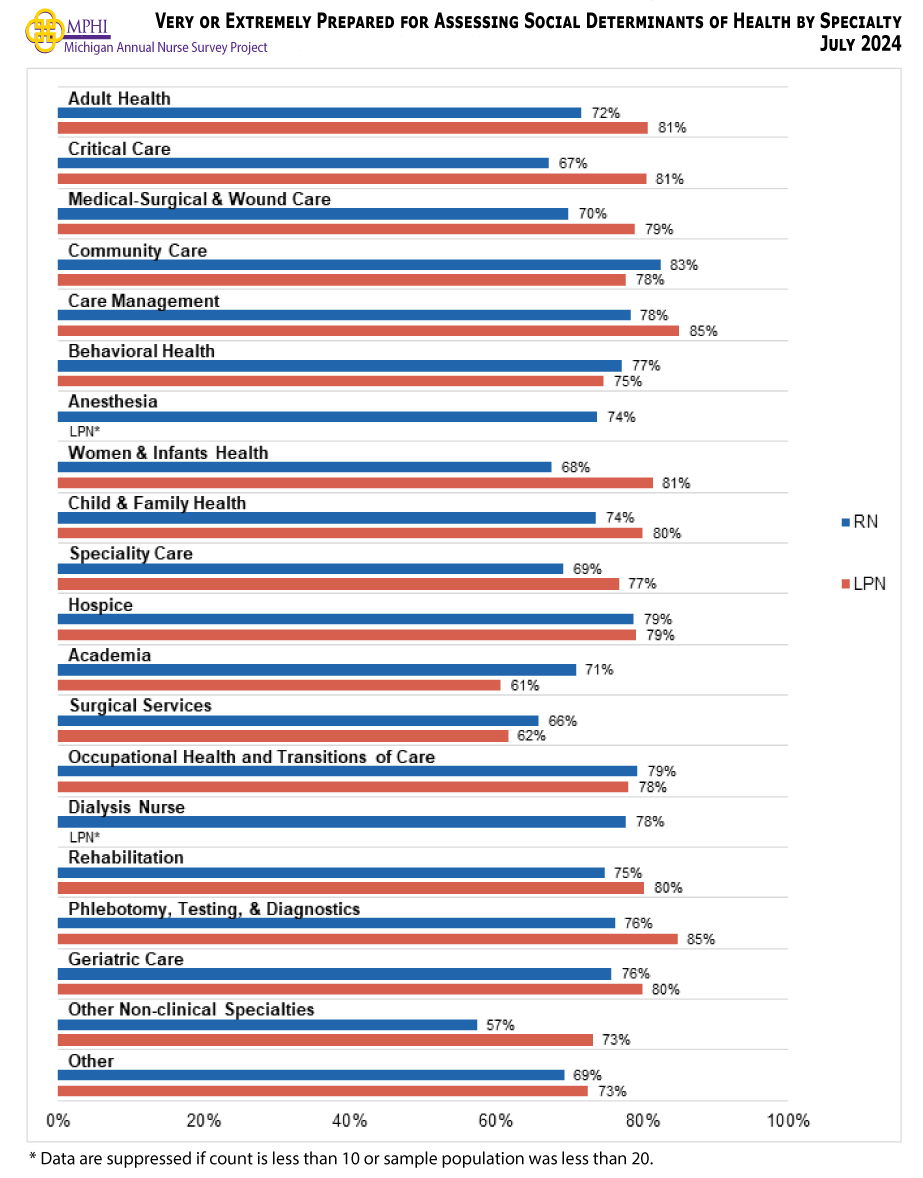
Very or Extremely Prepared for Assessing Social Determinants of Health by Specialty
Employment
Current Employment Status
| Employment | RN = 24,518 | LPN = 2,494 | ||||
|---|---|---|---|---|---|---|
| N | Estimate | 95% CI | N | Estimate | 95% CI | |
| Actively employed in nursing or in a position that requires a nurse license full-time | 13,222 | 64.1% | (63.5%, 64.7%) | 1,363 | 62.2% | (60.3%, 64.1%) |
| Actively employed in nursing or a position that requires a nurse license part-time | 2,605 | 10.5% | (10.1%, 10.9%) | 285 | 9.9% | (8.8%, 11.1%) |
| Actively employed in nursing or in a position that requires a nurse license on a per-diem basis | 1,407 | 5.5% | (5.2%, 5.8%) | 105 | 4.4% | (3.7%, 5.3%) |
| On temporary medical leave from a position that requires a nurse license | 174 | 0.7% | (0.6%, 0.8%) | 25 | 1.1% | (0.8%, 1.6%) |
| On temporary non-medical leave from a position that requires a nurse license | 52 | 0.2% | (0.2%, 0.3%) | * | * | * |
| Actively employed in a field other than nursing | 732 | 3.0% | (2.8%, 3.2%) | 134 | 5.5% | (4.7%, 6.5%) |
| Volunteer nurse status only | 242 | 0.4% | (0.3%, 0.5%) | 17 | 0.2% | (0.1%, 0.5%) |
| Unemployed, seeking work as a nurse | 379 | 1.6% | (1.5%, 1.8%) | 73 | 3.4% | (2.8%, 4.2%) |
| Unemployed, not seeking work as a nurse | 700 | 3.5% | (3.3%, 3.7%) | 78 | 3.2% | (2.6%, 4.0%) |
| Permanent disability leave | 260 | 0.8% | (0.7%, 0.9%) | 38 | 1.3% | (0.9%, 1.8%) |
| Retired (left the workforce) | 4,745 | 9.6% | (9.2%, 10.0%) | 368 | 8.2% | (7.2%, 9.3%) |
* Data are suppressed if count is less than 10 or sample population was less than 20.
Current Employment Status for RNs by Region of Residence
| Employment Status | Upper Peninsula | Northwest LP | Northeast LP | West/West Central | East Central | East | South Central | Southwest | Southeast | Detroit Metro |
|---|---|---|---|---|---|---|---|---|---|---|
| N | N | N | N | N | N | N | N | N | N | |
| Estimate | Estimate | Estimate | Estimate | Estimate | Estimate | Estimate | Estimate | Estimate | Estimate | |
| 95% CI | 95% CI | 95% CI | 95% CI | 95% CI | 95% CI | 95% CI | 95% CI | 95% CI | 95% CI | |
| Actively employed in nursing or in a position that requires a nurse license full-time | 381 | 463 | 231 | 1,552 | 678 | 971 | 473 | 757 | 1,182 | 3,306 |
| 64.7% | 66.0% | 66.6% | 60.4% | 69.9% | 66.9% | 64.7% | 63.6% | 63.7% | 62.1% | |
| (61.1%, 68.1%) | (62.9%, 69.0%) | (62.1%, 70.8%) | (58.7%, 62.1%) | (67.2%, 72.5%) | (64.7%, 69.1%) | (61.5%, 67.8%) | (61.1%, 66.0%) | (61.7%, 65.7%) | (60.9%, 63.3%) | |
| Actively employed in nursing or a position that requires a nurse license part-time | 71 | 82 | 31 | 465 | 88 | 174 | 83 | 169 | 224 | 669 |
| 10.5% | 8.1% | 5.1% | 15.8% | 7.9% | 10.3% | 9.7% | 11.4% | 10.4% | 10.3% | |
| (8.5%, 13.0%) | (6.5%, 10.0%) | (3.4%, 7.5%) | (14.6%, 17.1%) | (6.5%, 9.6%) | (9.0%, 11.8%) | (7.9%, 11.8%) | (9.9%, 13.1%) | (9.2%, 11.7%) | (9.6%, 11.1%) | |
| Actively employed in nursing or in a position that requires a nurse license on a per-diem basis | 30 | 43 | 28 | 158 | 54 | 98 | 64 | 76 | 100 | 411 |
| 3.9% | 4.2% | 4.7% | 4.3% | 4.7% | 5.1% | 6.5% | 5.2% | 4.4% | 6.8% | |
| (2.7%, 5.6%) | (3.1%, 5.7%) | (3.1%, 7.1%) | (3.6%, 5.1%) | (3.6%, 6.1%) | (4.2%, 6.2%) | (5.1%, 8.3%) | (4.2%, 6.5%) | (3.6%, 5.3%) | (6.2%, 7.4%) | |
| On temporary medical leave from a position that requires a nurse license | * | * | * | 17 | 14 | 15 | * | 12 | 23 | 46 |
| * | * | * | 0.6% | 1.2% | 1.0% | * | 0.8% | 0.9% | 0.7% | |
| * | * | * | (0.4%, 0.9%) | (0.7%, 2.0%) | (0.6%, 1.6%) | * | (0.5%, 1.4%) | (0.6%, 1.4%) | (0.5%, 0.9%) | |
| On temporary non- medical leave from a position that requires a nurse license | * | * | 0 | * | * | * | * | * | * | 13 |
| * | * | 0.0% | * | * | * | * | * | * | 0.2% | |
| * | * | (0.0%, 0.0%) | * | * | * | * | * | * | (0.1%, 0.3%) | |
| Actively employed in a field other than nursing | 33 | 23 | 11 | 104 | 23 | 48 | 32 | 46 | 89 | 195 |
| 3.6% | 2.3% | 2.1% | 3.2% | 1.9% | 2.2% | 2.7% | 2.9% | 3.7% | 3.0% | |
| (2.5%, 5.2%) | (1.5%, 3.5%) | (1.1%, 3.9%) | (2.6%, 3.9%) | (1.3%, 2.9%) | (1.6%, 3.0%) | (1.8%, 4.0%) | (2.2%, 3.9%) | (3.0%, 4.6%) | (2.6%, 3.4%) | |
| Volunteer nurse status only | * | * | * | 29 | 10 | 12 | * | 18 | 23 | 44 |
| * | * | * | 0.4% | 0.4% | 0.3% | * | 1.0% | 0.5% | 0.3% | |
| * | * | * | (0.2%, 0.7%) | (0.2%, 1.0%) | (0.1%, 0.7%) | * | (0.6%, 1.7%) | (0.3%, 0.9%) | (0.2%, 0.5%) | |
| Unemployed, seeking work as a nurse | * | 10 | * | 37 | 20 | 21 | 12 | 13 | 29 | 117 |
| * | 1.2% | * | 1.2% | 1.5% | 1.4% | 1.5% | 0.6% | 1.1% | 2.0% | |
| * | (0.7%, 2.1%) | * | (0.9%, 1.6%) | (0.9%, 2.4%) | (0.9%, 2.1%) | (0.9%, 2.5%) | (0.3%, 1.2%) | (0.7%, 1.6%) | (1.7%, 2.4%) | |
| Unemployed, not seeking work as a nurse | 22 | 32 | 15 | 100 | 26 | 34 | 33 | 50 | 55 | 203 |
| 3.3% | 2.9% | 3.5% | 3.8% | 2.1% | 2.0% | 4.3% | 4.1% | 3.2% | 3.8% | |
| (2.2%, 5.2%) | (2.0%, 4.2%) | (2.2%, 5.6%) | (3.2%, 4.5%) | (1.4%, 3.1%) | (1.4%, 2.8%) | (3.2%, 5.8%) | (3.2%, 5.3%) | (2.5%, 4.0%) | (3.4%, 4.3%) | |
| Permanent disability leave | * | 11 | 10 | 34 | 15 | 29 | * | 15 | 29 | 74 |
| * | 1.0% | 2.2% | 0.7% | 0.9% | 1.3% | * | 0.7% | 1.0% | 0.8% | |
| * | (0.5%, 1.9%) | (1.2%, 4.0%) | (0.5%, 1.1%) | (0.5%, 1.6%) | (0.9%, 1.9%) | * | (0.4%, 1.3%) | (0.7%, 1.5%) | (0.6%, 1.0%) | |
| Retired | 153 | 237 | 112 | 652 | 231 | 344 | 178 | 286 | 489 | 1,368 |
| 10.8% | 13.5% | 13.5% | 9.5% | 9.6% | 9.4% | 9.1% | 9.6% | 10.9% | 10.0% | |
| (8.7%, 13.3%) | (11.4%, 15.9%) | (10.6%, 17.0%) | (8.5%, 10.6%) | (8.0%, 11.4%) | (8.1%, 10.9%) | (7.4%, 11.2%) | (8.2%, 11.2%) | (9.7%, 12.3%) | (9.3%, 10.8%) |
* Data are suppressed if count is less than 10 or sample population was less than 20.
Percentage of Nurses Who are Employed in Nursing by Demographic Characteristics
| Demographics | RN | LPN | ||||
|---|---|---|---|---|---|---|
| n | Estimate | 95% CI | n | Estimate | 95% CI | |
| Total | 24,518 | 80.4% | (79.9%, 80.9%) | 2,494 | 76.8% | (75.1%, 78.4%) |
| Age | ||||||
| <25 years | 138 | 91.3% | (85.4%, 95.0%) | * | * | * |
| 25 to 34 years | 1,760 | 91.0% | (89.6%, 92.2%) | 143 | 90.2% | (84.2%, 94.1%) |
| 35 to 44 years | 3,340 | 89.9% | (88.8%, 90.9%) | 346 | 85.5% | (81.4%, 88.8%) |
| 45 to 54 years | 4,136 | 89.3% | (88.3%, 90.2%) | 434 | 83.4% | (79.6%, 86.6%) |
| 55 to 64 years | 5,798 | 76.5% | (75.4%, 77.6%) | 566 | 72.1% | (68.3%, 75.6%) |
| 65+ years | 6,439 | 34.3% | (33.2%, 35.5%) | 590 | 39.4% | (35.5%, 43.4%) |
| Gender | ||||||
| Female | 20,112 | 79.7% | (79.1%, 80.3%) | 2,026 | 76.7% | (74.8%, 78.5%) |
| Male | 1,844 | 86.2% | (84.6%, 87.7%) | 108 | 74.6% | (65.6%, 81.9%) |
| Gender non-binary/ Genderqueer /Transgender | 37 | 93.1% | (80.3%, 97.8%) | * | * | * |
| Prefer not to respond | 384 | 82.9% | (78.8%, 86.3%) | 38 | 85.1% | (70.6%, 93.1%) |
| Race & Ethnicity | ||||||
| White | 20,068 | 80.0% | (79.4%, 80.5%) | 1,638 | 73.7% | (71.5%, 75.8%) |
| Black | 1,265 | 85.1% | (83.0%, 87.0%) | 453 | 86.2% | (82.7%, 89.1%) |
| American Indian or Alaska Native | 325 | 81.3% | (76.7%, 85.2%) | 46 | 71.6% | (57.3%, 82.6%) |
| Asian | 578 | 83.4% | (80.1%, 86.2%) | 39 | 76.8% | (61.5%, 87.3%) |
| Hispanic or Latinx | 453 | 88.0% | (84.7%, 90.7%) | 68 | 77.3% | (66.0%, 85.6%) |
| Middle Eastern | 286 | 81.5% | (76.6%, 85.6%) | 15 | 89.5% | (65.4%, 97.5%) |
| Other | 542 | 82.9% | (79.5%, 85.8%) | 86 | 82.2% | (72.8%, 88.9%) |
| Residence | ||||||
| Upper Peninsula | 717 | 79.6% | (76.5%, 82.4%) | 155 | 79.8% | (72.8%, 85.4%) |
| Northwest LP | 914 | 78.9% | (76.1%, 81.4%) | 92 | 60.1% | (49.9%, 69.5%) |
| Northeast LP | 450 | 76.8% | (72.7%, 80.5%) | 64 | 60.2% | (48.0%, 71.3%) |
| West/West Central | 3,154 | 80.8% | (79.4%, 82.1%) | 335 | 75.8% | (70.9%, 80.1%) |
| East Central | 1,162 | 82.5% | (80.2%, 84.6%) | 144 | 77.3% | (69.8%, 83.4%) |
| East | 1,749 | 82.6% | (80.8%, 84.3%) | 193 | 75.1% | (68.5%, 80.7%) |
| South Central | 889 | 81.2% | (78.5%, 83.6%) | 65 | 78.2% | (66.7%, 86.5%) |
| Southwest | 1,443 | 80.7% | (78.6%, 82.7%) | 158 | 76.7% | (69.5%, 82.6%) |
| Southeast | 2,247 | 78.8% | (77.1%, 80.4%) | 196 | 77.1% | (70.7%, 82.4%) |
| Detroit Metro | 6,446 | 79.4% | (78.4%, 80.4%) | 621 | 81.2% | (77.9%, 84.1%) |
| Unknown Michigan Residence | 892 | 88.0% | (85.7%, 90.0%) | 155 | 92.5% | (87.2%, 95.7%) |
| Non-Michigan Residence | 2,742 | 80.9% | (79.4%, 82.3%) | 92 | 64.5% | (54.3%, 73.5%) |
a The gender options have been combined for the purpose of increasing the likelihood of having enough responses to be included in the analysis. Should the number be high enough, we will revisit separating out options in future surveys.
b Respondents were instructed to mark all races that apply.
c Includes individuals who indicated they live in Michigan but did not provide a zip code.
* Data are suppressed if count is less than 10 or sample population was less than 20.
Demographic Characteristics of Survey Respondents in the Nursing Field
| Demographics | RN = 15,056 | LPN = 1,434 | ||
|---|---|---|---|---|
| Estimate | 95% CI | Estimate | 95% CI | |
| Age | ||||
| <25 years | 2.5% | (2.3%, 2.8%) | * | * |
| 25 to 34 years | 23.8% | (23.1%, 24.5%) | 20.0% | (18.0%, 22.1%) |
| 35 to 44 years | 27.2% | (26.5%, 27.9%) | 28.1% | (25.8%, 30.5%) |
| 45 to 54 years | 23.2% | (22.5%, 23.9%) | 25.1% | (22.9%, 27.4%) |
| 55 to 64 years | 17.7% | (17.1%, 18.3%) | 18.1% | (16.2%, 20.2%) |
| 65+ years | 5.5% | (5.1%, 5.9%) | 6.9% | (5.7%, 8.3%) |
| Gender | ||||
| Female | 88.3% | (87.8%, 88.8%) | 92.1% | (90.6%, 93.4%) |
| Male | 10.1% | (9.6%, 10.6%) | 5.5% | (4.4%, 6.8%) |
| Gender non-binary/ Genderqueer /Transgender | 0.3% | (0.2%, 0.4%) | * | * |
| Prefer not to respond | 1.3% | (1.1%, 1.5%) | 1.8% | (1.2%, 2.6%) |
| Race | ||||
| White | 90.2% | (89.7%, 90.7%) | 69.3% | (66.9%, 71.6%) |
| Black | 6.1% | (5.7%, 6.5%) | 27.2% | (25.0%, 29.6%) |
| Other | 6.7% | (6.3%, 7.1%) | 8.4% | (7.1%, 9.9%) |
| Hispanic or Latinx | ||||
| Yes | 2.8% | (2.5%, 3.1%) | 3.7% | (2.8%, 4.8%) |
| Middle Eastern | ||||
| Yes | 1.7% | (1.5%, 1.9%) | 1.1% | (0.7%, 1.8%) |
| Residence | ||||
| Upper Peninsula | 3.3% | (3.0%, 3.6%) | 8.2% | (6.9%, 9.7%) |
| Northwest LP | 3.8% | (3.5%, 4.1%) | 2.6% | (1.9%, 3.6%) |
| Northeast LP | 1.7% | (1.5%, 1.9%) | 2.3% | (1.6%, 3.2%) |
| West/West Central | 15.3% | (14.7%, 15.9%) | 14.0% | (12.3%, 15.9%) |
| East Central | 5.6% | (5.2%, 6.0%) | 6.7% | (5.5%, 8.1%) |
| East | 8.2% | (7.8%, 8.6%) | 9.4% | (8.0%, 11.0%) |
| South Central | 4.1% | (3.8%, 4.4%) | 2.8% | (2.1%, 3.8%) |
| Southwest | 6.5% | (6.1%, 6.9%) | 7.5% | (6.2%, 9.0%) |
| Southeast | 9.6% | (9.1%, 10.1%) | 8.7% | (7.3%, 10.3%) |
| Detroit Metro | 28.6% | (27.9%, 29.3%) | 32.0% | (29.6%, 34.5%) |
| Michigan Residence | 1.5% | (1.3%, 1.7%) | 2.1% | (1.5%, 3.0%) |
| Non-Michigan Residence | 11.8% | (11.3%, 12.3%) | 3.7% | (2.8%, 4.8%) |
a The gender options have been combined for the purpose of increasing the likelihood of having enough responses to be included in the analysis. Should the number be high enough, we will revisit separating out options in future surveys.
b Respondents were instructed to mark all races that apply.
c Includes individuals who indicated they were American Indian, Asian/PI, or “Other” race.
d Includes individuals who indicated they live in Michigan but did not provide a zip code.
* Data are suppressed if count is less than 10 or sample population was less than 20.
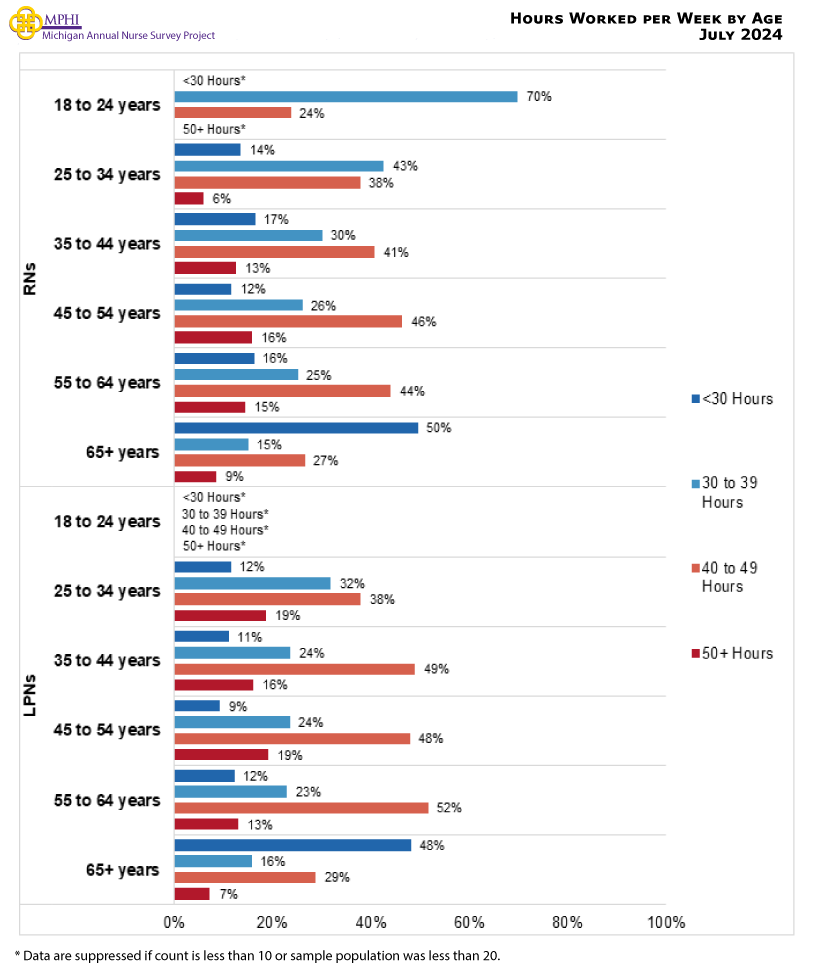
Hours Worked per Week by Age
Number of Years Working as a Nurse (RNs & LPNs)
| Years | RN = 16,059 | LPN = 1,540 | ||
|---|---|---|---|---|
| Estimate | 95% CI | Estimate | 95% CI | |
| Less than 3 years | 10.2% | (9.7%, 10.7%) | 17.9% | (16.1%, 19.9%) |
| 3 to less than 6 years | 11.8% | (11.3%, 12.3%) | 12.8% | (11.2%, 14.6%) |
| 6 to less than 10 years | 14.3% | (13.8%, 14.8%) | 14.0% | (12.4%, 15.8%) |
| 10 to less than 20 years | 29.5% | (28.8%, 30.2%) | 29.4% | (27.2%, 31.7%) |
| 20 or more years | 34.2% | (33.5%, 34.9%) | 26.0% | (23.9%, 28.2%) |
Number of Years Working as a Nurse (APNs only)
| Years | APN = 1,850 | |
|---|---|---|
| Estimate | 95% CI | |
| Less than 3 years | 0.7% | (0.4%, 1.2%) |
| 3 to less than 6 years | 4.6% | (3.7%, 5.7%) |
| 6 to less than 10 years | 13.5% | (12.0%, 15.1%) |
| 10 to less than 20 years | 42.8% | (40.6%, 45.1%) |
| 20 or more years | 38.5% | (36.3%, 40.7%) |
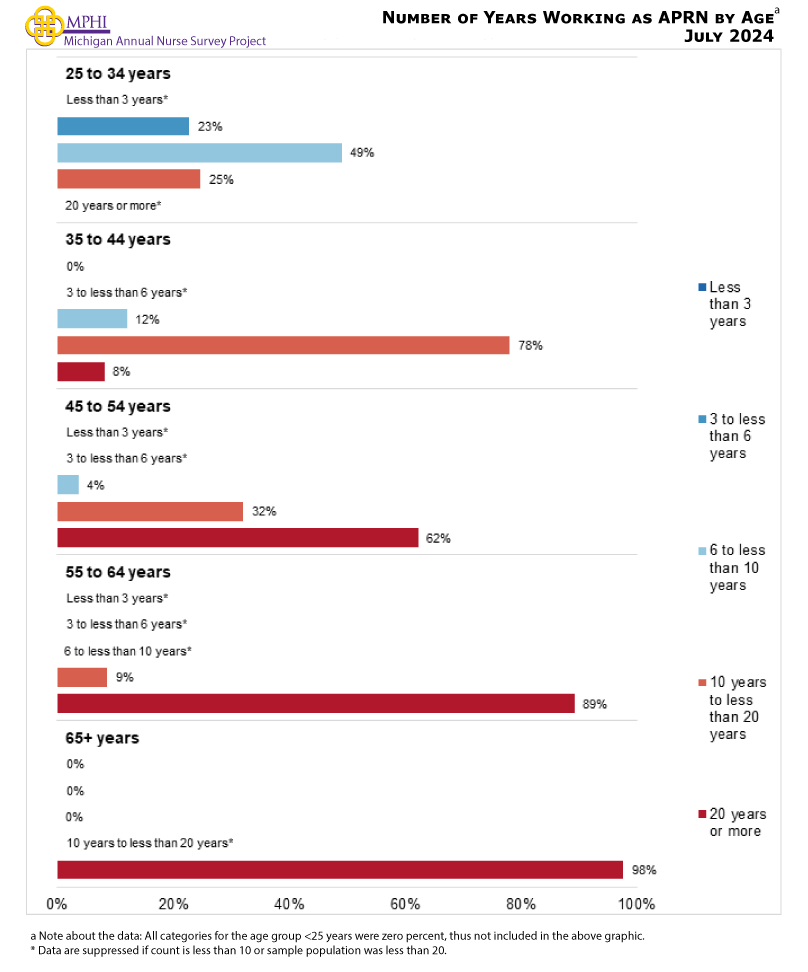
Number of Years Working as APN by Age, 2023
Number of Currently Employed Nursing Positions
| Number of Positions | RN = 17,127 | LPN = 1,697 | ||
|---|---|---|---|---|
| Estimate | 95% CI | Estimate | 95% CI | |
| 1 Position | 84.9% | (84.4%, 85.4%) | 79.3% | (77.3%, 81.2%) |
| 2 Position | 12.8% | (12.3%, 13.3%) | 18.5% | (16.7%, 20.4%) |
| 3+ Positions | 2.3% | (2.1%, 2.5%) | 2.2% | (1.6%, 3.0%) |
Employer Supports
| Supports | RN = 16,338 | LPN = 1,572 | ||
|---|---|---|---|---|
| Estimate | 95% CI | Estimate | 95% CI | |
| None of the below | 14.6% | (14.1%, 15.1%) | 36.9% | (34.5%, 39.3%) |
| Any Supports | ||||
| Tuition reimbursement | 63.8% | (63.1%, 64.5%) | 45.9% | (43.4%, 48.4%) |
| Paid time off for advancing nursing education | 6.8% | (6.4%, 7.2%) | 4.2% | (3.3%, 5.3%) |
| Paid time off for continuing education courses | 15.1% | (14.6%, 15.7%) | 4.2% | (3.3%, 5.3%) |
| Reimbursement for continuing education | 36.9% | (36.2%, 37.6%) | 18.2% | (16.4%, 20.2%) |
| Reimbursement for costs associated with obtaining advanced certification | 24.7% | (24.0%, 25.4%) | 6.1% | (5.0%, 7.4%) |
| Student loan repayment benefits | 13.1% | (12.6%, 13.6%) | 7.9% | (6.7%, 9.3%) |
| Nurse residency/Transitions to practice programs | 23.8% | (23.2%, 24.5%) | 3.9% | (3.0%, 5.0%) |
| Mentorship | 16.7% | (16.1%, 17.3%) | 6.1% | (5.0%, 7.4%) |
| Personal/mental health days separate from sick leave | 11.6% | (11.1%, 12.1%) | 10.5% | (9.1%, 12.1%) |
| Health and wellness stipends | 12.4% | (11.9%, 12.9%) | 5.2% | (4.2%, 6.4%) |
| Meditation/wellness app access | 16.6% | (16.0%, 17.2%) | 5.8% | (4.7%, 7.1%) |
| Access to counseling/mental health services/EAP | 49.6% | (48.8%, 50.4%) | 23.5% | (21.5%, 25.7%) |
| Housing supports | 1.8% | (1.6%, 2.0%) | 0.8% | (0.5%, 1.4%) |
| Self-care services | 15.9% | (15.3%, 16.5%) | 7.3% | (6.1%, 8.7%) |
a Respondents were instructed to mark all that apply.
Reason Employment is Outside of Michigan
| Reason | RN = 2,185 | LPN = 84 | ||
|---|---|---|---|---|
| Estimate | 95% CI | Estimate | 95% CI | |
| Living out of state | 62.8% | (60.8%, 64.8%) | 40.6% | (30.7%, 51.3%) |
| Semi-retired | 1.2% | (0.8%, 1.7%) | * | * |
| Taking care of home and family | 4.8% | (4.0%, 5.8%) | * | * |
| Better pay/wages/benefits | 16.4% | (14.9%, 18.0%) | 32.0% | (23.0%, 42.6%) |
| Better staffing/patient care ratios | 7.9% | (6.8%, 9.1%) | * | * |
| School | 1.1% | (0.7%, 1.6%) | * | * |
| Difficulty finding a nursing position | 3.4% | (2.7%, 4.2%) | * | * |
| Scope of practice regulation is more favorable outside of Michigan | 4.0% | (3.3%, 4.9%) | * | * |
| Travel nurse | 17.5% | (16.0%, 19.1%) | 24.5% | (16.6%, 34.7%) |
| Remote work such as online teaching, telehealth, or call centers | 23.1% | (21.4%, 24.9%) | 10.0% | (5.2%, 18.3%) |
| Military | 2.1% | (1.6%, 2.8%) | 0.0% | (0.0%, 4.4%) |
| Other | 4.6% | (3.8%, 5.6%) | 10.2% | (5.4%, 18.5%) |
a Respondents were instructed to mark all that apply.
* Data are suppressed if count is less than 10 or sample population was less than 20.
Employment Setting
Practice Setting
| Setting | RN = 17,024 | LPN = 1,677 | ||
|---|---|---|---|---|
| Estimate | 95% CI | Estimate | 95% CI | |
| Acute Care | 52.0% | (51.2%, 52.7%) | 15.8% | (14.1%, 17.6%) |
| Ambulatory Care | 24.7% | (24.1%, 25.4%) | 19.8% | (18.0%, 21.8%) |
| Community Health | 5.8% | (5.5%, 6.2%) | 10.6% | (9.2%, 12.2%) |
| Corrections | 1.0% | (0.9%, 1.2%) | 3.9% | (3.1%, 4.9%) |
| Emergent and Urgent Care | 12.4% | (11.9%, 12.9%) | 4.5% | (3.6%, 5.6%) |
| Long-term Care | 6.0% | (5.7%, 6.4%) | 50.8% | (48.4%, 53.2%) |
| Mobile and Home Care | 5.5% | (5.2%, 5.9%) | 16.7% | (15.0%, 18.6%) |
| Non-clinical | 9.2% | (8.8%, 9.6%) | 6.6% | (5.5%, 7.9%) |
| Public Health | 3.7% | (3.4%, 4.0%) | 3.2% | (2.5%, 4.2%) |
| School of Nursing | 4.1% | (3.8%, 4.4%) | 1.3% | (0.9%, 2.0%) |
| School Health | 1.7% | (1.5%, 1.9%) | 2.8% | (2.1%, 3.7%) |
| Other Community-based Health Care settings | 3.6% | (3.3%, 3.9%) | 16.5% | (14.8%, 18.4%) |
| Other Community-based Care | 2.8% | (2.6%, 3.1%) | 1.9% | (1.3%, 2.7%) |
a Respondents were instructed to mark all that apply.
Position and Role
| Position | RN = 16,682 | LPN = 1,629 | ||
|---|---|---|---|---|
| Estimate | 95% CI | Estimate | 95% CI | |
| Staff Nurse | 59.8% | (59.1%, 60.5%) | 78.5% | (76.5%, 80.4%) |
| Faculty | 4.3% | (4.0%, 4.6%) | 0.6% | (0.3%, 1.1%) |
| Education, Research, & Consulting | 9.1% | (8.7%, 9.5%) | 3.6% | (2.8%, 4.6%) |
| School Nurse | 1.5% | (1.3%, 1.7%) | 3.0% | (2.3%, 3.9%) |
| Telehealth | 4.5% | (4.2%, 4.8%) | 4.2% | (3.3%, 5.3%) |
| Travel Nurse | 3.6% | (3.3%, 3.9%) | 4.2% | (3.3%, 5.3%) |
| Executives | 4.9% | (4.6%, 5.2%) | 4.4% | (3.5%, 5.5%) |
| Patient Educator | 8.3% | (7.9%, 8.7%) | 10.1% | (8.7%, 11.6%) |
| APRN and Nurse Anesthetist | 10.9% | (10.4%, 11.4%) | * | * |
| Managerial | 9.3% | (8.9%, 9.7%) | 12.4% | (10.9%, 14.1%) |
| Military Health Services | 0.7% | (0.6%, 0.8%) | 1.4% | (0.9%, 2.1%) |
| Other Health Services | 16.1% | (15.6%, 16.7%) | 11.6% | (10.2%, 13.2%) |
| Other Health Non-related | 0.4% | (0.3%, 0.5%) | 0.9% | (0.5%, 1.5%) |
a Respondents were instructed to mark all that apply.
* Data are suppressed if count is less than 10 or sample population was less than 20.
Specialties
| Specialty | RN = 16,537 | LPN = 1,599 | ||
|---|---|---|---|---|
| Estimate | 95% CI | Estimate | 95% CI | |
| Academia | 3.6% | (3.3%, 3.9%) | 2.2% | (1.6%, 3.0%) |
| Adult Health | 24.8% | (24.2%, 25.5%) | 40.8% | (38.5%, 43.2%) |
| Anesthesia | 4.1% | (3.8%, 4.4%) | * | * |
| Behavioral Health | 7.5% | (7.1%, 7.9%) | 10.7% | (9.3%, 12.3%) |
| Care Management | 12.9% | (12.4%, 13.4%) | 9.1% | (7.8%, 10.6%) |
| Child & Family Health | 13.6% | (13.1%, 14.1%) | 18.2% | (16.4%, 20.1%) |
| Community Care | 4.8% | (4.5%, 5.1%) | 6.9% | (5.8%, 8.2%) |
| Critical Care | 17.8% | (17.2%, 18.4%) | 5.3% | (4.3%, 6.5%) |
| Dialysis Nurse | 1.9% | (1.7%, 2.1%) | 1.2% | (0.8%, 1.8%) |
| Geriatric Care | 11.4% | (10.9%, 11.9%) | 41.6% | (39.3%, 44.0%) |
| Hospice | 5.5% | (5.2%, 5.9%) | 13.2% | (11.7%, 14.9%) |
| Medical-Surgical & Wound Care | 19.3% | (18.7%, 19.9%) | 29.4% | (27.3%, 31.6%) |
| Occupational Health and Transitions of Care | 5.2% | (4.9%, 5.5%) | 7.0% | (5.9%, 8.3%) |
| Other | 13.0% | (12.5%, 13.5%) | 15.5% | (13.8%, 17.3%) |
| Other Non-clinical Specialties | 2.0% | (1.8%, 2.2%) | 1.8% | (1.3%, 2.6%) |
| Phlebotomy, Testing, & Diagnostics | 3.1% | (2.9%, 3.4%) | 6.0% | (5.0%, 7.2%) |
| Rehabilitation | 4.4% | (4.1%, 4.7%) | 22.4% | (20.5%, 24.5%) |
| Specialty Care | 16.4% | (15.9%, 17.0%) | 7.5% | (6.3%, 8.9%) |
| Surgical Services | 11.5% | (11.0%, 12.0%) | 1.5% | (1.0%, 2.2%) |
| Women & Infants Health | 9.5% | (9.1%, 9.9%) | 3.6% | (2.8%, 4.6%) |
a Respondents were instructed to mark all that apply.
* Data are suppressed if count is less than 10 or sample population was less than 20.
Change in Employment Setting
| Change in Employment Setting | RN = 16,338 | LPN = 1,572 | ||
|---|---|---|---|---|
| Estimate | 95% CI | Estimate | 95% CI | |
| Did not make a change | 57.0% | (56.2%, 57.8%) | 55.8% | (53.3%, 58.2%) |
| Among those who DID make a change: | ||||
| An inpatient setting to a community-based setting? | 5.6% | (5.3%, 6.0%) | 3.9% | (3.0%, 5.0%) |
| An inpatient setting to an outpatient setting? | 2.0% | (1.8%, 2.2%) | 2.4% | (1.8%, 3.3%) |
| A primary care setting (e.g., family practice, general medicine) to a specialty care setting? | 2.2% | (2.0%, 2.4%) | 3.2% | (2.4%, 4.2%) |
| A specialty care setting to a primary care setting? | 1.5% | (1.3%, 1.7%) | 2.0% | (1.4%, 2.8%) |
| A sub-acute care setting to an acute care setting? | 1.2% | (1.0%, 1.4%) | 2.3% | (1.7%, 3.2%) |
| An acute care setting to a sub-acute care setting? | 1.4% | (1.2%, 1.6%) | 1.3% | (0.8%, 2.0%) |
| A direct patient care setting to a non-direct patient care setting? | 6.0% | (5.6%, 6.4%) | 3.2% | (2.4%, 4.2%) |
| A non-direct patient care setting to a direct patient care setting? | 1.9% | (1.7%, 2.1%) | 3.3% | (2.5%, 4.3%) |
| I changed locations but stayed in the same care setting. | 12.4% | (11.9%, 12.9%) | 14.6% | (12.9%, 16.4%) |
| Some other type of change in employment. | 14.2% | (13.7%, 14.7%) | 14.1% | (12.5%, 15.9%) |
a Respondents were instructed to mark all that apply.
Reason for Change in Employment
| Reason | RN = | 6,200 | LPN = | 619 |
|---|---|---|---|---|
| Estimate | 95% CI | Estimate | 95% CI | |
| Preparing to retire | 6.0% | (5.4%, 6.6%) | 5.6% | (4.0%, 7.7%) |
| Care for home or family | 12.9% | (12.1%, 13.8%) | 9.6% | (7.5%, 12.2%) |
| Completed educational program | 9.4% | (8.7%, 10.2%) | 8.8% | (6.8%, 11.3%) |
| Changing to preferred nursing position | 26.0% | (24.9%, 27.1%) | 21.9% | (18.8%, 25.3%) |
| Seeking a less stressful position/setting | 44.4% | (43.2%, 45.6%) | 46.6% | (42.7%, 50.5%) |
| Difficulties with EMR/New technology | 0.4% | (0.3%, 0.6%) | * | * |
| Violence/safety Issues | 9.1% | (8.4%, 9.8%) | 7.3% | (5.5%, 9.6%) |
| Relocating/moving to another area | 11.9% | (11.1%, 12.7%) | 7.9% | (6.0%, 10.3%) |
| COVID-related | 5.9% | (5.3%, 6.5%) | 5.0% | (3.5%, 7.0%) |
| Temporary disability or long-term illness | 1.6% | (1.3%, 1.9%) | 1.8% | (1.0%, 3.2%) |
| Permanent disability leave | * | * | * | * |
| Wages | 27.9% | (26.8%, 29.0%) | 30.2% | (26.7%, 33.9%) |
| Work culture | 31.9% | (30.8%, 33.1%) | 27.9% | (24.5%, 31.6%) |
| Workload | 30.2% | (29.1%, 31.4%) | 32.8% | (29.2%, 36.6%) |
| Better schedule | 42.7% | (41.5%, 43.9%) | 37.6% | (33.9%, 41.5%) |
| Benefits and employer supports | 16.2% | (15.3%, 17.1%) | 16.0% | (13.3%, 19.1%) |
| Other | 7.9% | (7.3%, 8.6%) | 6.7% | (5.0%, 8.9%) |
a Respondents were instructed to mark all that apply.
* Data are suppressed if count is less than 10 or sample population was less than 20.
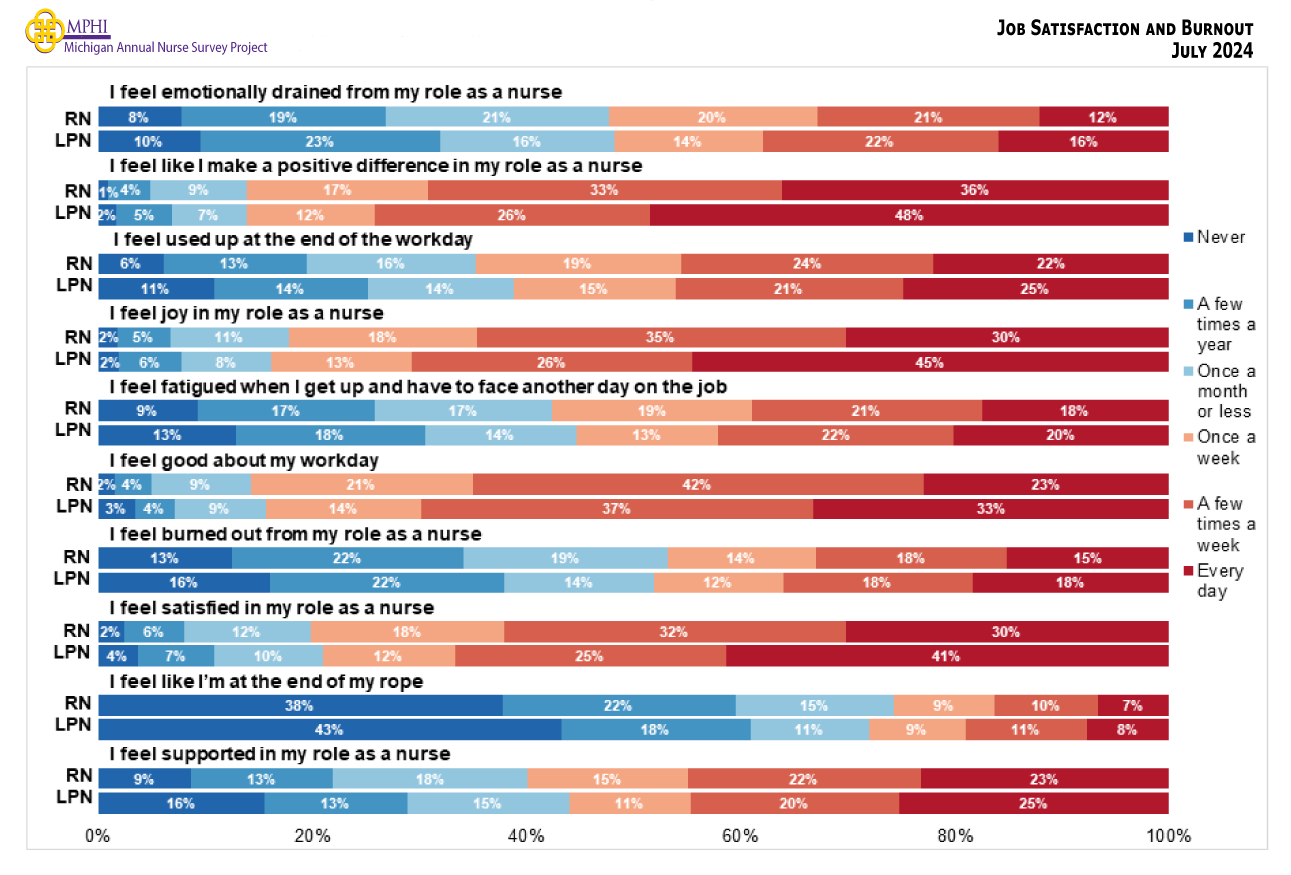
Job Satisfaction and Burnout
Job Satisfaction and Burnout
Nurses Experiencing Burnout At Least Once a Week by Practice Setting
| Setting | RN = 20,882 | LPN = 2,242 | ||
|---|---|---|---|---|
| Estimate | 95% CI | Estimate | 95% CI | |
| Acute Care | 52.6% | (51.5%, 53.7%) | 50.9% | (43.9%, 57.8%) |
| Ambulatory Care | 43.9% | (42.4%, 45.5%) | 40.5% | (35.2%, 46.1%) |
| Community Health | 44.3% | (41.2%, 47.4%) | 44.2% | (36.5%, 52.2%) |
| Corrections | 49.4% | (42.0%, 56.8%) | 39.4% | (27.8%, 52.4%) |
| Emergent and Urgent Care | 58.0% | (55.7%, 60.3%) | 53.1% | (40.1%, 65.7%) |
| Long-term Care | 55.0% | (52.0%, 58.0%) | 56.3% | (52.7%, 59.9%) |
| Mobile and Home Care | 45.6% | (42.5%, 48.7%) | 32.3% | (27.0%, 38.1%) |
| Non-clinical | 36.2% | (34.0%, 38.5%) | 42.0% | (33.5%, 51.1%) |
| Public Health | 37.8% | (34.0%, 41.8%) | 31.2% | (19.4%, 46.1%) |
| School of Nursing | 37.5% | (34.1%, 41.0%) | * | * |
| School Health | 33.7% | (28.4%, 39.4%) | * | * |
| Other Community-based Health Care settings | 42.5% | (38.8%, 46.3%) | 47.8% | (41.5%, 54.2%) |
| Other Community-based Care | 32.7% | (28.7%, 37.0%) | 47.1% | (29.6%, 65.4%) |
* Data are suppressed if count is less than 10 or sample population was less than 20.
Nurses Experiencing Burnout At Least Once a Week by Position
| Position | RN = 21,392 | LPN = 2,038 | ||
|---|---|---|---|---|
| Estimate | 95% CI | Estimate | 95% CI | |
| Staff Nurse | 50.8% | (49.8%, 51.8%) | 49.0% | (46.1%, 51.9%) |
| Faculty | 39.7% | (36.3%, 43.2%) | * | * |
| Education, Research, & Consulting | 41.1% | (38.7%, 43.5%) | 58.7% | (45.5%, 70.7%) |
| School Nurse | 30.3% | (25.0%, 36.2%) | 22.5% | (13.2%, 35.6%) |
| Telehealth | 45.4% | (41.9%, 49.0%) | 41.5% | (30.2%, 53.8%) |
| Travel Nurse | 59.5% | (55.2%, 63.7%) | 49.7% | (37.3%, 62.2%) |
| Executives | 44.6% | (41.4%, 47.9%) | 58.1% | (45.4%, 69.8%) |
| Patient Educator | 41.2% | (38.7%, 43.7%) | 39.3% | (32.3%, 46.8%) |
| APRN and Nurse Anesthetist | 45.4% | (43.0%, 47.8%) | * | * |
| Managerial | 52.1% | (49.6%, 54.6%) | 59.3% | (51.9%, 66.3%) |
| Military Health Services | 46.4% | (36.8%, 56.2%) | * | * |
| Other Health Services | 39.2% | (37.5%, 41.0%) | 41.6% | (35.0%, 48.5%) |
| Other Health Non-related | 37.0% | (27.0%, 48.2%) | * | * |
* Data are suppressed if count is less than 10 or sample population was less than 20.
Nurses Experiencing Burnout At Least Once a Week by Specialty
| Specialty | RN = 29,610 | LPN = 3,521 | ||
|---|---|---|---|---|
| Estimate | 95% CI | Estimate | 95% CI | |
| Academia | 37.5% | (33.8%, 41.3%) | 70.3% | (51.1%, 84.3%) |
| Adult Health | 52.6% | (51.0%, 54.2%) | 51.8% | (47.8%, 55.8%) |
| Anesthesia | 41.9% | (38.2%, 45.7%) | * | * |
| Behavioral Health | 52.0% | (49.1%, 54.9%) | 49.4% | (41.7%, 57.1%) |
| Care Management | 42.5% | (40.5%, 44.5%) | 42.2% | (34.4%, 50.5%) |
| Child & Family Health | 47.9% | (45.7%, 50.1%) | 36.7% | (31.4%, 42.4%) |
| Community Care | 44.4% | (41.0%, 47.9%) | 37.3% | (28.1%, 47.6%) |
| Critical Care | 56.8% | (54.8%, 58.8%) | 48.9% | (36.9%, 61.0%) |
| Dialysis Nurse | 48.0% | (42.4%, 53.6%) | * | * |
| Geriatric Care | 54.1% | (51.8%, 56.4%) | 55.3% | (51.3%, 59.2%) |
| Hospice | 56.8% | (53.4%, 60.1%) | 60.4% | (53.2%, 67.2%) |
| Medical-Surgical & Wound Care | 55.7% | (53.8%, 57.6%) | 55.8% | (50.8%, 60.7%) |
| Occupational Health and Transitions of Care | 51.2% | (47.8%, 54.6%) | 60.6% | (50.9%, 69.5%) |
| Other | 43.3% | (41.3%, 45.3%) | 48.9% | (43.1%, 54.8%) |
| Other Non-clinical Specialties | 35.2% | (30.5%, 40.2%) | * | * |
| Phlebotomy, Testing, & Diagnostics | 55.4% | (50.9%, 59.8%) | 56.5% | (45.5%, 66.9%) |
| Rehabilitation | 58.2% | (54.6%, 61.7%) | 60.7% | (55.1%, 66.1%) |
| Specialty Care | 54.7% | (52.7%, 56.7%) | 51.0% | (41.7%, 60.2%) |
| Surgical Services | 47.5% | (45.2%, 49.8%) | * | * |
| Women & Infants Health | 44.3% | (41.7%, 46.9%) | 44.8% | (31.6%, 58.7%) |
* Data are suppressed if count is less than 10 or sample population was less than 20.
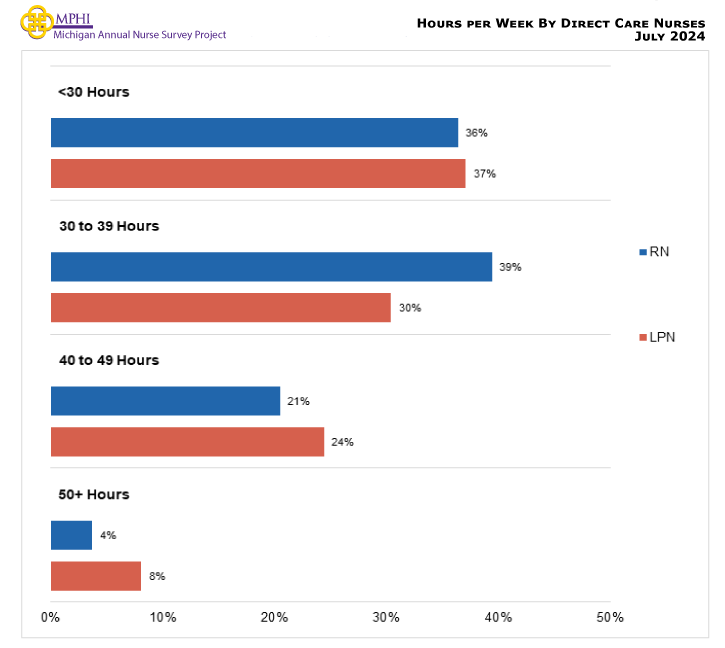
Direct Care
Hours Worked per Week by Direct Care Nurses
Direct Care Place of Employment Currently Accepting New Patients
| Accepting New Patients | RN = 12,704 | LPN = 1,409 | ||||
|---|---|---|---|---|---|---|
| N | Estimate | 95% CI | N | Estimate | 95% CI | |
| Yes | 11,803 | 93.2% | (92.7%, 93.6%) | 1,227 | 88.7% | (86.9%, 90.2%) |
| No | 299 | 2.0% | (1.8%, 2.3%) | 61 | 3.6% | (2.7%, 4.7%) |
| Unknown | 602 | 4.8% | (4.4%, 5.2%) | 121 | 7.7% | (6.4%, 9.2%) |
Direct Care Place of Employment Currently Accepting Medicaid Patients
| Accepting Medicaid Patients | RN = 12,684 | LPN = 1,407 | ||||
|---|---|---|---|---|---|---|
| N | Estimate | 95% CI | N | Estimate | 95% CI | |
| Yes | 11,175 | 89.5% | (89.0%, 90.0%) | 1,105 | 80.5% | (78.3%, 82.5%) |
| No | 662 | 4.4% | (4.1%, 4.8%) | 137 | 9.1% | (7.7%, 10.7%) |
| Unknown | 847 | 6.1% | (5.7%, 6.5%) | 165 | 10.5% | (9.0%, 12.2%) |
Direct Care Place of Employment Services to the Following Populations
| Populations Served | RN = 12,100 | LPN = 1,255 | ||||
|---|---|---|---|---|---|---|
| N | Estimate | 95% CI | N | Estimate | 95% CI | |
| Medicaid patients | 11,466 | 95.5% | (95.1%, 95.9%) | 1,169 | 93.9% | (92.4%, 95.1%) |
| American Indian/Alaska Native | 9,569 | 80.7% | (80.0%, 81.4%) | 761 | 60.5% | (57.8%, 63.2%) |
| Homeless | 9,765 | 83.0% | (82.3%, 83.7%) | 699 | 55.9% | (53.1%, 58.6%) |
| Migrant Farmworker | 7,339 | 63.4% | (62.5%, 64.3%) | 399 | 32.3% | (29.8%, 34.9%) |
| Migrant Seasonal Farmworker | 7,325 | 63.1% | (62.2%, 64.0%) | 399 | 32.4% | (29.9%, 35.0%) |
| Non-English speakers | 10,789 | 90.6% | (90.1%, 91.1%) | 860 | 67.3% | (64.7%, 69.8%) |
Plans to Continue Nursing
Plans to Continue Working as a Nurse
| Years | RN = 16,024 | LPN = 1,529 | ||
|---|---|---|---|---|
| Estimate | 95% CI | Estimate | 95% CI | |
| Less than 2 years | 7.5% | (7.1%, 7.9%) | 8.4% | (7.1%, 9.9%) |
| 2 to 5 years | 14.2% | (13.7%, 14.7%) | 10.9% | (9.4%, 12.6%) |
| 6 to 10 years | 15.4% | (14.8%, 16.0%) | 14.7% | (13.0%, 16.6%) |
| More than 10 years | 52.1% | (51.3%, 52.9%) | 48.8% | (46.3%, 51.3%) |
| Do not know | 10.7% | (10.2%, 11.2%) | 17.2% | (15.4%, 19.2%) |
Plans to Work Five Years or Less by Setting
| Setting | RN = 18,966 | LPN = 1,889 | ||||
|---|---|---|---|---|---|---|
| N | % | 95% CI | N | % | 95% CI | |
| Acute Care | 6,685 | 22.3% | (21.3%, 23.3%) | 166 | 16.9% | (12.0%, 23.3%) |
| Emergent and Urgent Care | 1,527 | 21.4% | (19.4%, 23.5%) | 45 | 17.4% | (9.0%, 30.9%) |
| Corrections | 158 | 28.1% | (21.7%, 35.6%) | 48 | 25.6% | (15.4%, 39.4%) |
| Long-term Care | 976 | 24.2% | (21.6%, 27.0%) | 597 | 20.7% | (17.6%, 24.1%) |
| Ambulatory Care | 3,640 | 23.7% | (22.3%, 25.1%) | 268 | 23.7% | (19.0%, 29.1%) |
| Mobile and Home Care | 901 | 26.4% | (23.6%, 29.4%) | 217 | 26.4% | (21.0%, 32.6%) |
| Non-clinical | 1,637 | 27.3% | (25.2%, 29.5%) | 97 | 29.6% | (21.4%, 39.3%) |
| School of Nursing | 694 | 24.8% | (21.7%, 28.1%) | 14 | 26.5% | (10.5%, 52.7%) |
| Public Health | 543 | 22.5% | (19.2%, 26.2%) | 38 | 14.6% | (6.7%, 29.0%) |
| Community Health | 890 | 21.0% | (18.5%, 23.8%) | 129 | 26.3% | (19.5%, 34.5%) |
| School Health | 259 | 26.5% | (21.5%, 32.2%) | 43 | 13.7% | (6.4%, 27.0%) |
| Other Community-based Healthcare | 610 | 27.0% | (23.6%, 30.7%) | 204 | 21.0% | (16.0%, 27.1%) |
| Other Community-based Care | 446 | 24.4% | (20.6%, 28.6%) | 23 | 20.8% | (19.5%, 34.5%) |
a Respondents were instructed to mark all that apply.
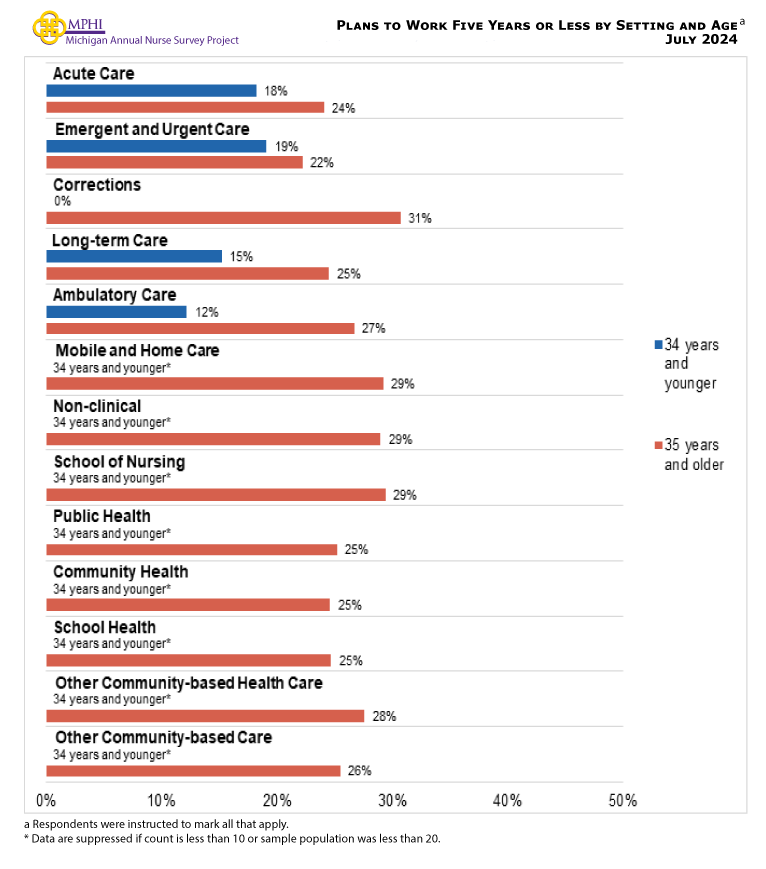
Plans to Work Five Years or Less by Setting and Age
Plans to Work Five Years or Less by Position
| Position | RN = 19,507 | LPN = 1,731 | ||||
|---|---|---|---|---|---|---|
| N | % | 95% CI | N | % | 95% CI | |
| Staff Nurse | 7,864 | 23.2% | (22.3%, 24.1%) | 961 | 21.1% | (18.6%, 23.8%) |
| Faculty | 710 | 25.7% | (22.6%, 29.0%) | 14 | 25.0% | (9.6%, 51.2%) |
| Education, Research, & Consulting | 1,510 | 26.8% | (24.6%, 29.1%) | 51 | 30.0% | (19.2%, 43.6%) |
| School Nurse | 234 | 27.2% | (21.9%, 33.2%) | 44 | 18.0% | (9.4%, 31.8%) |
| Telehealth | 696 | 19.6% | (16.8%, 22.7%) | 55 | 23.1% | (13.9%, 35.8%) |
| Travel Nurse | 442 | 31.5% | (27.3%, 36.0%) | 51 | 20.6% | (11.8%, 33.6%) |
| Executives | 860 | 23.9% | (21.2%, 26.9%) | 51 | 23.4% | (13.9%, 36.6%) |
| Patient Educator | 1,348 | 25.6% | (23.3%, 28.0%) | 146 | 23.7% | (17.5%, 31.2%) |
| APRN and Nurse Anesthetist | 1,531 | 16.5% | (14.7%, 18.4%) | * | * | * |
| Managerial | 1,395 | 20.3% | (18.3%, 22.5%) | 154 | 21.7% | (15.9%, 28.9%) |
| Military Health Services | 87 | 16.4% | (10.1%, 25.6%) | 21 | 20.9% | (8.8%, 42.0%) |
| Other Health Services | 2,759 | 27.3% | (25.7%, 29.0%) | 169 | 26.4% | (20.3%, 33.5%) |
| Other Health Non-related | 71 | 32.1% | (22.4%, 43.6%) | 12 | 35.7% | (15.3%, 63.0%) |
a Respondents were instructed to mark all that apply.
* Data are suppressed if count is less than 10 or sample population was less than 20.
Plans to Work Five Years or Less by Specialty
| Specialty | RN = 26,759 | LPN = 2,933 | ||||
|---|---|---|---|---|---|---|
| N | % | 95% CI | N | % | 95% CI | |
| Academia | 591 | 23.5% | (20.3%, 27.1%) | 23 | 18.4% | (7.6%, 38.3%) |
| Adult Health | 3,299 | 21.6% | (20.2%, 23.0%) | 490 | 22.0% | (18.6%, 25.9%) |
| Anesthesia | 599 | 20.2% | (17.2%, 23.6%) | * | * | * |
| Behavioral Health | 1,009 | 22.4% | (19.9%, 25.1%) | 138 | 18.8% | (13.2%, 26.1%) |
| Care Management | 2,137 | 25.0% | (23.2%, 26.9%) | 123 | 17.9% | (12.1%, 25.6%) |
| Child & Family Health | 1,853 | 20.9% | (19.1%, 22.8%) | 244 | 25.7% | (20.6%, 31.5%) |
| Community Care | 714 | 20.9% | (18.1%, 24.0%) | 77 | 14.3% | (8.2%, 23.8%) |
| Critical Care | 2,137 | 22.6% | (20.9%, 24.4%) | 50 | 6.2% | (2.2%, 16.5%) |
| Dialysis Nurse | 273 | 21.7% | (17.2%, 27.0%) | 13 | 0.0% | (0.0%, 22.8%) |
| Geriatric Care | 1,623 | 23.1% | (21.1%, 25.2%) | 503 | 21.5% | (18.1%, 25.3%) |
| Hospice | 776 | 21.0% | (18.3%, 24.0%) | 147 | 22.3% | (16.3%, 29.7%) |
| Medical-Surgical & Wound Care | 2,430 | 20.7% | (19.1%, 22.4%) | 324 | 18.8% | (14.9%, 23.4%) |
| Occupational Health and Transitions of Care | 762 | 24.2% | (21.3%, 27.4%) | 83 | 22.4% | (14.8%, 32.5%) |
| Other | 2,062 | 26.7% | (24.8%, 28.7%) | 232 | 31.0% | (25.4%, 37.2%) |
| Other non-clinical specialties | 343 | 26.8% | (22.4%, 31.7%) | 22 | 31.4% | (16.1%, 52.3%) |
| Phlebotomy, Testing, & Diagnostics | 420 | 22.9% | (19.1%, 27.2%) | 67 | 24.8% | (16.0%, 36.3%) |
| Rehabilitation | 657 | 23.5% | (20.4%, 26.9%) | 233 | 19.2% | (14.7%, 24.7%) |
| Specialty Care | 2,128 | 23.5% | (21.7%, 25.3%) | 96 | 12.1% | (7.0%, 20.1%) |
| Surgical Services | 1,680 | 24.7% | (22.7%, 26.8%) | 19 | 32.2% | (15.8%, 54.6%) |
| Women & Infants Health | 1,266 | 21.8% | (19.6%, 24.2%) | 43 | 22.2% | (12.4%, 36.6%) |
a Respondents were instructed to mark all that apply.
* Data are suppressed if count is less than 10 or sample population was less than 20.
Reason for Leaving Nursing for those Leaving Nursing in Less than Five Year
| Reason | RN = 5,387 | LPN = 440 | ||
|---|---|---|---|---|
| Estimate | 95% CI | Estimate | 95% CI | |
| Retiring | 66.8% | (65.5%, 68.0%) | 63.8% | (59.2%, 68.2%) |
| Care for home or family | 8.6% | (7.9%, 9.4%) | 5.7% | (3.9%, 8.3%) |
| Enrolled in education program | 5.1% | (4.5%, 5.7%) | * | * |
| Difficulty finding a nursing position | 0.9% | (0.7%, 1.2%) | * | * |
| Too stressful/burned out | 34.1% | (32.8%, 35.4%) | 36.8% | (32.4%, 41.4%) |
| Difficulties with EMR/new technology | 1.6% | (1.3%, 2.0%) | * | * |
| Violence/safety issues | 12.6% | (11.7%, 13.5%) | 9.8% | (7.4%, 12.9%) |
| Relocating/moving to another area | 2.7% | (2.3%, 3.2%) | 4.8% | (3.2%, 7.2%) |
| COVID-related | 1.2% | (0.9%, 1.5%) | * | * |
| Temporary disability or long-term illness | 0.6% | (0.4%, 0.8%) | * | * |
| Permanent disability leave | * | * | * | * |
| Wages | 20.0% | (19.0%, 21.1%) | 21.0% | (17.5%, 25.0%) |
| Work culture | 20.8% | (19.7%, 21.9%) | 21.6% | (18.0%, 25.7%) |
| Workload | 26.1% | (24.9%, 27.3%) | 29.9% | (25.8%, 34.3%) |
| Better Schedule | 11.9% | (11.1%, 12.8%) | 13.3% | (10.4%, 16.8%) |
| Benefits and employer supports | 12.7% | (11.8%, 13.6%) | 13.2% | (10.4%, 16.7%) |
| Other | 1.3% | (1.0%, 1.6%) | * | * |
a Respondents were instructed to mark all that apply.
b Other includes reasons such as family care, not enjoying the profession and/or needing a change, a few respondents mentioned concerns about COVID-19.
* Data are suppressed if count is less than 10 or sample population was less than 20.
Reasons for Leaving Nursing for those Leaving Nursing in Less than Five Years by Region of Residence
| Reason | Upper Peninsula | Northwest LP | Northeast LP | West/West Central | East Central | East | South Central | Southwest | Southeast | Detroit Metro |
|---|---|---|---|---|---|---|---|---|---|---|
| N | N | N | N | N | N | N | N | N | N | |
| Estimate | Estimate | Estimate | Estimate | Estimate | Estimate | Estimate | Estimate | Estimate | Estimate | |
| 95% CI | 95% CI | 95% CI | 95% CI | 95% CI | 95% CI | 95% CI | 95% CI | 95% CI | 95% CI | |
| Retiring | 169 | 220 | 119 | 637 | 240 | 354 | 178 | 355 | 459 | 1,325 |
| 77.2% | 61.1% | 54.7% | 72.6% | 65.6% | 68.4% | 79.9% | 74.5% | 72.3% | 60.5% | |
| (70.9%, 82.5%) | (55.1%, 66.8%) | (46.6%, 62.6%) | (69.3%, 75.7%) | (60.0%, 70.8%) | (63.8%, 72.6%) | (73.8%, 84.8%) | (70.1%, 78.5%) | (68.4%, 75.9%) | (58.1%, 62.8%) | |
| Care for home or family | 18 | 16 | 11 | 44 | 18 | 27 | 22 | 33 | 49 | 113 |
| 9.1% | 12.2% | 6.7% | 6.9% | 5.4% | 6.5% | 12.9% | 8.3% | 11.4% | 10.2% | |
| (5.8%, 13.9%) | (8.8%, 16.7%) | (3.6%, 12.0%) | (5.3%, 8.9%) | (3.4%, 8.6%) | (4.5%, 9.2%) | (9.0%, 18.2%) | (6.0%, 11.4%) | (9.0%, 14.4%) | (8.8%, 11.8%) | |
| Enrolled in education program | * | * | * | 13 | * | * | * | * | 12 | 42 |
| * | * | * | 4.3% | * | * | * | * | 6.0% | 7.3% | |
| * | * | * | (3.1%, 6.0%) | * | * | * | * | (4.3%, 8.3%) | (6.1%, 8.7%) | |
| Difficulty finding a nursing position | * | 0 | * | * | * | * | * | * | * | 14 |
| * | 0.0% | * | * | * | * | * | * | * | 1.0% | |
| * | (0.0%, 0.0%) | * | * | * | * | * | * | * | (0.6%, 1.6%) | |
| Too stressful/burned out | 46 | 82 | 36 | 128 | 86 | 113 | 43 | 85 | 119 | 384 |
| 30.2% | 47.4% | 46.2% | 26.2% | 40.2% | 38.2% | 24.9% | 31.2% | 25.8% | 36.9% | |
| (24.3%, 36.9%) | (41.5%, 53.4%) | (38.3%, 54.3%) | (23.2%, 29.5%) | (34.8%, 45.9%) | (33.7%, 42.9%) | (19.4%, 31.3%) | (26.9%, 35.8%) | (22.3%, 29.7%) | (34.6%, 39.3%) | |
| Difficulties with EMR/new technology | * | * | * | 17 | * | * | * | * | 15 | 21 |
| * | * | * | 1.8% | * | * | * | * | 2.2% | 1.1% | |
| * | * | * | (1.1%, 3.0%) | * | * | * | * | (1.3%, 3.8%) | (0.7%, 1.7%) | |
| Violence/safety issues | 10 | 20 | * | 37 | 28 | 33 | 18 | 32 | 26 | 124 |
| 5.6% | 21.9% | * | 9.4% | 17.7% | 14.1% | 10.5% | 10.9% | 6.7% | 13.8% | |
| (3.2%, 9.7%) | (17.3%, 27.3%) | * | (7.5%, 11.7%) | (13.8%, 22.5%) | (11.1%, 17.7%) | (7.0%, 15.5%) | (8.2%, 14.3%) | (4.9%, 9.1%) | (12.2%, 15.6%) | |
| Relocating/moving to another area | 0 | * | * | * | * | * | * | * | 13 | 44 |
| 0.0% | * | * | * | * | * | * | * | 4.5% | 2.9% | |
| (0.0%, 0.0%) | * | * | * | * | * | * | * | (3.0%, 6.6%) | (2.2%, 3.8%) | |
| COVID-related | * | * | * | * | * | * | * | * | * | 17 |
| * | * | * | * | * | * | * | * | * | 0.8% | |
| * | * | * | * | * | * | * | * | * | (0.5%, 1.4%) | |
| Temporary disability or long-term illness | * | * | * | * | * | * | * | * | * | 13 |
| * | * | * | * | * | * | * | * | * | 0.5% | |
| * | * | * | * | * | * | * | * | * | (0.3%, 1.0%) | |
| Permanent disability leave | 0 | 0 | * | 0 | 0 | * | 0 | * | * | * |
| 0.0% | 0.0% | * | 0.0% | 0.0% | * | 0.0% | * | * | * | |
| (0.0%, 0.0%) | (0.0%, 0.0%) | * | (0.0%, 0.0%) | (0.0%, 0.0%) | * | (0.0%, 0.0%) | * | * | * | |
| Wages | 25 | 40 | 15 | 64 | 49 | 56 | 12 | 39 | 50 | 220 |
| 14.6% | 24.7% | 28.8% | 13.5% | 26.9% | 22.4% | 6.9% | 16.7% | 14.9% | 23.9% | |
| (10.4%, 20.2%) | (19.9%, 30.2%) | (22.0%, 36.7%) | (11.2%, 16.1%) | (22.2%, 32.2%) | (18.7%, 26.6%) | (4.1%, 11.3%) | (13.4%, 20.6%) | (12.1%, 18.2%) | (21.9%, 26.0%) | |
| Work culture | 29 | 51 | 23 | 79 | 54 | 78 | 31 | 54 | 64 | 226 |
| 19.9% | 27.4% | 31.2% | 14.8% | 26.3% | 28.3% | 15.1% | 22.5% | 16.2% | 20.5% | |
| (15.0%, 26.0%) | (22.4%, 33.1%) | (24.2%, 39.2%) | (12.4%, 17.5%) | (21.6%, 31.6%) | (24.2%, 32.7%) | (10.8%, 20.7%) | (18.7%, 26.8%) | (13.3%, 19.5%) | (18.6%, 22.5%) | |
| Workload | 32 | 60 | 24 | 111 | 61 | 93 | 35 | 69 | 77 | 289 |
| 18.4% | 34.5% | 26.1% | 21.3% | 31.4% | 29.8% | 19.4% | 26.0% | 19.8% | 27.8% | |
| (13.6%, 24.3%) | (29.0%, 40.4%) | (19.6%, 33.8%) | (18.5%, 24.4%) | (26.4%, 36.9%) | (25.7%, 34.3%) | (14.5%, 25.4%) | (22.0%, 30.4%) | (16.7%, 23.4%) | (25.7%, 30.0%) | |
| Undesirable schedule | 12 | 26 | 13 | 42 | 22 | 43 | 11 | 38 | 31 | 120 |
| 6.6% | 12.1% | 15.9% | 8.8% | 12.3% | 13.6% | 6.2% | 14.3% | 8.7% | 13.0% | |
| (3.9%, 10.9%) | (8.7%, 16.6%) | (10.8%, 22.7%) | (7.0%, 11.0%) | (9.0%, 16.5%) | (10.7%, 17.2%) | (3.6%, 10.4%) | (11.2%, 18.0%) | (6.6%, 11.4%) | (11.5%, 14.7%) | |
| Benefits and employer supports | 14 | 38 | 14 | 39 | 32 | 39 | * | 34 | 27 | 157 |
| 7.6% | 18.5% | 21.1% | 8.5% | 17.4% | 12.6% | * | 13.8% | 8.0% | 15.3% | |
| (4.7%, 12.1%) | (14.3%, 23.6%) | (15.2%, 28.5%) | (6.7%, 10.7%) | (13.5%, 22.1%) | (9.8%, 16.1%) | * | (10.8%, 17.5%) | (6.0%, 10.6%) | (13.6%, 17.1%) | |
| Other | * | * | * | 10 | * | * | * | * | * | 22 |
| * | * | * | 1.2% | * | * | * | * | * | 1.7% | |
| * | * | * | (0.6%, 2.3%) | * | * | * | * | * | (1.2%, 2.4%) |
* Data are suppressed if count is less than 10 or sample population was less than 20.
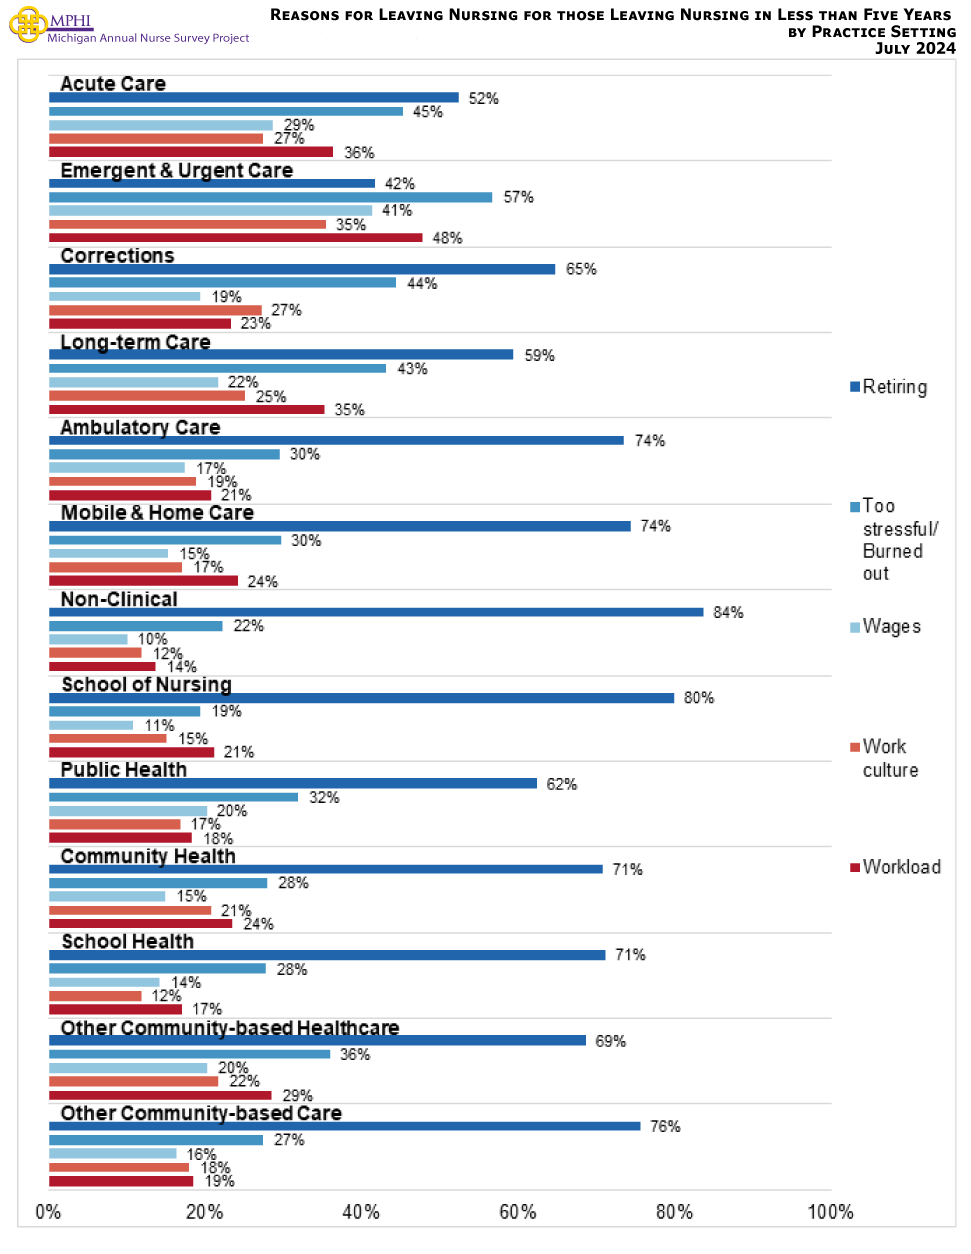
Reasons for Leaving Nursing for those Leaving Nursing in Less than Five Years by Practice Setting
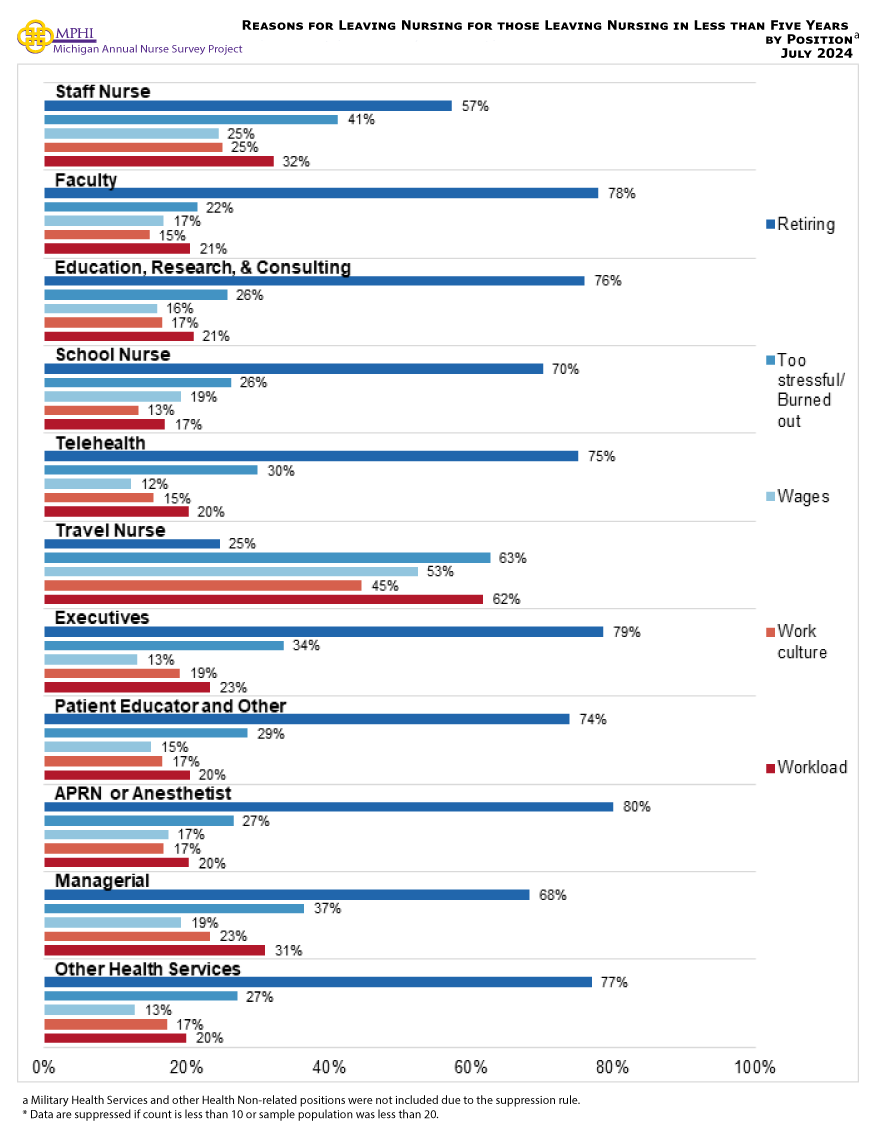
Reasons for Leaving Nursing for those Leaving Nursing in Less than Five Years by Position, 2024
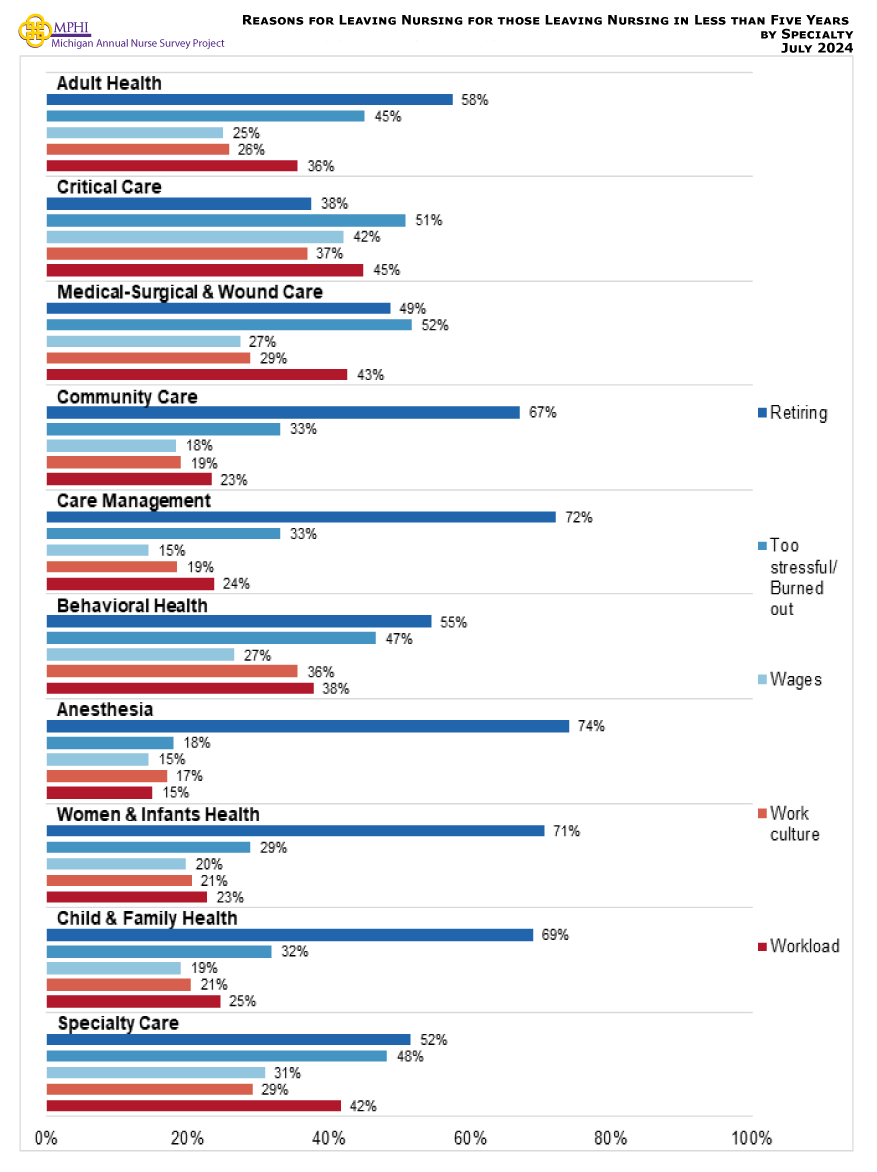
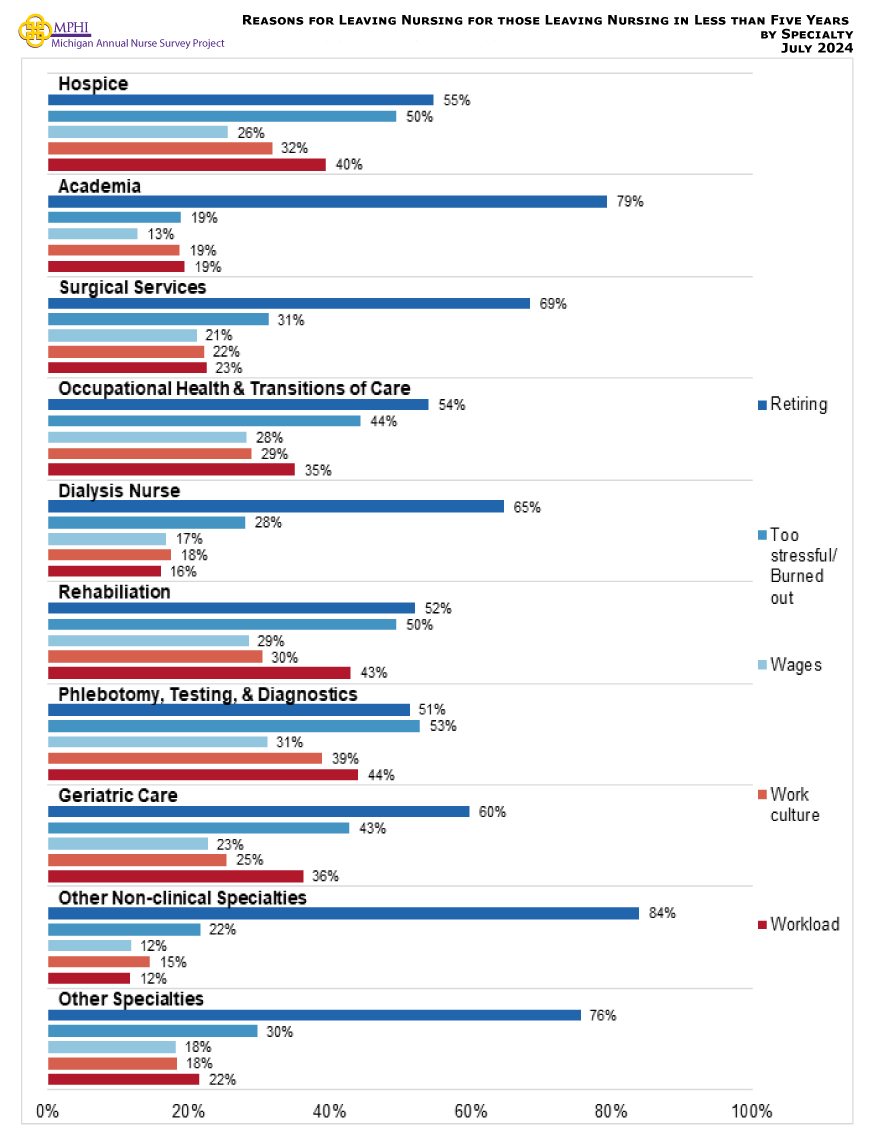
Reasons for Leaving Nursing for those Leaving Nursing in Less than Five Years by Specialty
New Nurse Experience
Preparedness for Entering Nursing Workforce
| Level of Preparedness | RN = 840 | LPN = 160 | ||
|---|---|---|---|---|
| Estimate | 95% CI | Estimate | 95% CI | |
| Adequately prepared | 38.6% | (35.4%, 41.9%) | 40.2% | (32.9%, 47.9%) |
| Not enough classroom time | 4.3% | (3.1%, 5.9%) | * | * |
| Not enough clinical time | 46.3% | (43.0%, 49.7%) | 42.0% | (34.6%, 49.7%) |
| Not enough skills lab/simulation time | 29.2% | (26.2%, 32.4%) | 29.3% | (22.8%, 36.8%) |
| Not enough critical thinking/ prioritization practice | 28.3% | (25.4%, 31.4%) | 24.8% | (18.8%, 32.0%) |
| Other | 2.0% | (1.2%, 3.2%) | * | * |
a Respondents were instructed to mark all that apply.
* Data are suppressed if count is less than 10 or sample population was less than 20.
Finding Employment for Nurses Entering Workforce
| Finding Employment | RN = 843 | LPN = 162 | ||
|---|---|---|---|---|
| Estimate | 95% CI | Estimate | 95% CI | |
| Difficulty Finding a Nursing Position | ||||
| Very difficult | * | * | * | * |
| Difficult | 2.8% | (1.9%, 4.1%) | * | * |
| Neutral | 13.5% | (11.4%, 16.0%) | 18.3% | (13.1%, 25.0%) |
| Easy | 35.8% | (32.6%, 39.1%) | 19.8% | (14.4%, 26.6%) |
| Very easy | 47.6% | (44.2%, 51.0%) | 55.2% | (47.5%, 62.6%) |
| Difficulty Finding a Nursing Position in Preferred Practice Area | ||||
| Very difficult | 4.9% | (3.6%, 6.6%) | 9.3% | (5.7%, 14.8%) |
| Difficult | 16.8% | (14.4%, 19.5%) | 16.8% | (11.8%, 23.3%) |
| Neutral | 24.8% | (22.0%, 27.8%) | 22.4% | (16.6%, 29.4%) |
| Easy | 29.6% | (26.6%, 32.8%) | 23.2% | (17.4%, 30.3%) |
| Very easy | 23.9% | (21.1%, 26.9%) | 28.3% | (21.9%, 35.7%) |
| Had a Residency Placement as Part of Nursing Program | ||||
| Yes | 49.4% | (46.0%, 52.8%) | 12.2% | (8.0%, 18.2%) |
| No | 50.6% | (47.2%, 54.0%) | 87.8% | (81.8%, 92.0%) |
| Satisfaction with Orientation at Place of Employment | ||||
| Very dissatisfied | 3.5% | (2.5%, 5.0%) | 6.0% | (3.3%, 10.8%) |
| Dissatisfied | 8.5% | (6.8%, 10.6%) | 15.1% | (10.4%, 21.4%) |
| Neutral | 25.2% | (22.4%, 28.2%) | 36.1% | (29.1%, 43.7%) |
| Satisfied | 48.4% | (45.0%, 51.8%) | 32.3% | (25.6%, 39.8%) |
| Very satisfied | 14.5% | (12.3%, 17.0%) | 10.6% | (6.7%, 16.3%) |
* Data are suppressed if count is less than 10 or sample population was less than 20.
New Nurse Educational Program Experience
| New Nurse Educational Program Experience | RN = 839 | LPN = 161 | ||
|---|---|---|---|---|
| Estimate | 95% CI | Estimate | 95% CI | |
| Exposure to Nursing During Middle or High School | ||||
| Yes, programs completed in middle or high school to explore career in nursing | 17.0% | (14.6%, 19.7%) | 13.8% | (9.3%, 20.0%) |
| Yes, program completed in middle or high school to build academic skills related to nursing | 8.1% | (6.4%, 10.1%) | 6.7% | (3.8%, 11.7%) |
| No | 73.1% | (70.0%, 76.0%) | 76.5% | (69.4%, 82.4%) |
| Other | 1.8% | (1.1%, 2.9%) | * | * |
| Nursing Program Characteristics | ||||
| Holistic admissions | 21.4% | (18.8%, 24.3%) | 13.4% | (9.0%, 19.5%) |
| Public | 58.1% | (54.7%, 61.4%) | 34.5% | (27.6%, 42.1%) |
| Private | 21.6% | (18.9%, 24.5%) | 9.8% | (6.1%, 15.4%) |
| For profit institutions | 7.4% | (5.8%, 9.4%) | 7.4% | (4.3%, 12.5%) |
| Online | 28.7% | (25.7%, 31.9%) | 29.0% | (22.5%, 36.4%) |
| In-person | 54.7% | (51.3%, 58.0%) | 50.0% | (42.4%, 57.6%) |
| Hybrid online and in-person program | 55.3% | (51.9%, 58.6%) | 45.0% | (37.5%, 52.7%) |
| Full-time program | 85.3% | (82.7%, 87.5%) | 71.2% | (63.8%, 77.6%) |
| Part-time program | 10.2% | (8.3%, 12.4%) | 11.5% | (7.4%, 17.3%) |
| Accelerated graduation date due to COVID | 3.8% | (2.7%, 5.3%) | 7.6% | (4.4%, 12.8%) |
| Reduced in-person clinical experience due to COVID | 60.7% | (57.4%, 64.0%) | 30.0% | (23.5%, 37.5%) |
| Nursing Program Supports | ||||
| Academic supports available | 86.4% | (83.9%, 88.6%) | 72.0% | (64.2%, 78.6%) |
| Supports available to navigate college experience | 40.3% | (37.0%, 43.7%) | 23.8% | (17.6%, 31.3%) |
| English as a second language supports available | 12.0% | (9.9%, 14.4%) | * | * |
| Mentorship | 28.1% | (25.1%, 31.3%) | 13.3% | (8.7%, 19.8%) |
| Scholarship | 63.0% | (59.6%, 66.3%) | 39.9% | (32.3%, 48.0%) |
| Work study | 25.0% | (22.1%, 28.1%) | 17.2% | (11.9%, 24.1%) |
| Student loans | 67.1% | (63.8%, 70.3%) | 71.9% | (64.1%, 78.6%) |
| Other | * | * | * | * |
a Respondents were instructed to mark all that apply.
* Data are suppressed if count is less than 10 or sample population was less than 20.
Workplace Violence
Type & Perpetrator of Workplace Violence
Demographic of Nurses Experiencing Workplace Violence in the Past Year
| Characteristics | RNs | LPNs | ||
|---|---|---|---|---|
| n | Estimate | n | Estimate | |
| Total | 15,450 | 46.3% | 1,466 | 32.7% |
| Age | ||||
| <25 years | 123 | 62.6% | * | * |
| 25 to 34 years | 1,574 | 59.8% | 127 | 41.7% |
| 35 to 44 years | 2,938 | 48.2% | 292 | 36.0% |
| 45 to 54 years | 3,593 | 42.6% | 347 | 25.6% |
| 55 to 64 years | 4,339 | 35.2% | 391 | 29.4% |
| 65+ years | 2,146 | 22.9% | 227 | 19.8% |
| Gender | ||||
| Female | 13,589 | 45.3% | 1,342 | 31.6% |
| Male | 1,407 | 52.7% | 76 | 40.9% |
| Gender non-binary/non-conforming, Genderqueer, Transgender | 31 | 75.4% | * | * |
| Prefer not to respond | 260 | 63.1% | 28 | 51.2% |
| Ethnicity | ||||
| Hispanic or Latinx | 365 | 52.4% | 44 | 43.9% |
| Middle Eastern | 206 | 45.9% | * | * |
| Race | ||||
| White | 13,592 | 47.3% | 1,032 | 36.2% |
| Black | 937 | 34.7% | 73 | 21.6% |
| American Indian | 224 | 59.0% | 30 | 37.9% |
| Asian/ Pacific Islander | 445 | 41.8% | * | * |
| Other | 387 | 51.8% | 57 | 46.5% |
| Employment Region | ||||
| Eastern/Central/Western UP | 503 | 43.4% | 115 | 35.2% |
| Northwest LP | 577 | 45.0% | 36 | 40.1% |
| Northeast LP | 264 | 47.1% | * | * |
| West/West Central | 2,090 | 50.5% | 206 | 39.7% |
| East Central | 834 | 49.3% | 112 | 26.5% |
| East | 982 | 49.8% | 102 | 30.9% |
| South Central | 631 | 50.8% | 46 | 43.9% |
| Southwest | 999 | 54.8% | 106 | 40.9% |
| Southeast | 1,768 | 47.6% | 141 | 36.5% |
| Detroit Metro | 4,225 | 45.7% | 446 | 27.4% |
| Outside of MI | 2,046 | 33.7% | 71 | 25.3% |
| Unknown MI Region | 531 | 45.6% | 47 | 41.4% |
| Region of Residence | ||||
| Upper Peninsula | 482 | 42.3% | 109 | 34.7% |
| Northwest LP | 580 | 46.0% | 43 | 40.3% |
| Northeast LP | 291 | 44.7% | * | * |
| West/West Central | 2,157 | 49.8% | 212 | 38.4% |
| East Central | 800 | 49.8% | 101 | 27.4% |
| East | 1,220 | 49.5% | 122 | 29.3% |
| South Central | 613 | 53.7% | 41 | 55.0% |
| Southwest | 996 | 53.5% | 107 | 43.2% |
| Southeast | 1,491 | 47.2% | 129 | 30.7% |
| Detroit Metro | 4,303 | 45.6% | 447 | 28.0% |
| Non-Michigan Residence | 1,984 | 33.6% | 63 | 25.2% |
| Unknown MI Region | 533 | 51.9% | 51 | 50.1% |
a The gender options have been combined for the purpose of increasing the likelihood of having enough responses to be included in the analysis. Should the number be high enough, we will revisit separating out options in future surveys.
b Respondents were instructed to mark all races that apply.
Ϯ The n represents the total number of nurses who responded to the workplace violence section of the survey
¥ Estimates reflect the weighted percentage of nurses who said “Yes” to experiencing workplace violence
* Data are suppressed if count is less than 10 or sample population was less than 20.
Demographics of those Nurses who Experienced Workplace Violence, 2023-2024
| Characteristics | 2023 | 2024 | ||||||
|---|---|---|---|---|---|---|---|---|
| RNs | LPNs | RNs | LPNs | |||||
| n | Estimate | n | Estimate | n | Estimate | n | Estimate | |
| Total | 13,437 | 44.2% | 1,174 | 30.5% | 15,450 | 46.3% | 1,466 | 32.7% |
| Age | ||||||||
| <25 years | 123 | 62.6% | * | * | 123 | 62.6% | * | * |
| 25 to 34 years | 1,359 | 59.6% | 86 | 39.5% | 1,574 | 59.8% | 127 | 41.7% |
| 35 to 44 years | 2,507 | 47.0% | 243 | 30.9% | 2,938 | 48.2% | 292 | 36.0% |
| 45 to 54 years | 3,187 | 38.5% | 282 | 29.1% | 3,593 | 42.6% | 347 | 25.6% |
| 55 to 64 years | 3,965 | 32.9% | 340 | 27.4% | 4,339 | 35.2% | 391 | 29.4% |
| 65+ years | 1,852 | 19.3% | 177 | 16.4% | 2,146 | 22.9% | 227 | 19.8% |
| Gender | ||||||||
| Female | 11,824 | 43.3% | 1,088 | 30.3% | 13,589 | 45.3% | 1,342 | 31.6% |
| Male | 1,254 | 49.9% | 53 | 33.2% | 1,407 | 52.7% | 76 | 40.9% |
| Gender non-binary/non-conforming, Genderqueer, Transgender | 27 | 75.6% | * | * | * | * | * | * |
| Prefer not to respond | 211 | 56.7% | * | * | 260 | 63.1% | 28 | 51.2% |
| Race | ||||||||
| White | 11,940 | 45.4% | 846 | 33.2% | 13,592 | 47.3% | 1,032 | 36.2% |
| Black | 707 | 27.8% | 248 | 23.7% | 937 | 34.7% | 73 | 21.6% |
| American Indian | 174 | 50.4% | 29 | 57.4% | 224 | 59.0% | 30 | 37.9% |
| Asian/ Pacific Islander | 390 | 38.8% | * | * | 445 | 41.8% | * | * |
| Other | 330 | 49.5% | 49 | 40.2% | 387 | 51.8% | 57 | 46.5% |
| Ethnicity | ||||||||
| Hispanic or Latinx | 319 | 45.9% | 36 | 40.3% | 365 | 52.4% | 44 | 43.9% |
| Middle Eastern | 168 | 40.5% | * | * | 206 | 45.9% | * | * |
| Employment Region | ||||||||
| Upper Peninsula | 461 | 45.5% | 88 | 37.7% | 503 | 43.4% | 115 | 35.2% |
| Northwest LP | 530 | 51.1% | 42 | 33.7% | 577 | 45.0% | 36 | 40.1% |
| Northeast LP | 246 | 38.8% | 27 | 29.0% | 264 | 47.1% | * | * |
| West/West Central | 1,814 | 52.5% | 174 | 31.3% | 2,090 | 50.5% | 206 | 39.7% |
| East Central | 749 | 45.9% | 72 | 27.1% | 834 | 49.3% | 112 | 26.5% |
| East | 861 | 46.0% | 85 | 30.0% | 982 | 49.8% | 102 | 30.9% |
| South Central | 606 | 46.5% | 35 | 38.7% | 631 | 50.8% | 46 | 43.9% |
| Southwest | 842 | 47.1% | 76 | 40.0% | 999 | 54.8% | 106 | 40.9% |
| Southeast | 1,629 | 41.2% | 127 | 32.8% | 1,768 | 47.6% | 141 | 36.5% |
| Detroit Metro | 3,795 | 42.8% | 359 | 25.2% | 4,225 | 45.7% | 446 | 27.4% |
| Outside of MI | 1,685 | 34.0% | 71 | 33.5% | 2,046 | 33.7% | 71 | 25.3% |
| Unknown MI Region | 150 | 46.1% | * | * | 531 | 45.6% | 47 | 41.4% |
| Region of Residence | ||||||||
| Upper Peninsula | 446 | 45.5% | 81 | 39.0% | 482 | 42.3% | 109 | 34.7% |
| Northwest LP | 554 | 50.0% | 39 | 30.7% | 580 | 46.0% | 43 | 40.3% |
| Northeast LP | 271 | 38.6% | * | * | 291 | 44.7% | * | * |
| West/West Central | 1,889 | 51.5% | 173 | 31.3% | 2,157 | 49.8% | 212 | 38.4% |
| East Central | 709 | 46.9% | 73 | 26.6% | 800 | 49.8% | 101 | 27.4% |
| East | 1,032 | 46.2% | 97 | 29.6% | 1,220 | 49.5% | 122 | 29.3% |
| South Central | 590 | 49.3% | 33 | 45.6% | 613 | 53.7% | 41 | 55.0% |
| Southwest | 822 | 46.0% | 81 | 40.8% | 996 | 53.5% | 107 | 43.2% |
| Southeast | 1,358 | 40.5% | 116 | 32.1% | 1,491 | 47.2% | 129 | 30.7% |
| Detroit Metro | 3,849 | 42.6% | 353 | 24.0% | 4,303 | 45.6% | 447 | 28.0% |
| Non-Michigan Residence | 1,569 | 33.2% | 70 | 36.0% | 1,984 | 33.6% | 63 | 25.2% |
| Unknown MI Region | 334 | 54.6% | 29 | 44.1% | 533 | 51.9% | 51 | 50.1% |
a The gender options have been combined for the purpose of increasing the likelihood of having enough responses to be included in the analysis. Should the number be high enough, we will revisit separating out options in future surveys.
b Respondents were instructed to mark all races that apply.
Ϯ The n represents the total number of nurses who responded to the workplace violence section of the survey
¥ Estimates reflect the weighted percentage of nurses who said “Yes” to experiencing workplace violence
-Data were not available/response was not an option.
* Data are suppressed if count is less than 10 or sample population was less than 20.
Nurses Who Experienced Workplace Violence by Care Setting
| Setting | RN = 20,141 | LPN = 2,120 | ||||
|---|---|---|---|---|---|---|
| n | Estimate | 95% CI | n | Estimate | 95% CI | |
| Emergent and Urgent Care | 1,675 | 72.5% | (70.3%, 74.6%) | 51 | 45.8% | (32.9%, 59.3%) |
| Acute Care | 7,152 | 59.7% | (58.6%, 60.8%) | 184 | 37.3% | (30.6%, 44.5%) |
| Corrections | 167 | 52.6% | (45.1%, 60.0%) | 52 | 43.3% | (30.8%, 56.8%) |
| Long-term care | 1,021 | 45.9% | (42.9%, 49.0%) | 674 | 35.7% | (32.2%, 39.4%) |
| School of Nursing | 727 | 41.5% | (38.0%, 45.1%) | * | * | * |
| Community Health | 939 | 40.0% | (36.9%, 43.2%) | 143 | 46.8% | (38.8%, 55.0%) |
| Ambulatory Care | 3,806 | 37.9% | (36.4%, 39.5%) | 298 | 27.5% | (22.7%, 32.8%) |
| Public Health | 571 | 36.5% | (32.7%, 40.5%) | 42 | 32.5% | (20.3%, 47.6%) |
| Other Community Based Health Care | 643 | 36.2% | (32.6%, 40.0%) | 220 | 35.1% | (29.1%, 41.6%) |
| School Health | 272 | 34.1% | (28.7%, 39.9%) | * | * | * |
| Mobile and Home Care | 954 | 32.2% | (29.3%, 35.2%) | 256 | 24.3% | (19.5%, 29.9%) |
| Non Clinical | 1,727 | 21.9% | (20.0%, 23.9%) | 112 | 27.3% | (19.9%, 36.2%) |
| Other Community Based Care | 487 | 20.9% | (17.5%, 24.7%) | * | * | * |
a Respondents were instructed to mark all that apply.
Ϯ The n represents the total number of nurses who responded to the workplace violence section of the survey
¥ Estimates reflect the weighted percentage of nurses who said “Yes” to experiencing workplace violence
* Data are suppressed if count is less than 10 or sample population was less than 20.
Nurses Who Experienced Workplace Violence by Position
| Position | RN = 20,637 | LPN = 1,948 | ||||
|---|---|---|---|---|---|---|
| n | Estimate | 95% CI | n | Estimate | 95% CI | |
| Travel Nurse | 481 | 62.7% | (58.3%, 66.9%) | 52 | 44.6% | (31.9%, 58.0%) |
| Staff Nurse | 8,446 | 56.2% | (55.1%, 57.3%) | 1,100 | 35.3% | (32.5%, 38.2%) |
| Military Health Services | 89 | 49.7% | (39.5%, 59.9%) | * | * | * |
| Managerial | 1,466 | 48.3% | (45.7%, 50.9%) | 167 | 33.9% | (27.2%, 41.4%) |
| Faculty | 742 | 42.7% | (39.2%, 46.3%) | * | * | * |
| Education/ Research/ Consulting | 1,586 | 39.7% | (37.3%, 42.1%) | 55 | 24.1% | (14.7%, 36.8%) |
| Patient Educator and other | 1,427 | 38.2% | (35.7%, 40.7%) | 160 | 24.6% | (18.6%, 31.8%) |
| APRN or Anesthetist | 1,575 | 36.9% | (34.6%, 39.3%) | * | * | * |
| Telehealth | 735 | 35.2% | (31.8%, 38.7%) | 62 | 33.2% | (22.8%, 45.6%) |
| Executives | 878 | 33.2% | (30.2%, 36.4%) | 57 | 37.9% | (26.4%, 50.9%) |
| School Nurse | 244 | 30.1% | (24.7%, 36.1%) | * | * | * |
| Other Health Services | 2,896 | 29.1% | (27.5%, 30.8%) | 197 | 23.9% | (18.5%, 30.3%) |
| Other health non-related | 72 | 26.6% | (17.8%, 37.8%) | * | * | * |
a Respondents were instructed to mark all that apply.
Ϯ The n represents the total number of nurses who responded to the workplace violence section of the survey
¥ Estimates reflect the weighted percentage of nurses who said “Yes” to experiencing workplace violence
* Data are suppressed if count is less than 10 or sample population was less than 20.
Nurses Who Experienced Workplace Violence by Specialty
| Specialty | RN = 28,518 | LPN = 3,343 | ||||
|---|---|---|---|---|---|---|
| n | Estimate | 95% CI | n | Estimate | 95% CI | |
| Behavioral Health | 1,095 | 67.9% | (65.1%, 70.6%) | 145 | 40.8% | (33.1%, 48.9%) |
| Critical Care | 2,304 | 66.6% | (64.6%, 68.5%) | 59 | 36.6% | (25.5%, 49.4%) |
| Medical Surgical & Wound Care | 2,628 | 63.9% | (62.0%, 65.7%) | 363 | 39.9% | (35.0%, 45.0%) |
| Specialty Care | 2,279 | 59.2% | (57.2%, 61.2%) | 105 | 35.3% | (26.8%, 44.8%) |
| Phlebotomy Testing & Diagnostics | 460 | 58.9% | (54.3%, 63.3%) | 76 | 43.2% | (32.7%, 54.4%) |
| Adult Health | 3,526 | 55.8% | (54.2%, 57.4%) | 566 | 32.9% | (29.2%, 36.9%) |
| Geriatric Care | 1,722 | 55.4% | (53.0%, 57.7%) | 575 | 38.3% | (34.4%, 42.3%) |
| Rehabilitation | 709 | 55.3% | (51.6%, 58.9%) | 277 | 40.8% | (35.2%, 46.7%) |
| Hospice | 819 | 55.2% | (51.8%, 58.6%) | 177 | 52.5% | (45.2%, 59.7%) |
| Occupational Health & Transitions of Care | 801 | 48.3% | (44.9%, 51.8%) | 92 | 34.8% | (25.9%, 45.0%) |
| Child & Family Health | 1,982 | 46.0% | (43.8%, 48.2%) | 277 | 26.4% | (21.6%, 31.9%) |
| Dialysis Nurse | 293 | 44.2% | (38.6%, 49.9%) | * | * | * |
| Surgical Services | 1,765 | 43.8% | (41.5%, 46.1%) | * | * | * |
| Women & Infant Health | 1,344 | 42.3% | (39.7%, 45.0%) | 48 | 32.5% | (21.0%, 46.6%) |
| Community Care | 756 | 41.4% | (37.9%, 44.9%) | 89 | 27.4% | (19.2%, 37.5%) |
| Anesthesia | 624 | 41.4% | (37.6%, 45.3%) | * | * | * |
| Other Specialties | 2,201 | 40.8% | (38.8%, 42.9%) | 265 | 28.9% | (23.8%, 34.6%) |
| Academia | 619 | 39.1% | (35.3%, 43.0%) | 25 | 45.4% | (27.8%, 64.2%) |
| Care Management | 2,222 | 31.6% | (29.7%, 33.6%) | 135 | 20.5% | (14.6%, 28.1%) |
| Other Non-clinical Specialties | 369 | 22.0% | (18.1%, 26.5%) | * | * | * |
a Respondents were instructed to mark all that apply.
Ϯ The n represents the total number of nurses who responded to the workplace violence section of the survey
¥ Estimates reflect the weighted percentage of nurses who said “Yes” to experiencing workplace violence
* Data are suppressed if count is less than 10 or sample population was less than 20.
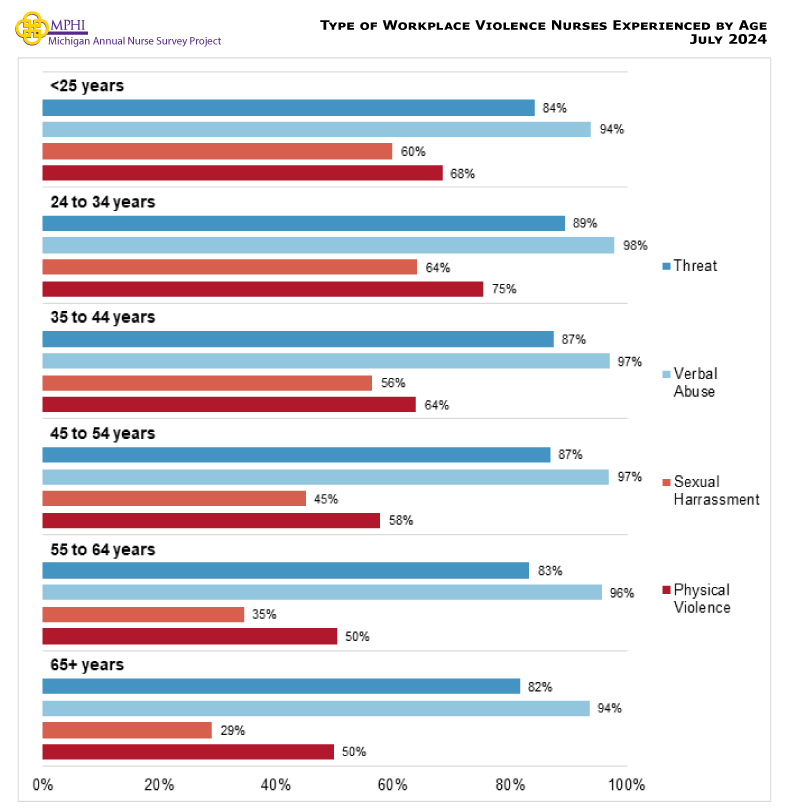
Type of Workplace Violence Nurses Experienced by Age
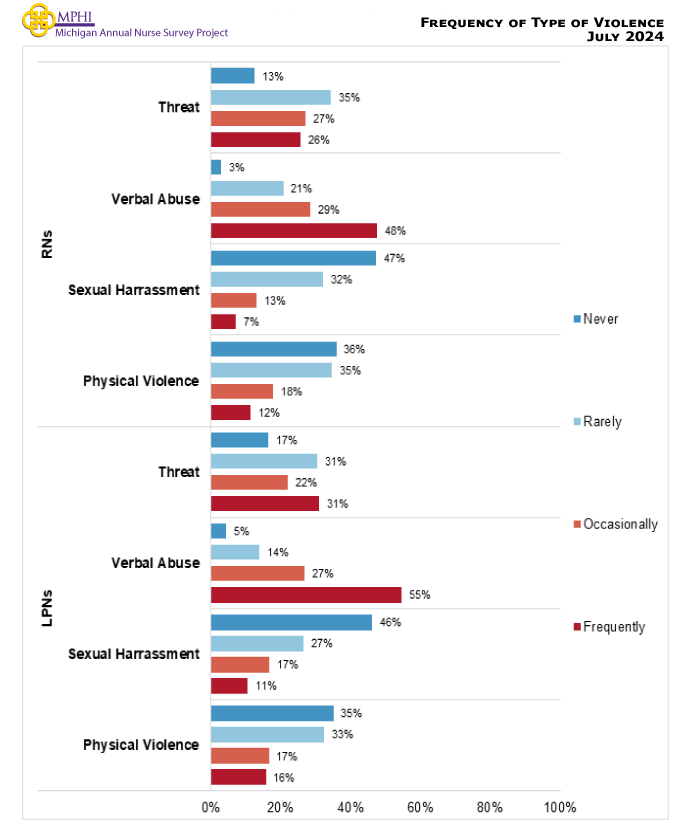
Frequency of Violence by Type
Perpetrator of Workplace Violence
| Perpetrator of WPV | RN = 6,273 | LPN = 418 | ||
|---|---|---|---|---|
| Estimate | 95% CI | Estimate | 95% CI | |
| Patient | 90.1% | (89.3%, 90.8%) | 91.2% | (88.1%, 93.6%) |
| Family or Friend of Patient | 63.1% | (61.9%, 64.3%) | 51.7% | (46.9%, 56.5%) |
| Supervisor | 11.0% | (10.2%, 11.8%) | 23.1% | (19.3%, 27.4%) |
| Physician | 18.7% | (17.8%, 19.7%) | 9.5% | (7.0%, 12.7%) |
| Peer | 19.8% | (18.8%, 20.8%) | 25.4% | (21.5%, 29.8%) |
| Other | 2.6% | (2.2%, 3.0%) | 4.4% | (2.8%, 6.8%) |
a In previous years, respondents noted issues with survey programming in which it only allowed them to pick one response option
Perpetrator & Type of Violence Experienced by Nurses
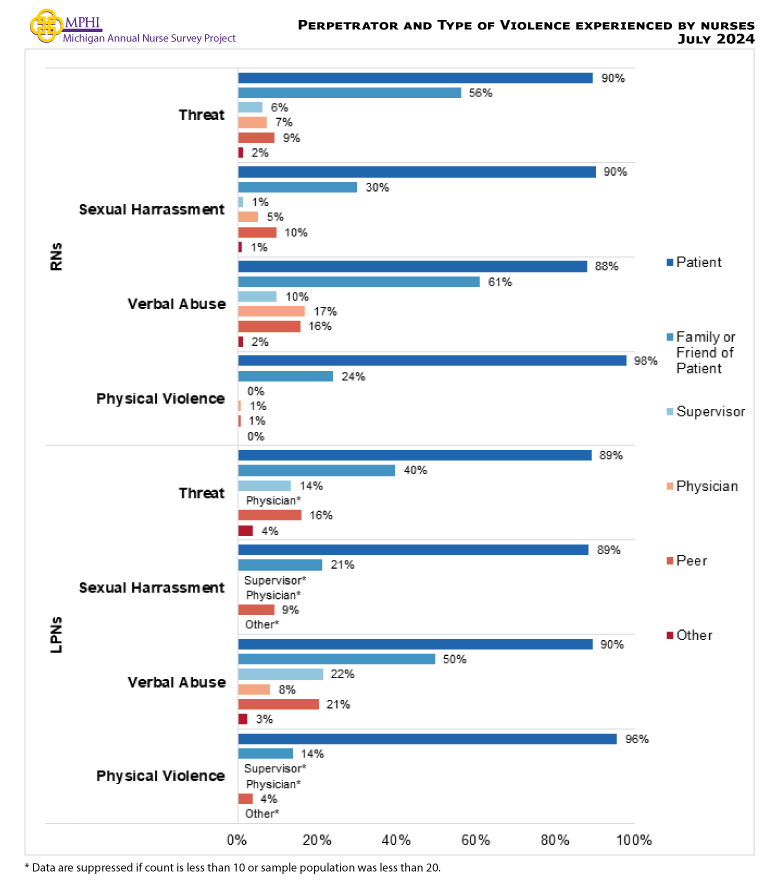
a In previous years, respondents note about issues with survey programming in which it only allowed them to pick one response option.
* Data are suppressed if count is less than 10 or sample population was less than 20.
Reporting of Workplace Violence
Reporting of Workplace Violence Incidence
| Reporting of Workplace Violence | RN = 6,295 | LPN = 421 | ||
|---|---|---|---|---|
| Estimate | 95% CI | Estimate | 95% CI | |
| Knowledge of Organizational Process for Reporting Workplace Violence | ||||
| Yes | 72.0% | (70.9%, 73.1%) | 58.8% | (54.0%, 63.4%) |
| No | 10.6% | (9.9%, 11.4%) | 24.7% | (20.8%, 29.0%) |
| Don’t Know | 17.4% | (16.5%, 18.4%) | 16.5% | (13.3%, 20.3%) |
| Reported Workplace Violence Using Organizational Process | ||||
| Yes | 59.1% | (57.7%, 60.5%) | 70.3% | (64.4%, 75.6%) |
Knowledge of Reporting Process of Workplace Violence Incidence
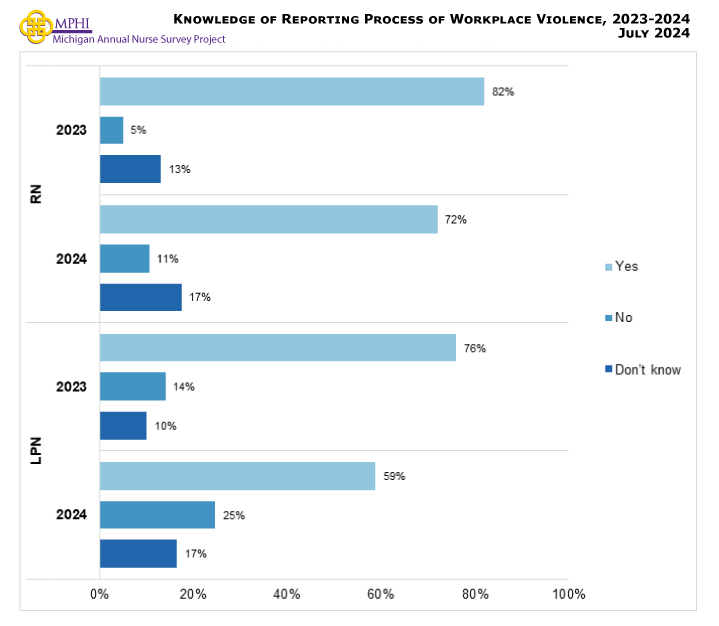
Knowledge of Organizational Reporting Process & Use of Reporting by Age
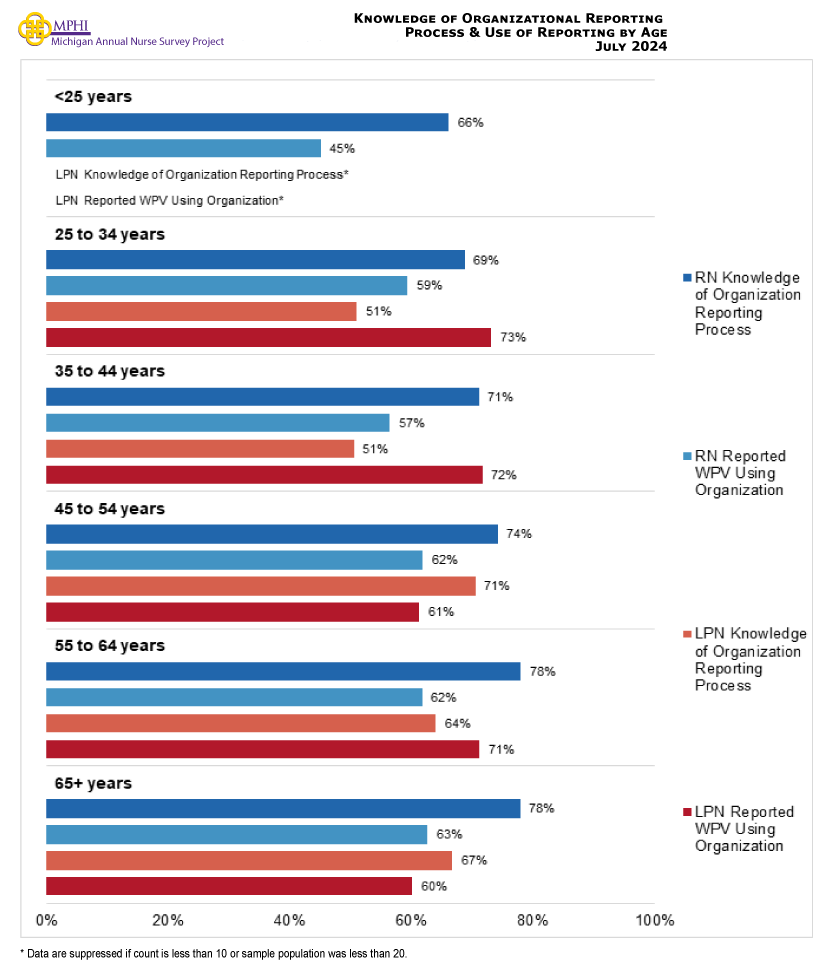
* Data are suppressed if count is less than 10 or sample population was less than 20.
Methods of Reporting Workplace Violence
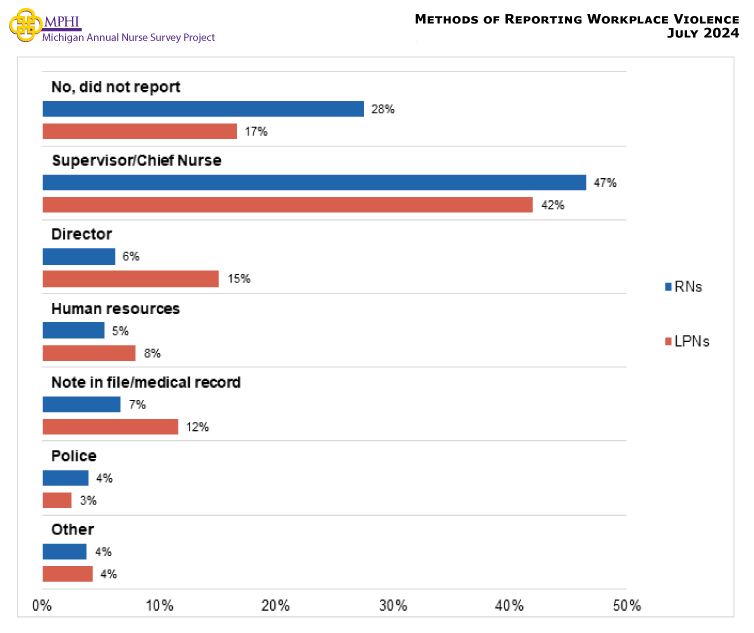
* Data are suppressed if count is less than 10 or sample population was less than 20.
Appendices Tables
Movement within the Nursing Workforce in Michigan
Movement of Nurses Among RNs Living in Michigan
| Aged 64 years or younger | ||||||||
|---|---|---|---|---|---|---|---|---|
| Living in MI in Baseline Year | 2020 | 2021 | 2022 | 2023 | ||||
| # | % | # | % | # | % | # | % | |
| Nurses in Baseline Year | 119,903 | – | 117,955 | – | 115,448 | – | 119,217 | – |
| In Following Year: | 2021 | 2022 | 2023 | 2024 | ||||
| Same Region | 115,191 | 96.1 | 106,947 | 90.7 | 112,042 | 97.0 | 114,917 | 96.4 |
| Different Region | 1,494 | 1.2 | 4,520 | 3.8 | 1,365 | 1.2 | 1,801 | 1.5 |
| Outside Michigan | 632 | 0.5 | 3,628 | 3.1 | 559 | 0.5 | 681 | 0.6 |
| Not Found | 2,586 | 2.2 | 2,860 | 2.4 | 1,482 | 1.3 | 1,818 | 1.5 |
| Aged 34 years or younger | ||||||||
| Living in MI in Baseline Year | 2020 | 2021 | 2022 | 2023 | ||||
| # | % | # | % | # | % | # | % | |
| Nurses in Baseline Year | 33,188 | – | 31,359 | – | 30,921 | – | 32,412 | – |
| In Following Year: | 2021 | 2022 | 2023 | 2024 | ||||
| Same Region | 31,810 | 95.8 | 27,563 | 87.9 | 29,731 | 96.2 | 30,941 | 95.5 |
| Different Region | 735 | 2.2 | 1,832 | 5.8 | 629 | 2.0 | 888 | 2.7 |
| Outside Michigan | 198 | 0.6 | 1,283 | 4.1 | 206 | 0.7 | 227 | 0.7 |
| Not Found | 445 | 1.3 | 681 | 2.2 | 355 | 1.1 | 356 | 1.1 |
| Aged 35 to 64 years | ||||||||
| Living in MI in Baseline Year | 2020 | 2021 | 2022 | 2023 | ||||
| # | % | # | % | # | % | # | % | |
| Nurses in Baseline Year | 86,715 | – | 86,596 | – | 84,527 | – | 85,689 | – |
| In Following Year: | 2021 | 2022 | 2023 | 2024 | ||||
| Same Region | 83,381 | 96.2 | 79,384 | 91.7 | 82,311 | 97.4 | 84,171 | 98.2 |
| Different Region | 759 | 0.9 | 2,688 | 3.1 | 736 | 0.9 | 570 | 0.7 |
| Outside Michigan | 434 | 0.5 | 2,345 | 2.7 | 353 | 0.4 | 374 | 0.4 |
| Not Found | 2,141 | 2.5 | 2,179 | 2.5 | 1,127 | 1.3 | 574 | 0.7 |
Movement of Nurses Among RNs Living Outside Michigan
| Aged 64 years or younger | ||||||||
|---|---|---|---|---|---|---|---|---|
| Living Outside MI in Baseline Year | 2020 | 2021 | 2022 | 2023 | ||||
| # | % | # | % | # | % | # | % | |
| Nurses in Baseline Year | 21,119 | – | 22,727 | – | 30,643 | – | 30,679 | – |
| In Following Year: | 2021 | 2022 | 2023 | 2024 | ||||
| Outside Michigan | 18,727 | 88.7 | 19,192 | 84.4 | 25,081 | 81.8 | 25,218 | 82.2 |
| Moved to Michigan | 434 | 2.1 | 963 | 4.2 | 2,927 | 9.6 | 1,205 | 3.9 |
| Unknown | 1,958 | 9.3 | 2,572 | 11.3 | 2,635 | 8.6 | 4,256 | 13.9 |
| Aged 34 years or younger | ||||||||
| Living Outside MI in Baseline Year | 2020 | 2021 | 2022 | 2023 | ||||
| # | % | # | % | # | % | # | % | |
| Nurses in Baseline Year | 4,483 | – | 4,709 | – | 7,453 | – | 3,677 | – |
| In Following Year: | 2021 | 2022 | 2023 | 2024 | ||||
| Outside Michigan | 3,892 | 86.8 | 3,819 | 81.1 | 5,817 | 78.1 | 3,182 | 86.5 |
| Moved to Michigan | 181 | 4.0 | 419 | 8.9 | 1,044 | 14.0 | 184 | 5.0 |
| Unknown | 410 | 9.1 | 471 | 10.0 | 592 | 7.9 | 311 | 8.5 |
| Aged 35 to 64 years | ||||||||
| Living in Outside MI in Baseline Year | 2020 | 2021 | 2022 | 2023 | ||||
| # | % | # | % | # | % | # | % | |
| Nurses in Baseline Year | 16,636 | – | 18,018 | – | 23,190 | – | 23,244 | – |
| In Following Year: | 2021 | 2022 | 2023 | 2024 | ||||
| Outside Michigan | 14,835 | 89.2 | 15,373 | 85.3 | 19,264 | 83.1 | 19,462 | 83.7 |
| Moved to Michigan | 253 | 1.5 | 544 | 3.0 | 1,883 | 8.1 | 556 | 2.4 |
| Unknown | 1,548 | 9.3 | 2,101 | 11.7 | 2,043 | 8.8 | 3,226 | 13.9 |
Movement of Nurses Among RNs Living in the Upper Peninsula of Michigan
| Aged 64 years or younger | ||||||||
|---|---|---|---|---|---|---|---|---|
| Living in UP in Baseline Year | 2020 | 2021 | 2022 | 2023 | ||||
| # | % | # | % | # | % | # | % | |
| Nurses in Baseline Year | 3,749 | – | 3,685 | – | 3,559 | – | 3,679 | – |
| In Following Year: | 2021 | 2022 | 2023 | 2024 | ||||
| Same Region | 3,579 | 95.5 | 3,326 | 90.3 | 3,430 | 96.4 | 3,521 | 95.7 |
| Different Region | 24 | 0.6 | 74 | 2.0 | 30 | 0.8 | 34 | 0.9 |
| Outside Michigan | 25 | 0.7 | 131 | 3.6 | 22 | 0.6 | 30 | 0.8 |
| Not Found | 121 | 3.2 | 154 | 4.2 | 77 | 2.2 | 94 | 2.6 |
| Aged 34 years or younger | ||||||||
| Living in UP in Baseline Year | 2020 | 2021 | 2022 | 2023 | ||||
| # | % | # | % | # | % | # | % | |
| Nurses in Baseline Year | 1,008 | – | 948 | – | 922 | – | 960 | – |
| In Following Year: | 2021 | 2022 | 2023 | 2024 | ||||
| Same Region | 956 | 94.8 | 834 | 88.0 | 886 | 96.1 | 918 | 95.6 |
| Different Region | 17 | 1.7 | 31 | 3.3 | 11 | 1.2 | 18 | 1.9 |
| Outside Michigan | * | * | 46 | 4.9 | * | * | 13 | 1.4 |
| Not Found | 29 | 2.9 | 37 | 3.9 | 17 | 1.8 | 11 | 1.1 |
| Aged 35 to 64 years | ||||||||
| Living in UP in Baseline Year | 2020 | 2021 | 2022 | 2023 | ||||
| # | % | # | % | # | % | # | % | |
| Nurses in Baseline Year | 2,741 | – | 2,737 | – | 2,637 | – | 2,719 | – |
| In Following Year: | 2021 | 2022 | 2023 | 2024 | ||||
| Same Region | 83,381 | 96.2 | 79,384 | 91.7 | 82,311 | 97.4 | 84,171 | 98.2 |
| Different Region | 759 | 0.9 | 2,688 | 3.1 | 736 | 0.9 | 570 | 0.7 |
| Outside Michigan | 434 | 0.5 | 2,345 | 2.7 | 353 | 0.4 | 374 | 0.4 |
| Not Found | 2,141 | 2.5 | 2,179 | 2.5 | 1,127 | 1.3 | 574 | 0.7 |
* Data are suppressed if count is less than 10 or sample population was less than 20.
Movement of Nurses Among RNs Living in the Northwest Lower Peninsula of Michigan
| Aged 64 years or younger | ||||||||
|---|---|---|---|---|---|---|---|---|
| Living in NW LP in Baseline Year | 2020 | 2021 | 2022 | 2023 | ||||
| # | % | # | % | # | % | # | % | |
| Nurses in Baseline Year | 4,212 | – | 4,088 | – | 4,019 | – | 4,139 | – |
| In Following Year: | 2021 | 2022 | 2023 | 2024 | ||||
| Same Region | 4,019 | 95.4 | 3,690 | 90.3 | 3,901 | 97.1 | 3,967 | 95.8 |
| Different Region | 68 | 1.6 | 156 | 3.8 | 52 | 1.3 | 81 | 2.0 |
| Outside Michigan | 23 | 0.5 | 115 | 2.8 | 14 | 0.3 | 20 | 0.5 |
| Not Found | 102 | 2.4 | 127 | 3.1 | 52 | 1.3 | 71 | 1.7 |
| Aged 34 years or younger | ||||||||
| Living in NW LP in Baseline Year | 2020 | 2021 | 2022 | 2023 | ||||
| # | % | # | % | # | % | # | % | |
| Nurses in Baseline Year | 980 | – | 880 | – | 883 | – | 927 | – |
| In Following Year: | 2021 | 2022 | 2023 | 2024 | ||||
| Same Region | 929 | 94.8 | 755 | 85.8 | 846 | 95.8 | 876 | 94.5 |
| Different Region | 32 | 3.3 | 66 | 7.5 | 23 | 2.6 | 35 | 3.8 |
| Outside Michigan | * | * | 33 | 3.8 | * | * | * | * |
| Not Found | 14 | 1.4 | 26 | 3.0 | * | * | 11 | 1.2 |
| Aged 35 to 64 years | ||||||||
| Living in NW LP in Baseline Year | 2020 | 2021 | 2022 | 2023 | ||||
| # | % | # | % | # | % | # | % | |
| Nurses in Baseline Year | 3,232 | – | 3,208 | – | 3,136 | – | 3,212 | – |
| In Following Year: | 2021 | 2022 | 2023 | 2024 | ||||
| Same Region | 3,090 | 95.6 | 2,935 | 91.5 | 3,055 | 97.4 | 3,091 | 96.2 |
| Different Region | 36 | 1.1 | 90 | 2.8 | 29 | 0.9 | 46 | 1.4 |
| Outside Michigan | 18 | 0.6 | 82 | 2.6 | * | * | 15 | 0.5 |
| Not Found | 88 | 2.7 | 101 | 3.1 | 44 | 1.4 | 60 | 1.9 |
* Data are suppressed if count is less than 10 or sample population was less than 20.
Movement of Nurses Among RNs Living in the Northeast Lower Peninsula of Michigan
| Aged 64 years or younger | ||||||||
|---|---|---|---|---|---|---|---|---|
| Living in NE LP in Baseline Year | 2020 | 2021 | 2022 | 2023 | ||||
| # | % | # | % | # | % | # | % | |
| Nurses in Baseline Year | 2,143 | – | 2,107 | – | 2,118 | – | 2,174 | – |
| In Following Year: | 2021 | 2022 | 2023 | 2024 | ||||
| Same Region | 2,032 | 94.8 | 1,839 | 87.3 | 2,027 | 95.7 | 2,064 | 94.9 |
| Different Region | 46 | 2.1 | 136 | 6.5 | 56 | 2.6 | 52 | 2.4 |
| Outside Michigan | 14 | 0.7 | 70 | 3.3 | * | * | 11 | 0.5 |
| Not Found | 51 | 2.4 | 62 | 2.9 | 27 | 1.3 | 47 | 2.2 |
| Aged 34 years or younger | ||||||||
| Living in NE LP in Baseline Year | 2020 | 2021 | 2022 | 2023 | ||||
| # | % | # | % | # | % | # | % | |
| Nurses in Baseline Year | 488 | – | 479 | – | 475 | – | 471 | – |
| In Following Year: | 2021 | 2022 | 2023 | 2024 | ||||
| Same Region | 461 | 94.5 | 398 | 83.1 | 448 | 94.3 | 437 | 92.8 |
| Different Region | 20 | 4.1 | 55 | 11.5 | 21 | 4.4 | 23 | 4.9 |
| Outside Michigan | * | * | 19 | 4.0 | * | * | * | * |
| Not Found | * | * | * | * | * | * | * | * |
| Aged 35 to 64 years | ||||||||
| Living in NE LP in Baseline Year | 2020 | 2021 | 2022 | 2023 | ||||
| # | % | # | % | # | % | # | % | |
| Nurses in Baseline Year | 1,655 | – | 1,628 | – | 1,643 | – | 1,703 | – |
| In Following Year: | 2021 | 2022 | 2023 | 2024 | ||||
| Same Region | 1,571 | 94.9 | 1,441 | 88.5 | 1,579 | 96.1 | 1,627 | 95.5 |
| Different Region | 26 | 1.6 | 81 | 5.0 | 35 | 2.1 | 29 | 1.7 |
| Outside Michigan | 13 | 0.8 | 51 | 3.1 | * | * | * | * |
| Not Found | 45 | 2.7 | 55 | 3.4 | 24 | 1.5 | 39 | 2.3 |
* Data are suppressed if count is less than 10 or sample population was less than 20.
Movement of Nurses Among RNs Living in West Michigan
| Aged 64 years or younger | ||||||||
|---|---|---|---|---|---|---|---|---|
| Living in West MI in Baseline Year | 2020 | 2021 | 2022 | 2023 | ||||
| # | % | # | % | # | % | # | % | |
| Nurses in Baseline Year | 18,261 | – | 17,997 | – | 17,738 | – | 18,481 | – |
| In Following Year: | 2021 | 2022 | 2023 | 2024 | ||||
| Same Region | 17,671 | 96.8 | 16,634 | 92.4 | 17,278 | 97.4 | 17,948 | 97.1 |
| Different Region | 155 | 0.8 | 419 | 2.3 | 152 | 0.9 | 181 | 1.0 |
| Outside Michigan | 89 | 0.5 | 567 | 3.2 | 68 | 0.4 | 81 | 0.4 |
| Not Found | 346 | 1.9 | 377 | 2.1 | 240 | 1.4 | 271 | 1.5 |
| Aged 34 years or younger | ||||||||
| Living in West MI in Baseline Year | 2020 | 2021 | 2022 | 2023 | ||||
| # | % | # | % | # | % | # | % | |
| Nurses in Baseline Year | 5,622 | – | 5,289 | – | 5,220 | – | 5,539 | – |
| In Following Year: | 2021 | 2022 | 2023 | 2024 | ||||
| Same Region | 5,442 | 96.8 | 4,754 | 89.9 | 5,042 | 96.6 | 5,368 | 96.9 |
| Different Region | 72 | 1.3 | 212 | 4.0 | 82 | 1.6 | 88 | 1.6 |
| Outside Michigan | 39 | 0.7 | 222 | 4.2 | 32 | 0.6 | 25 | 0.5 |
| Not Found | 69 | 1.2 | 101 | 1.9 | 64 | 1.2 | 58 | 1.0 |
| Aged 35 to 64 years | ||||||||
| Living in West MI in Baseline Year | 2020 | 2021 | 2022 | 2023 | ||||
| # | % | # | % | # | % | # | % | |
| Nurses in Baseline Year | 12,639 | – | 12,708 | – | 12,518 | – | 12,942 | – |
| In Following Year: | 2021 | 2022 | 2023 | 2024 | ||||
| Same Region | 12,229 | 96.8 | 11,880 | 93.5 | 12,236 | 97.7 | 12,580 | 97.2 |
| Different Region | 83 | 0.7 | 207 | 1.6 | 70 | 0.6 | 93 | 0.7 |
| Outside Michigan | 50 | 0.4 | 345 | 2.7 | 36 | 0.3 | 56 | 0.4 |
| Not Found | 277 | 2.2 | 276 | 2.2 | 176 | 1.4 | 213 | 1.6 |
Movement of Nurses Among RNs Living in East Central Michigan
| Aged 64 years or younger | ||||||||
|---|---|---|---|---|---|---|---|---|
| Living in East Central MI in Baseline Year | 2020 | 2021 | 2022 | 2023 | ||||
| # | % | # | % | # | % | # | % | |
| Nurses in Baseline Year | 7,063 | – | 7,010 | – | 6,896 | – | 7,122 | – |
| In Following Year: | 2021 | 2022 | 2023 | 2024 | ||||
| Same Region | 6,798 | 96.2 | 6,420 | 91.6 | 6,723 | 97.5 | 6,864 | 96.4 |
| Different Region | 89 | 1.3 | 273 | 3.9 | 86 | 1.2 | 130 | 1.8 |
| Outside Michigan | 35 | 0.5 | 180 | 2.6 | 21 | 0.3 | 31 | 0.4 |
| Not Found | 141 | 2.0 | 137 | 2.0 | 66 | 1.0 | 97 | 1.4 |
| Aged 34 years or younger | ||||||||
| Living in East Central MI in Baseline Year | 2020 | 2021 | 2022 | 2023 | ||||
| # | % | # | % | # | % | # | % | |
| Nurses in Baseline Year | 1,908 | – | 1,768 | – | 1,707 | – | 1,759 | – |
| In Following Year: | 2021 | 2022 | 2023 | 2024 | ||||
| Same Region | 1,832 | 96.0 | 1,566 | 88.6 | 1,641 | 96.1 | 1,665 | 94.7 |
| Different Region | 45 | 2.4 | 127 | 7.2 | 47 | 2.8 | 72 | 4.1 |
| Outside Michigan | 12 | 0.6 | 58 | 3.3 | * | * | 10 | 0.6 |
| Not Found | 19 | 1.0 | 17 | 1.0 | 12 | 0.7 | 12 | 0.7 |
| Aged 35 to 64 years | ||||||||
| Living in East Central MI in Baseline Year | 2020 | 2021 | 2022 | 2023 | ||||
| # | % | # | % | # | % | # | % | |
| Nurses in Baseline Year | 5,155 | – | 5,242 | – | 5,189 | – | 5,363 | – |
| In Following Year: | 2021 | 2022 | 2023 | 2024 | ||||
| Same Region | 4,966 | 96.3 | 4,854 | 92.6 | 5,082 | 97.9 | 5,199 | 96.9 |
| Different Region | 44 | 0.9 | 146 | 2.8 | 39 | 0.8 | 58 | 1.1 |
| Outside Michigan | 23 | 0.4 | 122 | 2.3 | 14 | 0.3 | 21 | 0.4 |
| Not Found | 122 | 2.4 | 120 | 2.3 | 54 | 1.0 | 85 | 1.6 |
* Data are suppressed if count is less than 10 or sample population was less than 20.
Movement of Nurses Among RNs Living in East Michigan
| Aged 64 years or younger | ||||||||
|---|---|---|---|---|---|---|---|---|
| Living in Eastern MI in Baseline Year | 2020 | 2021 | 2022 | 2023 | ||||
| # | % | # | % | # | % | # | % | |
| Nurses in Baseline Year | 10,945 | – | 10,774 | – | 10,318 | – | 10,694 | – |
| In Following Year: | 2021 | 2022 | 2023 | 2024 | ||||
| Same Region | 10,469 | 95.7 | 9,451 | 87.7 | 10,017 | 97.1 | 10,260 | 95.9 |
| Different Region | 212 | 1.9 | 820 | 7.6 | 146 | 1.4 | 249 | 2.3 |
| Outside Michigan | 37 | 0.3 | 285 | 2.6 | 47 | 0.5 | 48 | 0.4 |
| Not Found | 227 | 2.1 | 218 | 2.0 | 108 | 1.0 | 137 | 1.3 |
| Aged 34 years or younger | ||||||||
| Living in Eastern MI in Baseline Year | 2020 | 2021 | 2022 | 2023 | ||||
| # | % | # | % | # | % | # | % | |
| Nurses in Baseline Year | 2,797 | – | 2,656 | – | 2,646 | – | 2,748 | – |
| In Following Year: | 2021 | 2022 | 2023 | 2024 | ||||
| Same Region | 2,659 | 95.1 | 2,248 | 84.6 | 2,534 | 95.8 | 2,598 | 94.5 |
| Different Region | 106 | 3.8 | 292 | 11.0 | 70 | 2.6 | 129 | 4.7 |
| Outside Michigan | 14 | 0.5 | 68 | 2.6 | 23 | 0.9 | * | * |
| Not Found | 18 | 0.6 | 48 | 1.8 | 19 | 0.7 | 14 | 0.5 |
| Aged 35 to 64 years | ||||||||
| Living in Eastern MI in Baseline Year | 2020 | 2021 | 2022 | 2023 | ||||
| # | % | # | % | # | % | # | % | |
| Nurses in Baseline Year | 8,148 | – | 8,118 | – | 7,672 | – | 7,946 | – |
| In Following Year: | 2021 | 2022 | 2023 | 2024 | ||||
| Same Region | 7,810 | 95.9 | 7,203 | 88.7 | 7,483 | 97.5 | 7,662 | 96.4 |
| Different Region | 106 | 1.3 | 528 | 6.5 | 76 | 1.0 | 120 | 1.5 |
| Outside Michigan | 23 | 0.3 | 217 | 2.7 | 24 | 0.3 | 41 | 0.5 |
| Not Found | 209 | 2.6 | 170 | 2.1 | 89 | 1.2 | 123 | 1.5 |
Movement of Nurses Among RNs Living in South Central Michigan
| Aged 64 years or younger | ||||||||
|---|---|---|---|---|---|---|---|---|
| Living in South Central MI in Baseline Year | 2020 | 2021 | 2022 | 2023 | ||||
| # | % | # | % | # | % | # | % | |
| Nurses in Baseline Year | 4,998 | – | 4,895 | – | 4,709 | – | 4,862 | – |
| In Following Year: | 2021 | 2022 | 2023 | 2024 | ||||
| Same Region | 4,758 | 95.2 | 4,255 | 86.9 | 4,531 | 96.2 | 4,626 | 95.1 |
| Different Region | 109 | 2.2 | 343 | 7.0 | 98 | 2.1 | 131 | 2.7 |
| Outside Michigan | 24 | 0.5 | 154 | 3.1 | 20 | 0.4 | 30 | 0.6 |
| Not Found | 107 | 2.1 | 143 | 2.9 | 60 | 1.3 | 75 | 1.5 |
| Aged 34 years or younger | ||||||||
| Living in South Central MI in Baseline Year | 2020 | 2021 | 2022 | 2023 | ||||
| # | % | # | % | # | % | # | % | |
| Nurses in Baseline Year | 5,622 | – | 5,289 | – | 5,220 | – | 5,539 | – |
| In Following Year: | 2021 | 2022 | 2023 | 2024 | ||||
| Same Region | 1,256 | 93.5 | 1,007 | 82.2 | 1,101 | 94.3 | 1,156 | 92.6 |
| Different Region | 59 | 4.4 | 136 | 11.1 | 49 | 4.2 | 64 | 5.1 |
| Outside Michigan | * | * | 52 | 4.2 | * | * | 12 | 1.0 |
| Not Found | 20 | 1.5 | 30 | 2.4 | 11 | 0.9 | 17 | 1.4 |
| Aged 35 to 64 years | ||||||||
| Living in South Central MI in Baseline Year | 2020 | 2021 | 2022 | 2023 | ||||
| # | % | # | % | # | % | # | % | |
| Nurses in Baseline Year | 3,655 | – | 3,670 | – | 3,542 | – | 3,613 | – |
| In Following Year: | 2021 | 2022 | 2023 | 2024 | ||||
| Same Region | 3,502 | 95.8 | 3,248 | 88.5 | 3,430 | 96.8 | 3,470 | 96.0 |
| Different Region | 50 | 1.4 | 207 | 5.6 | 49 | 1.4 | 67 | 1.9 |
| Outside Michigan | 16 | 0.4 | 102 | 2.8 | 14 | 0.4 | 18 | 0.5 |
| Not Found | 87 | 2.4 | 113 | 3.1 | 49 | 1.4 | 58 | 1.6 |
* Data are suppressed if count is less than 10 or sample population was less than 20.
Movement of Nurses Among RNs Living in Southwest Michigan
| Aged 64 years or younger | ||||||||
|---|---|---|---|---|---|---|---|---|
| Living in SW MI in Baseline Year | 2020 | 2021 | 2022 | 2023 | ||||
| # | % | # | % | # | % | # | % | |
| Nurses in Baseline Year | 8,468 | – | 8,292 | – | 7,980 | – | 8,217 | – |
| In Following Year: | 2021 | 2022 | 2023 | 2024 | ||||
| Same Region | 8,081 | 95.4 | 7,447 | 89.8 | 7,708 | 96.6 | 7,884 | 95.9 |
| Different Region | 91 | 1.1 | 300 | 3.6 | 84 | 1.1 | 107 | 1.3 |
| Outside Michigan | 59 | 0.7 | 293 | 3.5 | 54 | 0.7 | 64 | 0.8 |
| Not Found | 237 | 2.8 | 252 | 3.0 | 134 | 1.7 | 162 | 2.0 |
| Aged 34 years or younger | ||||||||
| Living in SW MI in Baseline Year | 2020 | 2021 | 2022 | 2023 | ||||
| # | % | # | % | # | % | # | % | |
| Nurses in Baseline Year | 1,994 | – | 1,872 | – | 1,772 | – | 1,882 | – |
| In Following Year: | 2021 | 2022 | 2023 | 2024 | ||||
| Same Region | 1,899 | 95.2 | 1,590 | 84.9 | 1,678 | 94.7 | 1,783 | 94.7 |
| Different Region | 43 | 2.2 | 128 | 6.8 | 43 | 2.4 | 54 | 2.9 |
| Outside Michigan | 16 | 0.8 | 106 | 5.7 | 22 | 1.2 | 21 | 1.1 |
| Not Found | 36 | 1.8 | 48 | 2.6 | 29 | 1.6 | 24 | 1.3 |
| Aged 35 to 64 years | ||||||||
| Living in SW MI in Baseline Year | 2020 | 2021 | 2022 | 2023 | ||||
| # | % | # | % | # | % | # | % | |
| Nurses in Baseline Year | 6,474 | – | 6,420 | – | 6,208 | – | 6,335 | – |
| In Following Year: | 2021 | 2022 | 2023 | 2024 | ||||
| Same Region | 6,182 | 95.5 | 5,857 | 91.2 | 6,030 | 97.1 | 6,101 | 96.3 |
| Different Region | 48 | 0.7 | 172 | 2.7 | 41 | 0.7 | 53 | 0.8 |
| Outside Michigan | 43 | 0.7 | 187 | 2.9 | 32 | 0.5 | 43 | 0.7 |
| Not Found | 201 | 3.1 | 204 | 3.2 | 105 | 1.7 | 138 | 2.2 |
Movement of Nurses Among RNs Living in Southeast Michigan
| Aged 64 years or younger | ||||||||
|---|---|---|---|---|---|---|---|---|
| Living in SE MI in Baseline Year | 2020 | 2021 | 2022 | 2023 | ||||
| # | % | # | % | # | % | # | % | |
| Nurses in Baseline Year | 13,921 | – | 13,717 | – | 14,234 | – | 14,674 | – |
| In Following Year: | 2021 | 2022 | 2023 | 2024 | ||||
| Same Region | 13,289 | 95.5 | 12,362 | 90.1 | 13,733 | 96.5 | 13,998 | 95.4 |
| Different Region | 225 | 1.6 | 502 | 3.7 | 212 | 1.5 | 303 | 2.1 |
| Outside Michigan | 96 | 0.7 | 439 | 3.2 | 75 | 0.5 | 112 | 0.8 |
| Not Found | 311 | 2.2 | 414 | 3.0 | 214 | 1.5 | 261 | 1.8 |
| Aged 34 years or younger | ||||||||
| Living in SE MI in Baseline Year | 2020 | 2021 | 2022 | 2023 | ||||
| # | % | # | % | # | % | # | % | |
| Nurses in Baseline Year | 3,715 | – | 3,540 | – | 3,689 | – | 3,839 | – |
| In Following Year: | 2021 | 2022 | 2023 | 2024 | ||||
| Same Region | 3,499 | 94.2 | 3,029 | 85.6 | 3,491 | 94.6 | 3,599 | 93.7 |
| Different Region | 115 | 3.1 | 231 | 6.5 | 110 | 3.0 | 148 | 3.9 |
| Outside Michigan | 32 | 0.9 | 166 | 4.7 | 29 | 0.8 | 39 | 1.0 |
| Not Found | 69 | 1.9 | 114 | 3.2 | 59 | 1.6 | 53 | 1.4 |
| Aged 35 to 64 years | ||||||||
| Living in SE MI in Baseline Year | 2020 | 2021 | 2022 | 2023 | ||||
| # | % | # | % | # | % | # | % | |
| Nurses in Baseline Year | 10,206 | – | 10,177 | – | 10,545 | – | 10,835 | – |
| In Following Year: | 2021 | 2022 | 2023 | 2024 | ||||
| Same Region | 9,790 | 95.9 | 9,333 | 91.7 | 10,242 | 97.1 | 10,399 | 96 |
| Different Region | 110 | 1.1 | 271 | 2.7 | 102 | 1.0 | 155 | 1.4 |
| Outside Michigan | 64 | 0.6 | 273 | 2.7 | 46 | 0.4 | 73 | 0.7 |
| Not Found | 242 | 2.4 | 300 | 2.9 | 155 | 1.5 | 208 | 1.9 |
Movement of Nurses Among RNs Living in the Detroit Metro Area of Michigan
| Aged 64 years or younger | ||||||||
|---|---|---|---|---|---|---|---|---|
| Living in DMA in Baseline Year | 2020 | 2021 | 2022 | 2023 | ||||
| # | % | # | % | # | % | # | % | |
| Nurses in Baseline Year | 46,143 | – | 45,390 | – | 43,877 | – | 45,175 | – |
| In Following Year: | 2021 | 2022 | 2023 | 2024 | ||||
| Same Region | 44,495 | 96.4 | 41,523 | 91.5 | 42,694 | 97.3 | 43,785 | 96.9 |
| Different Region | 475 | 1.0 | 1,497 | 3.3 | 449 | 1.0 | 533 | 1.2 |
| Outside Michigan | 230 | 0.5 | 1,394 | 3.1 | 230 | 0.5 | 254 | 0.6 |
| Not Found | 943 | 2.0 | 976 | 2.2 | 504 | 1.1 | 603 | 1.3 |
| Aged 34 years or younger | ||||||||
| Living in DMA in Baseline Year | 2020 | 2021 | 2022 | 2023 | ||||
| # | % | # | % | # | % | # | % | |
| Nurses in Baseline Year | 13,333 | – | 12,702 | – | 12,440 | – | 13,038 | – |
| In Following Year: | 2021 | 2022 | 2023 | 2024 | ||||
| Same Region | 12,877 | 96.6 | 11,382 | 89.6 | 12,064 | 97.0 | 12,541 | 96.2 |
| Different Region | 226 | 1.7 | 554 | 4.4 | 173 | 1.4 | 257 | 2.0 |
| Outside Michigan | 65 | 0.5 | 513 | 4.0 | 70 | 0.6 | 92 | 0.7 |
| Not Found | 165 | 1.2 | 253 | 2.0 | 133 | 1.1 | 148 | 1.1 |
| Aged 35 to 64 years | ||||||||
| Living in DMA in Baseline Year | 2020 | 2021 | 2022 | 2023 | ||||
| # | % | # | % | # | % | # | % | |
| Nurses in Baseline Year | 32,810 | – | 32,688 | – | 31,437 | – | 32,137 | – |
| In Following Year: | 2021 | 2022 | 2023 | 2024 | ||||
| Same Region | 31,618 | 96.4 | 30,141 | 92.2 | 30,630 | 97.4 | 31,244 | 97.2 |
| Different Region | 249 | 0.8 | 943 | 2.9 | 276 | 0.9 | 276 | 0.9 |
| Outside Michigan | 165 | 0.5 | 881 | 2.7 | 160 | 0.5 | 162 | 0.5 |
| Not Found | 778 | 2.4 | 723 | 2.2 | 371 | 1.2 | 455 | 1.4 |
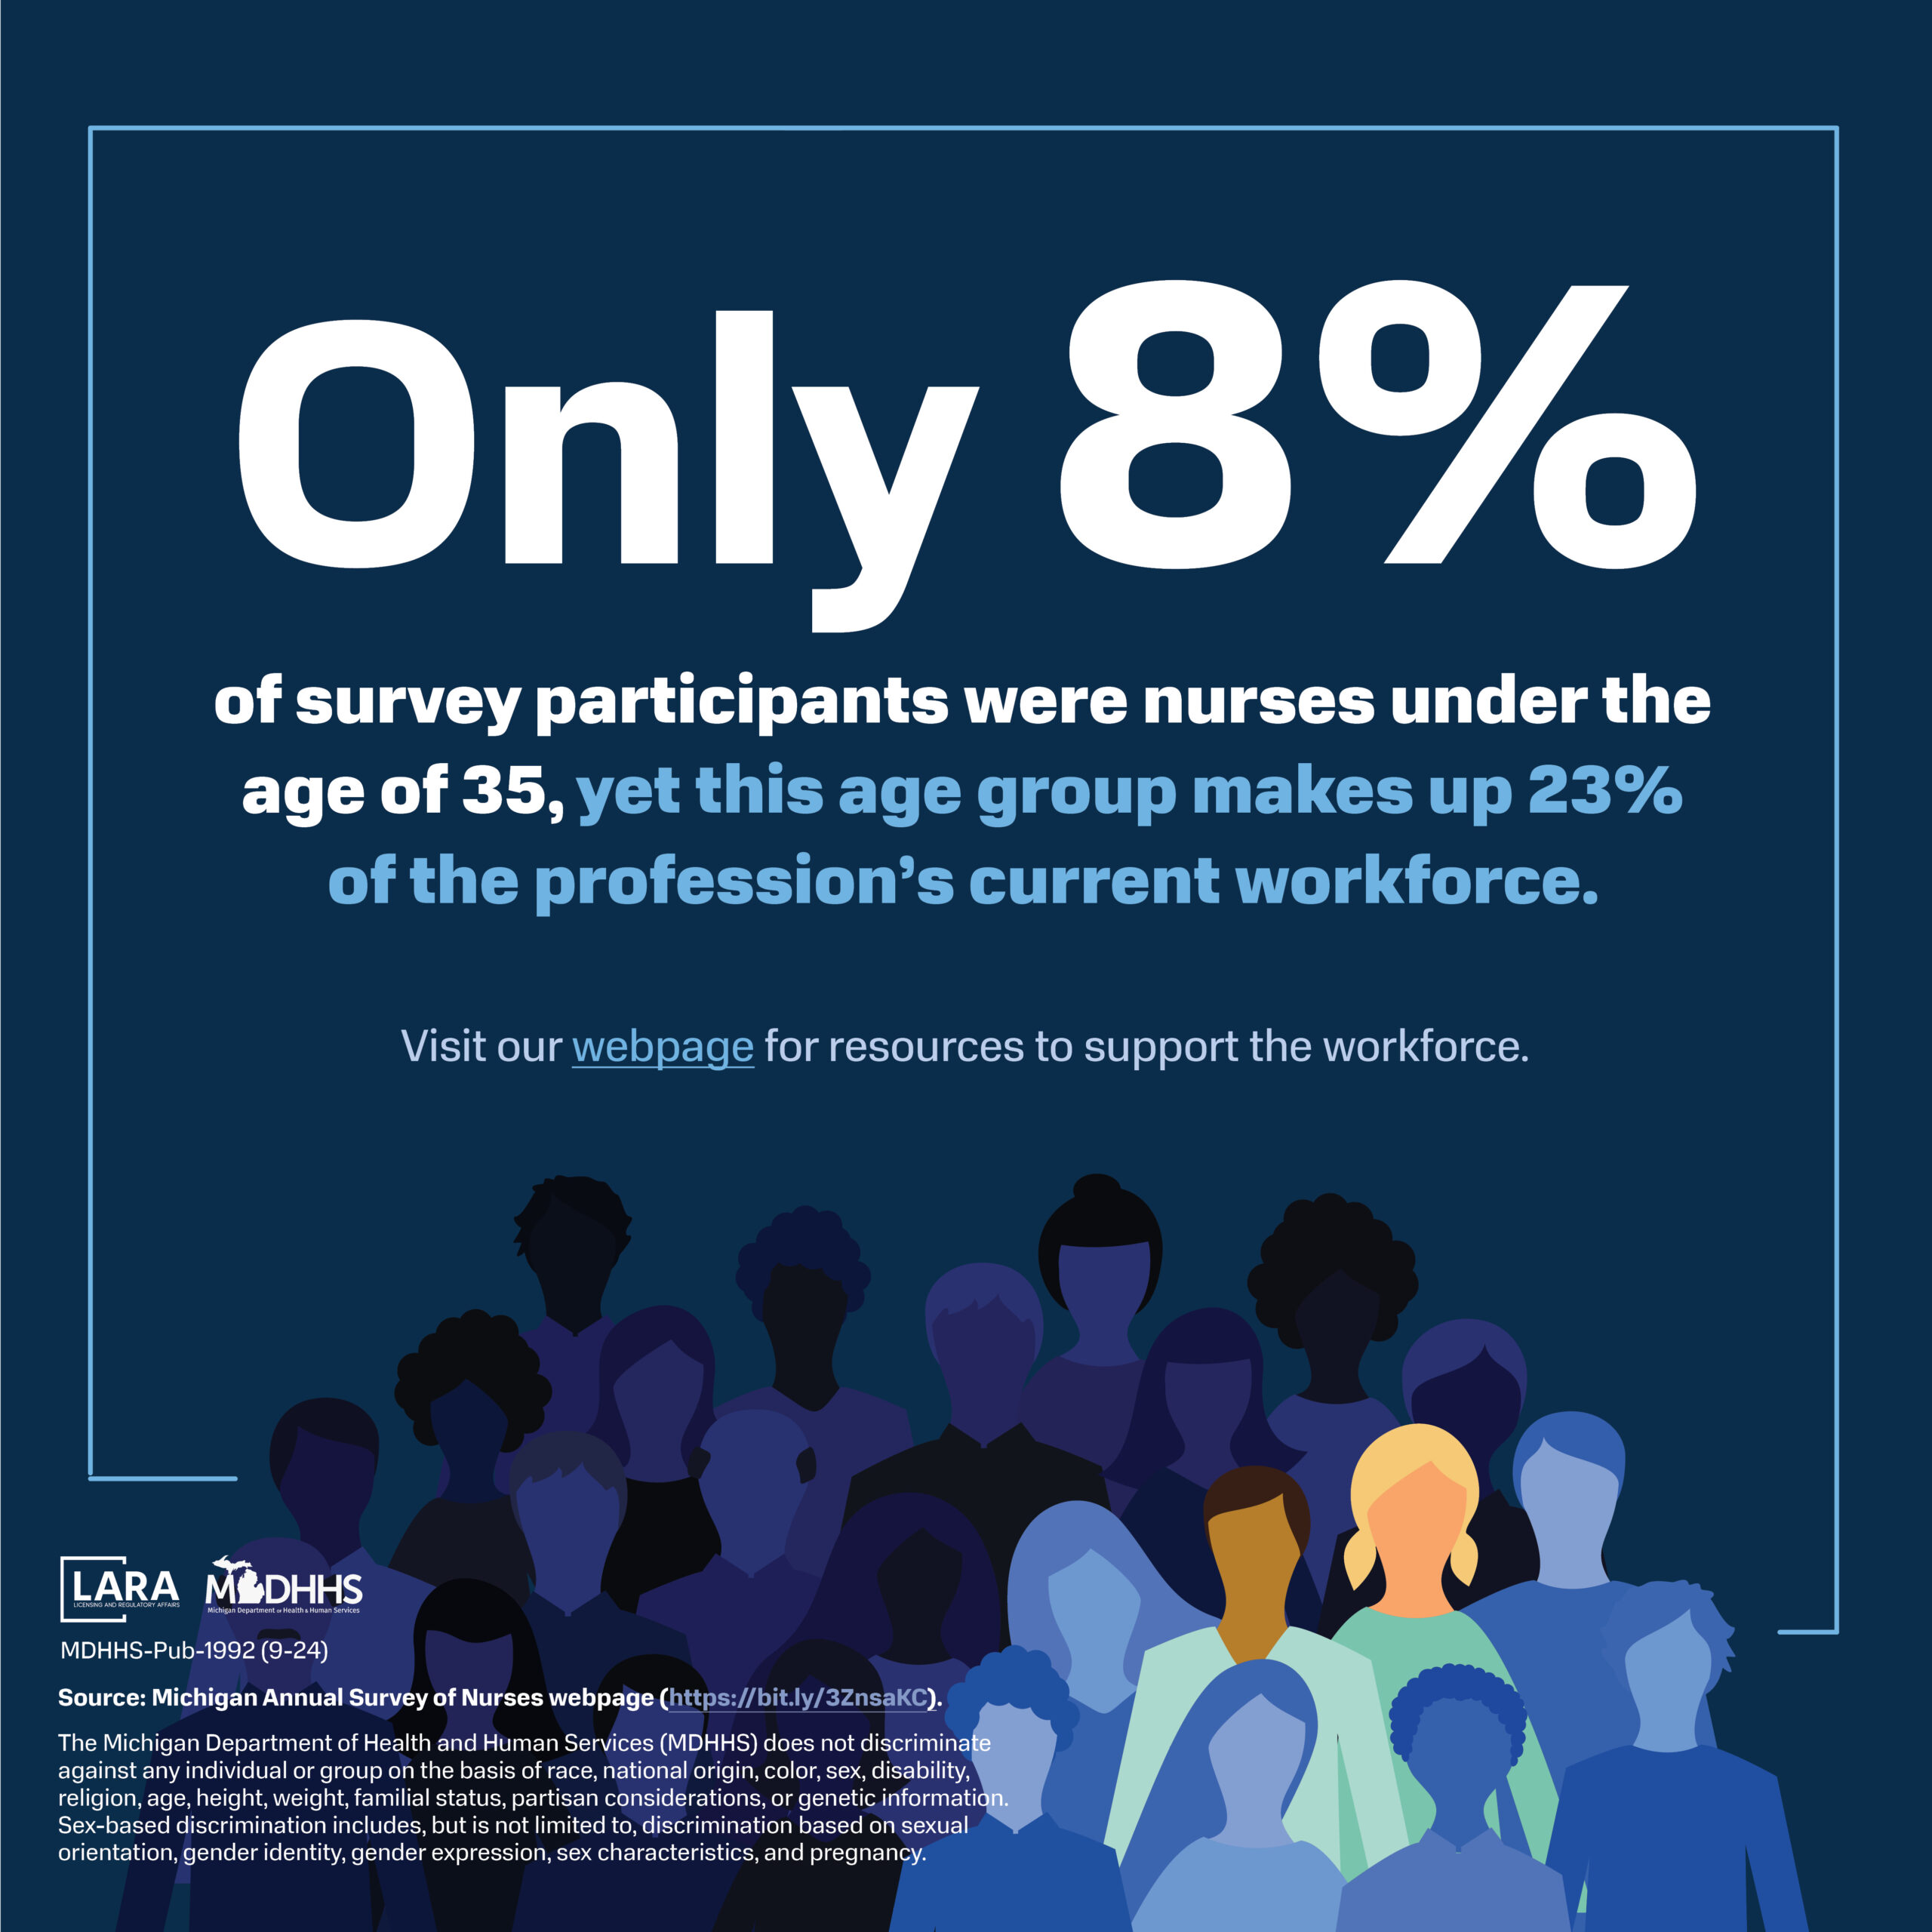
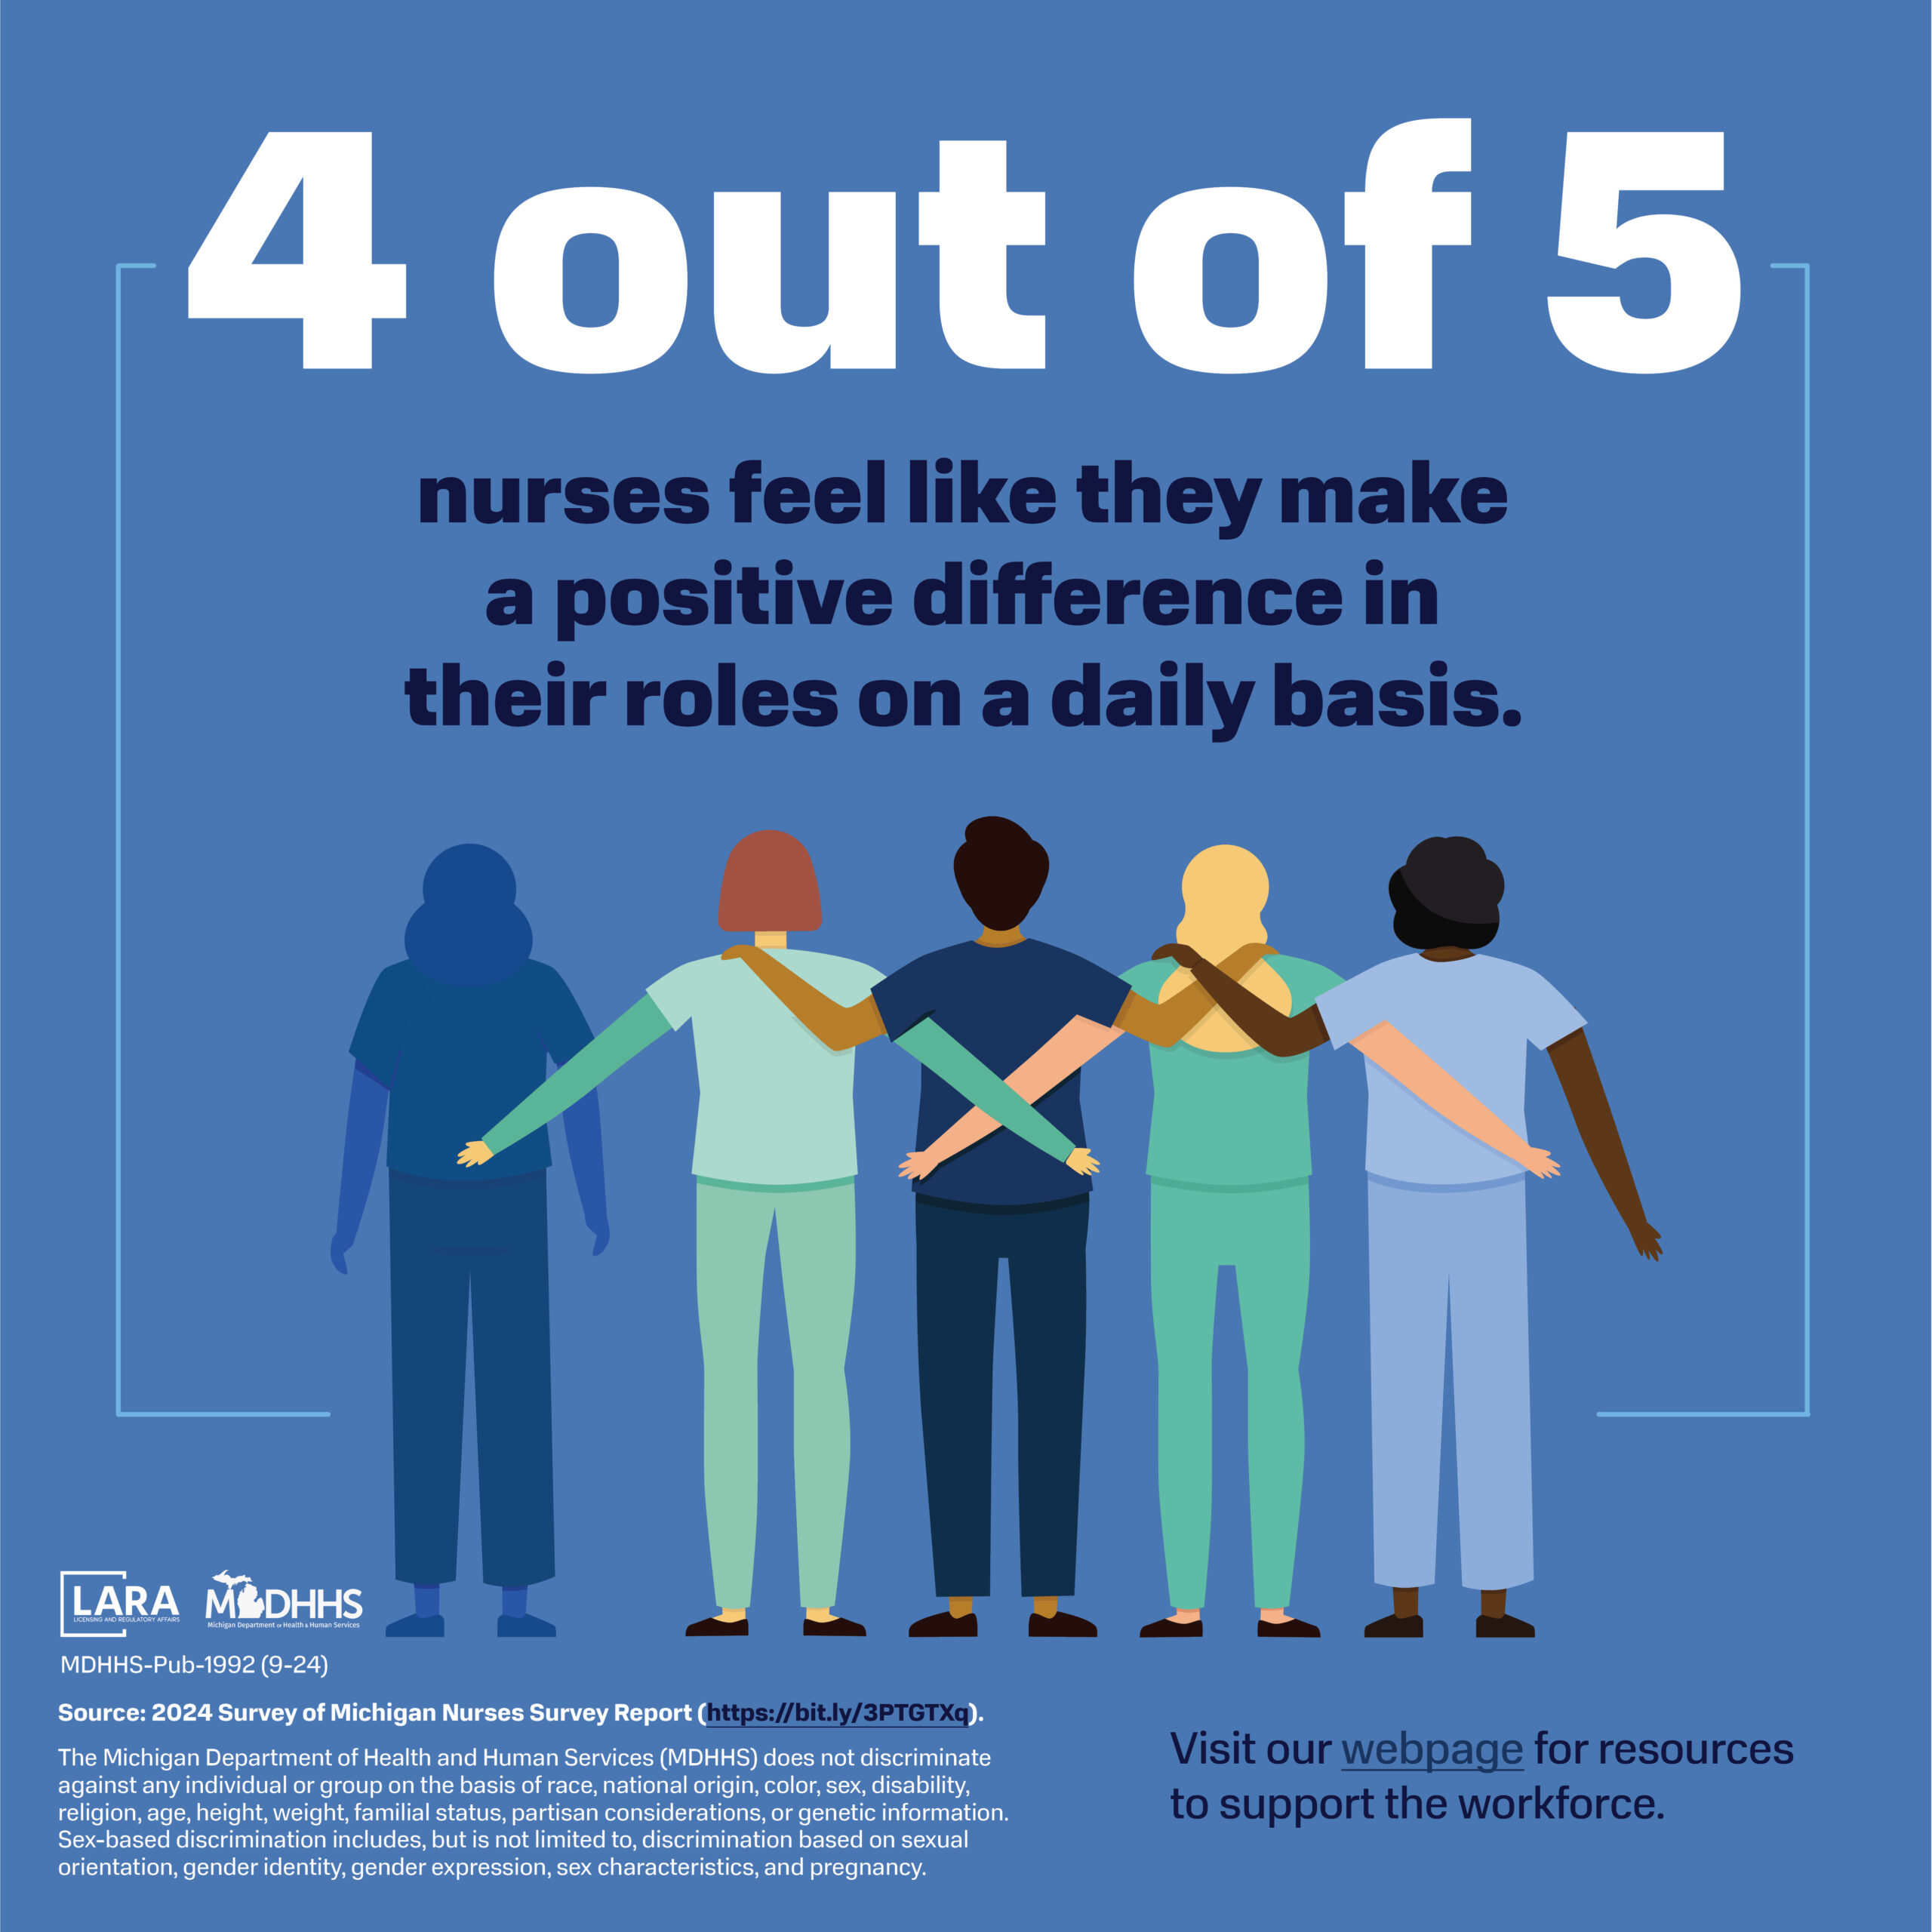

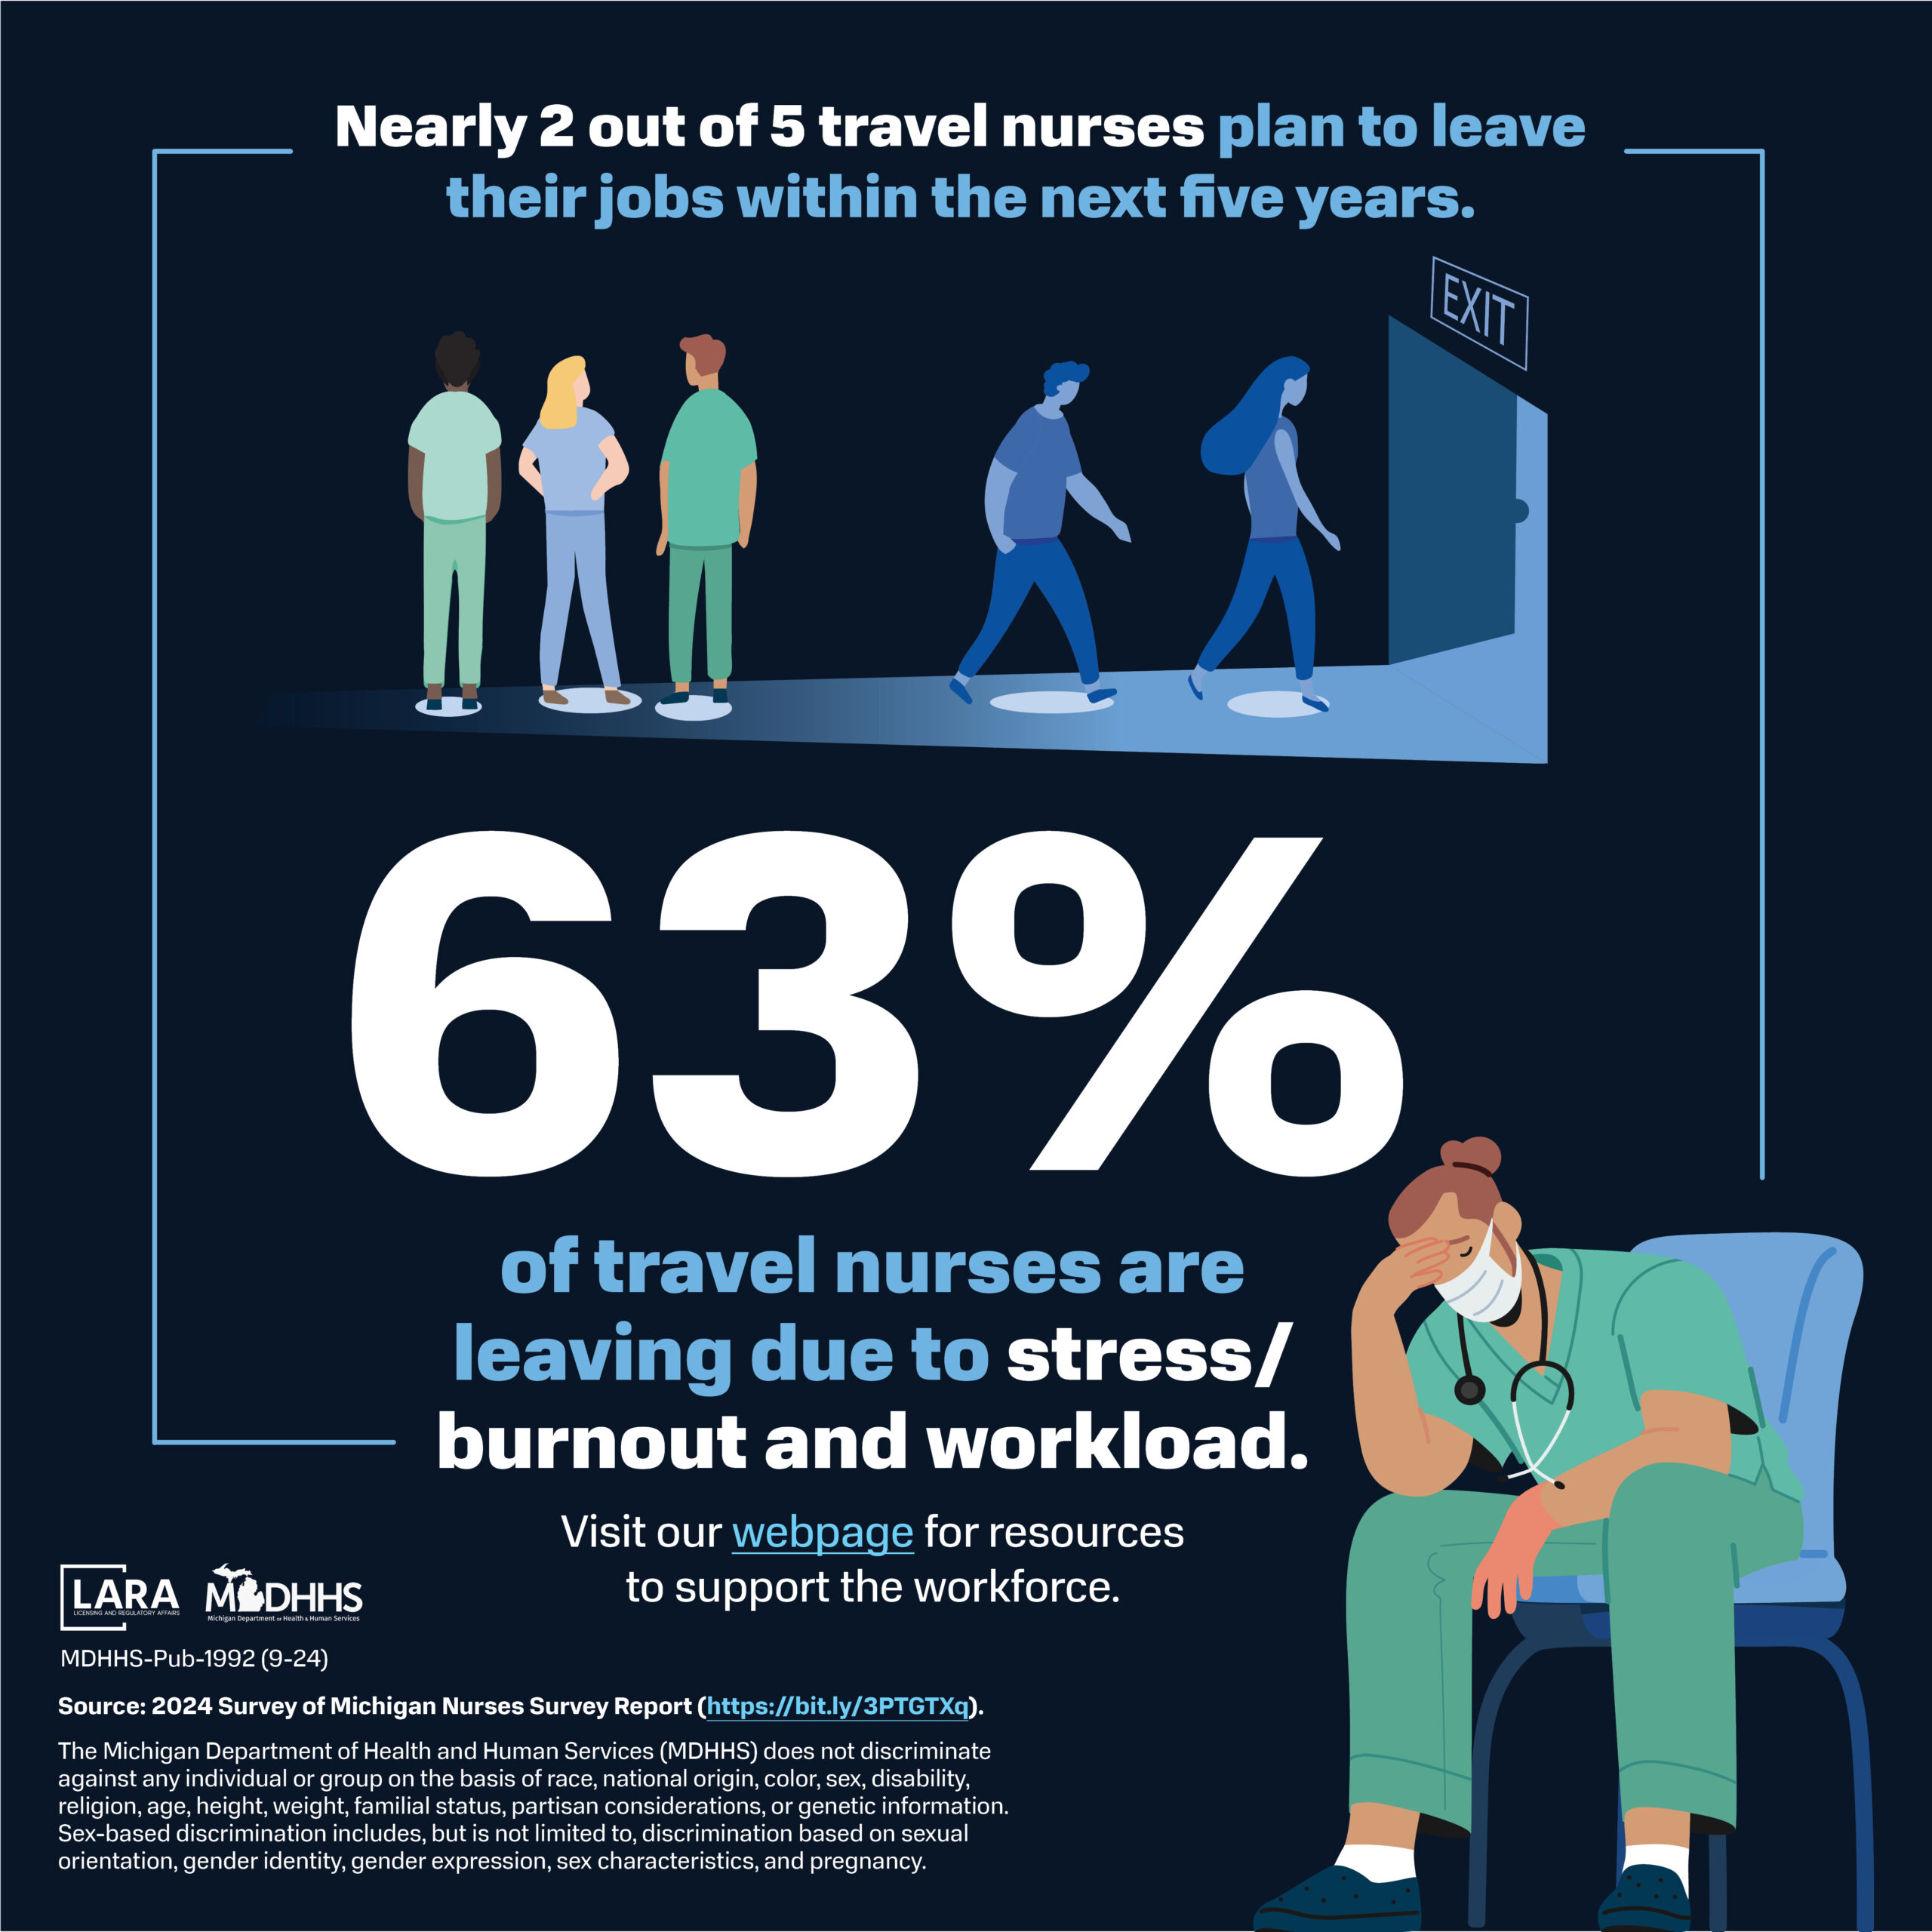