Michigan Nurse Licensure Data websites will be taken off minurse.org in Fall 2026. The Number & Rate of Michigan Nurses and Changes in Michigan Licensed Nurse Populations information will be moved to https://minurse.org/survey-data/. If you have any questions or concerns, please contact us at info@minurse.org.
This website focuses on data obtained from the Michigan Bureau of Professional Licensing and includes all nurses who are currently licensed to practice in Michigan. This website provides information that illustrates the distribution of nurses in Michigan, both in absolute numbers and relative to the State’s population distribution. Information regarding the age distribution of nurses across the state is also included. The information is presented in easy to use maps, tables and charts.
Michigan Overall
Michigan Licensed Nurses by Type and Residency
Residence
Total
RNs
LPNs
# of Nurses
%
# of Nurses
%
# of Nurses
%
Michigan
162,245
86.4
140,031
85.3
22,214
93.9
Ohio
3,635
1.9
3,283
2.0
352
1.5
Indiana
1,450
0.8
1,328
0.8
122
0.5
Wisconsin
1,116
0.6
1,001
0.6
115
0.5
Minnesota
368
0.2
357
0.2
11
0.0
Other U.S. States
15,557
8.3
14,758
9.0
799
3.4
Canada
3,075
1.6
3,034
1.8
41
0.2
Other Countries
286
0.2
285
0.2
*
*
Total
187,732
100.0
164,077
100.0
23,655
100.0
*Cells with less than 6 nurses were censored.
License Type
Living in Michigan
Living Outside
Michigan
Total
#
%
#
%
Total
162,245
86.4%
25,487
13.6%
187,732
LPNs
22,214
93.9%
1,441
6.1%
23,655
RNs
140,031
85.3%
24,046
14.7%
164,077
NPs
9,281
86.8%
1,406
13.2%
10,687
CNAs
2,556
85.7%
425
14.3%
2,981
CNMs
441
90.6%
46
9.4%
487
CNSs
233
94.7%
13
5.3%
246
Total Michigan Nurses (LPNs and RNs) by Prosperity Region and County
Region
# of Nurses
Population*
Nurses per 10,000
Michigan*
187,732
9,986,857
188.0
Eastern/Central/Western UP
5,802
298,851
194.1
Northwest LP
5,729
306,842
186.7
Northeast LP
3,313
203,087
163.1
West/West Central
24,512
1,613,924
151.9
East Central
9,595
558,686
171.7
East
14,462
845,066
171.1
South Central
6,424
482,269
133.2
Southwest
11,615
784,571
148.0
Southeast
19,354
1,012,662
191.1
Detroit Metro
61,439
3,880,899
158.3
*Includes nurses who live outside of Michigan
*Population data are based on 2020 census data. *Population data are based on 2020 census data.
Region
County
# of Nurses
Population*
Nurses per 10,000
Eastern/ Central/ Western UP
5,802
298,851
194.1
Alger
136
9,108
149.3
Baraga
141
8,209
171.8
Chippewa
524
37,349
140.3
Delta
702
35,784
196.2
Dickinson
551
25,239
218.3
Gogebic
263
13,975
188.2
Houghton
715
35,684
200.4
Iron
191
11,066
172.6
Keweenaw
49
2,116
231.6
Luce
86
6,229
138.1
Mackinac
156
10,799
144.5
Marquette
1,763
66,699
264.3
Menominee
285
22,780
125.1
Ontonagon
92
5,720
160.8
Schoolcraft
148
8,094
182.9
Northwest LP
5,729
283,518
202.1
Antrim
320
23,324
137.2
Benzie
358
17,766
201.5
Charlevoix
464
26,143
177.5
Emmet
781
33,415
233.7
Grand Traverse
2,166
93,088
232.7
Kalkaska
191
18,038
105.9
Leelanau
477
21,761
219.2
Manistee
329
24,558
134.0
Missaukee
198
15,118
131.0
Wexford
445
33,631
132.3
Northeast LP
3,313
192,682
171.9
Alcona
147
10,405
141.3
Alpena
645
28,405
227.1
Cheboygan
349
25,276
138.1
Crawford
228
14,029
162.5
Iosco
359
25,127
142.9
Montmorency
121
9,328
129.7
Ogemaw
398
20,997
189.6
Oscoda
95
8,241
115.3
Otsego
411
24,668
166.6
Presque Isle
217
12,592
172.3
Roscommon
343
24,019
142.8
West/West Central
24,512
1,495,843
163.9
Allegan
1,608
118,081
136.2
Barry
1,059
61,550
172.1
Ionia
763
64,697
117.9
Kent
10,690
656,955
162.7
Lake
81
11,853
68.3
Mason
570
29,144
195.6
Mecosta
446
43,453
102.6
Montcalm
919
63,888
143.8
Muskegon
2,348
173,566
135.3
Newaygo
585
48,980
119.4
Oceana
291
26,467
109.9
Osceola
276
23,460
117.6
Ottawa
4,876
291,830
167.1
East Central
9,595
543,803
176.4
Arenac
272
14,883
182.8
Bay
2,268
103,126
219.9
Clare
417
30,950
134.7
Gladwin
431
25,449
169.4
Gratiot
603
40,711
148.1
Isabella
759
69,872
108.6
Midland
1,559
83,156
187.5
Saginaw
3,286
190,539
172.5
East
14,462
439,253
329.2
Genesee
6,799
405,813
167.5
Huron
561
30,981
181.1
Lapeer
1,562
87,607
178.3
Saint Clair
3,030
159,128
190.4
Sanilac
604
41,170
146.7
Shiawassee
1,027
68,122
150.8
Tuscola
879
52,245
168.2
South Central
6,424
402,674
159.5
Clinton
1,474
79,595
185.2
Eaton
1,631
110,268
147.9
Ingham
3,319
292,406
113.5
Southwest
11,615
631,170
184.0
Berrien
2,123
153,401
138.4
Branch
563
43,517
129.4
Calhoun
2,046
134,159
152.5
Cass
496
51,787
95.8
Kalamazoo
4,480
265,066
169.0
Saint Joseph
800
60,964
131.2
Van Buren
1,107
75,677
146.3
Southeast
19,354
967,057
200.1
Hillsdale
644
45,605
141.2
Jackson
2,756
158,510
173.9
Lenawee
1,589
98,451
161.4
Livingston
4,386
191,995
228.4
Monroe
3,157
150,500
209.8
Washtenaw
6,822
367,601
185.6
Detroit Metro
61,439
3,006,927
204.3
Macomb
14,782
873,972
169.1
Oakland
21,799
1,257,584
173.3
Wayne
24,858
1,749,343
142.1
Michigan*
187,732
9,986,857
188.0
*Includes nurses who live outside of Michigan
*Population data are based on 2023 census data
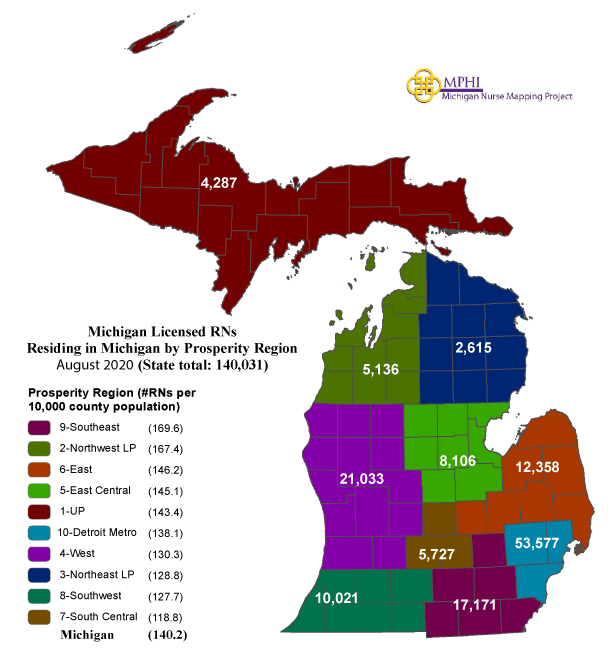
State Distribution
Michigan Licensed Registered Nurses (RNs)
Region
# of RNs
Population*
RNs per 10,000
Michigan
164,077
9,986,857
164.3
Eastern/Central/Western UP
4,287
298,851
143.4
Northwest LP
5,136
306,842
167.4
Northeast LP
2,615
203,087
128.8
West/West Central
21,033
1,613,924
130.3
East Central
8,106
558,686
145.1
East
12,358
845,066
146.2
South Central
5,727
482,269
118.8
Southwest
10,021
784,571
127.7
Southeast
17,171
1,012,662
169.6
Detroit Metro
53,577
3,880,899
138.1
*Population data are based on 2020 census data.
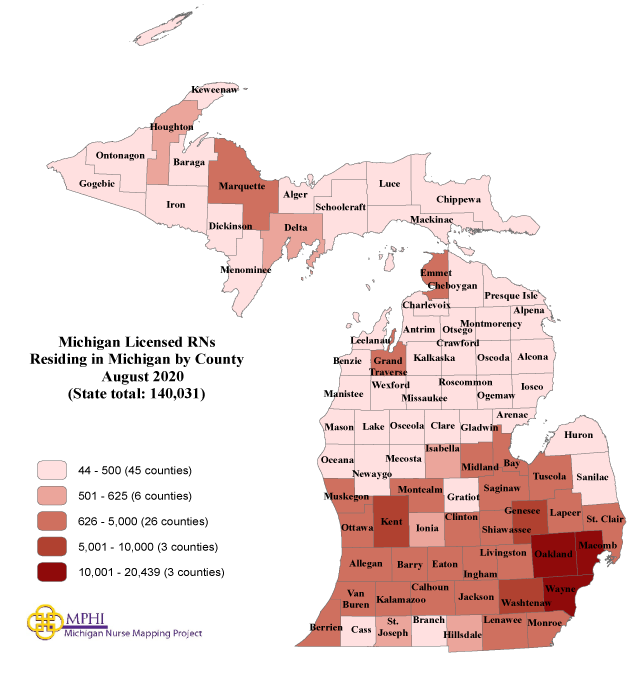
Region
County
# of RNs
Population*
RNs per 10,000
Eastern/ Central/ Western UP
4,287
298,851
143.4
Alger
96
9,108
105.4
Baraga
102
8,209
124.3
Chippewa
393
37,349
105.2
Delta
538
35,784
150.3
Dickinson
409
25,239
162.1
Gogebic
185
13,975
132.4
Houghton
603
35,684
169.0
Iron
146
11,066
131.9
Keweenaw
44
2,116
207.9
Luce
61
6,229
97.9
Mackinac
117
10,799
108.3
Marquette
1,223
66,699
183.4
Menominee
194
22,780
85.2
Ontonagon
73
5,720
127.6
Schoolcraft
103
8,094
127.3
Northwest LP
5,136
306,842
167.4
Antrim
264
23,324
113.2
Benzie
312
17,766
175.6
Charlevoix
429
26,143
164.1
Emmet
744
33,415
222.7
Grand Traverse
1,963
93,088
210.9
Kalkaska
156
18,038
86.5
Leelanau
439
21,761
201.7
Manistee
281
24,558
114.4
Missaukee
161
15,118
106.5
Wexford
387
33,631
115.1
Northeast LP
2,615
203,087
128.8
Alcona
113
10,405
108.6
Alpena
472
28,405
166.2
Cheboygan
314
25,276
124.2
Crawford
168
14,029
119.8
Iosco
273
25,127
108.6
Montmorency
99
9,328
106.1
Ogemaw
319
20,997
151.9
Oscoda
73
8,241
88.6
Otsego
345
24,668
139.9
Presque Isle
176
12,592
139.8
Roscommon
263
24,019
109.5
West/West Central
21,033
1,613,924
130.3
Allegan
1,391
118,081
117.8
Barry
897
61,550
145.7
Ionia
624
64,697
96.4
Kent
9,307
656,955
141.7
Lake
69
11,853
58.2
Mason
489
29,144
167.8
Mecosta
395
43,453
90.9
Montcalm
732
63,888
114.6
Muskegon
1,928
173,566
111.1
Newaygo
484
48,980
98.8
Oceana
235
26,467
88.8
Osceola
231
23,460
98.5
Ottawa
4,251
291,830
145.7
East Central
8,106
558,686
145.1
Arenac
210
14,883
141.1
Bay
1,931
103,126
187.2
Clare
331
30,950
106.9
Gladwin
360
25,449
141.5
Gratiot
486
40,711
119.4
Isabella
625
69,872
89.4
Midland
1,384
83,156
166.4
Saginaw
2,779
190,539
145.8
East
12,358
845,066
146.2
Genesee
6,088
405,813
150.0
Huron
376
30,981
121.4
Lapeer
1,390
87,607
158.7
Saint Clair
2,442
159,128
153.5
Sanilac
456
41,170
110.8
Shiawassee
942
68,122
138.3
Tuscola
664
52,245
127.1
South Central
5,727
482,269
118.8
Clinton
1,361
79,595
171.0
Eaton
1,437
110,268
130.3
Ingham
2,929
292,406
100.2
Southwest
10,021
784,571
127.7
Berrien
1,860
153,401
121.3
Branch
438
43,517
100.7
Calhoun
1,665
134,159
124.1
Cass
425
51,787
82.1
Kalamazoo
4,022
265,066
151.7
Saint Joseph
610
60,964
100.1
Van Buren
1,001
75,677
132.3
Southeast
17,171
1,012,662
169.6
Hillsdale
508
45,605
111.4
Jackson
2,322
158,510
146.5
Lenawee
1,281
98,451
130.1
Livingston
4,130
191,995
215.1
Monroe
2,460
150,500
163.5
Washtenaw
6,470
367,601
176.0
Detroit Metro
53,577
3,880,899
138.1
Macomb
13,125
873,972
150.2
Oakland
20,013
1,257,584
159.1
Wayne
20,439
1,749,343
116.8
Michigan
164,077
9,986,857
164.3
*To see other regions, please press the “Next” button at the bottom of the table.
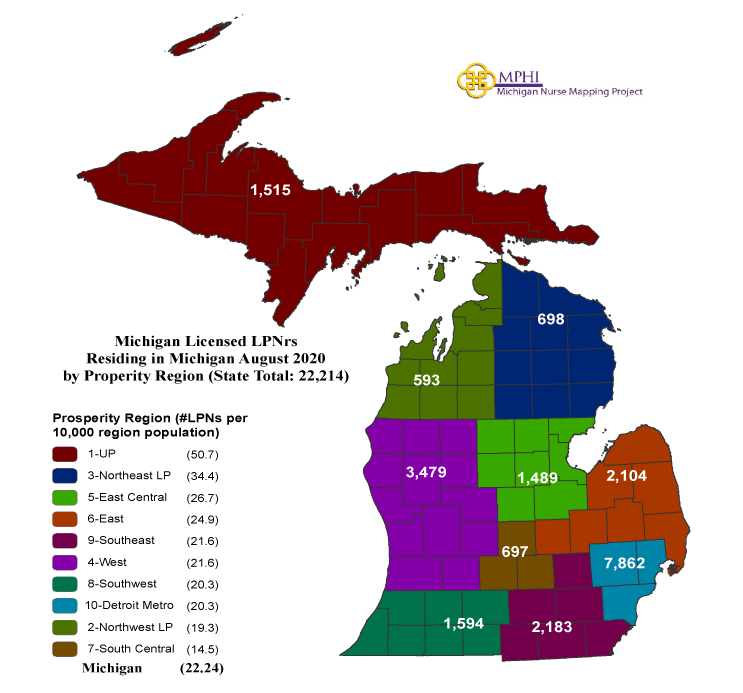
*Population data are based on 2020 census data.Michigan Licensed Practical Nurses (LPNs)
Region
# of LPNs
Population*
LPNs per 10,000
Michigan
23,655
9,986,857
23.7
Eastern/Central/Western UP
1,515
298,851
50.7
Northwest LP
593
306,842
19.3
Northeast LP
698
203,087
34.4
West/West Central
3,479
1,613,924
21.6
East Central
1,489
558,686
26.7
East
2,104
845,066
24.9
South Central
697
482,269
14.5
Southwest
1,594
784,571
20.3
Southeast
2,183
1,012,662
21.6
Detroit Metro
7,862
3,880,899
20.3
*Population data are based on 2020 census data.
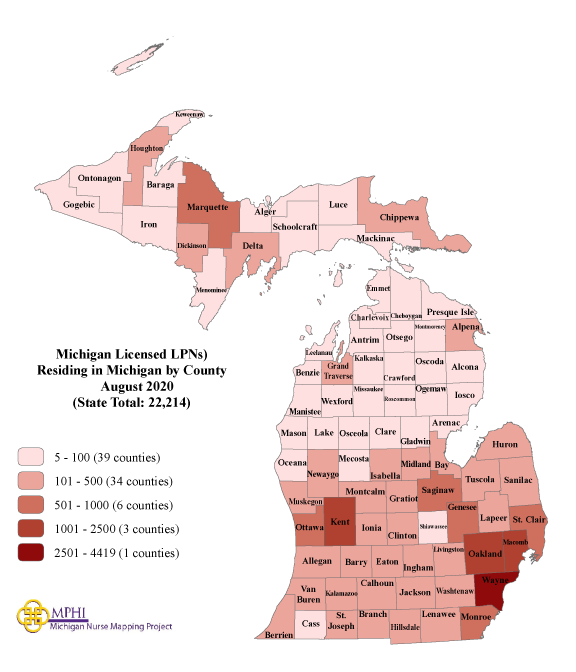
Region
County
# of LPNs
Population*
LPNs per 10,000
Eastern/ Central/ Western UP
1,515
298,851
50.7
Alger
40
9,108
43.9
Baraga
39
8,209
47.5
Chippewa
131
37,349
35.1
Delta
164
35,784
45.8
Dickinson
142
25,239
56.3
Gogebic
78
13,975
55.8
Houghton
112
35,684
31.4
Iron
45
11,066
40.7
Keweenaw
*
2,116
*
Luce
25
6,229
40.1
Mackinac
39
10,799
36.1
Marquette
540
66,699
81.0
Menominee
91
22,780
39.9
Ontonagon
19
5,720
33.2
Schoolcraft
45
8,094
55.6
Northwest LP
593
306,842
19.3
Antrim
56
23,324
24.0
Benzie
46
17,766
25.9
Charlevoix
35
26,143
13.4
Emmet
37
33,415
11.1
Grand Traverse
203
93,088
21.8
Kalkaska
35
18,038
19.4
Leelanau
38
21,761
17.5
Manistee
48
24,558
19.5
Missaukee
37
15,118
24.5
Wexford
58
33,631
17.2
Northeast LP
698
203,087
34.4
Alcona
34
10,405
32.7
Alpena
173
28,405
60.9
Cheboygan
35
25,276
13.8
Crawford
60
14,029
42.8
Iosco
86
25,127
34.2
Montmorency
22
9,328
23.6
Ogemaw
79
20,997
37.6
Oscoda
22
8,241
26.7
Otsego
66
24,668
26.8
Presque Isle
41
12,592
32.6
Roscommon
80
24,019
33.3
West/West Central
3,479
1,613,924
21.6
Allegan
217
118,081
18.4
Barry
162
61,550
26.3
Ionia
139
64,697
21.5
Kent
1,383
656,955
21.1
Lake
12
11,853
10.1
Mason
81
29,144
27.8
Mecosta
51
43,453
11.7
Montcalm
187
63,888
29.3
Muskegon
420
173,566
24.2
Newaygo
101
48,980
20.6
Oceana
56
26,467
21.2
Osceola
45
23,460
19.2
Ottawa
625
291,830
21.4
East Central
1,489
558,686
26.7
Arenac
62
14,883
41.7
Bay
337
103,126
32.7
Clare
86
30,950
27.8
Gladwin
71
25,449
27.9
Gratiot
117
40,711
28.7
Isabella
134
69,872
19.2
Midland
175
83,156
21.0
Saginaw
507
190,539
26.6
East
2,104
845,066
24.9
Genesee
711
405,813
17.5
Huron
185
30,981
59.7
Lapeer
172
87,607
19.6
Saint Clair
588
159,128
37.0
Sanilac
148
41,170
35.9
Shiawassee
85
68,122
12.5
Tuscola
215
52,245
41.2
South Central
697
482,269
14.5
Clinton
113
79,595
14.2
Eaton
194
110,268
17.6
Ingham
390
292,406
13.3
Southwest
1,594
784,571
20.3
Berrien
263
153,401
17.1
Branch
125
43,517
28.7
Calhoun
381
134,159
28.4
Cass
71
51,787
13.7
Kalamazoo
458
265,066
17.3
Saint Joseph
190
60,964
31.2
Van Buren
106
75,677
14.0
Southeast
2,183
1,012,662
21.6
Hillsdale
136
45,605
29.8
Jackson
434
158,510
27.4
Lenawee
308
98,451
31.3
Livingston
256
191,995
13.3
Monroe
697
150,500
46.3
Washtenaw
352
367,601
9.6
Detroit Metro
7,862
3,880,899
20.3
Macomb
1,657
873,972
19.0
Oakland
1,786
1,257,584
14.2
Wayne
4,419
1,749,343
25.3
Michigan
23,655
9,986,857
23.7
*To see other regions, please press the “Next” button at the bottom of the table.
*Cells with less than 6 nurses were censored
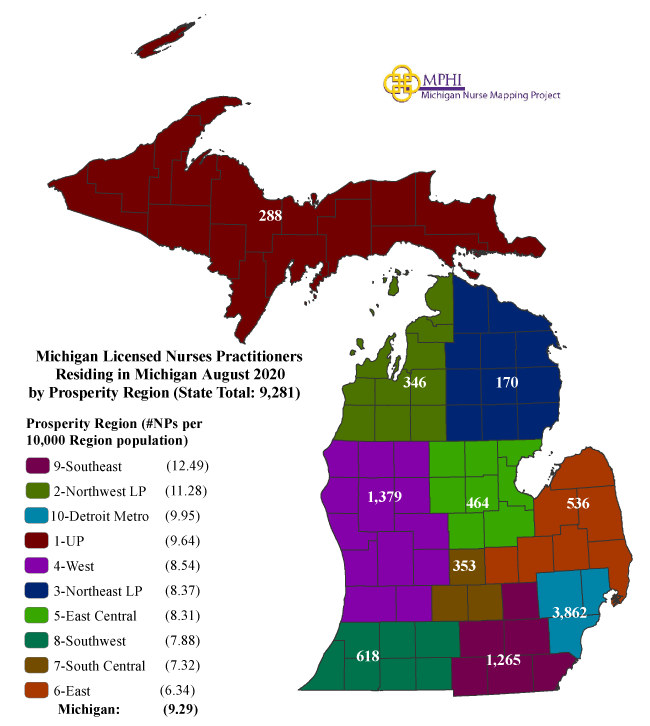
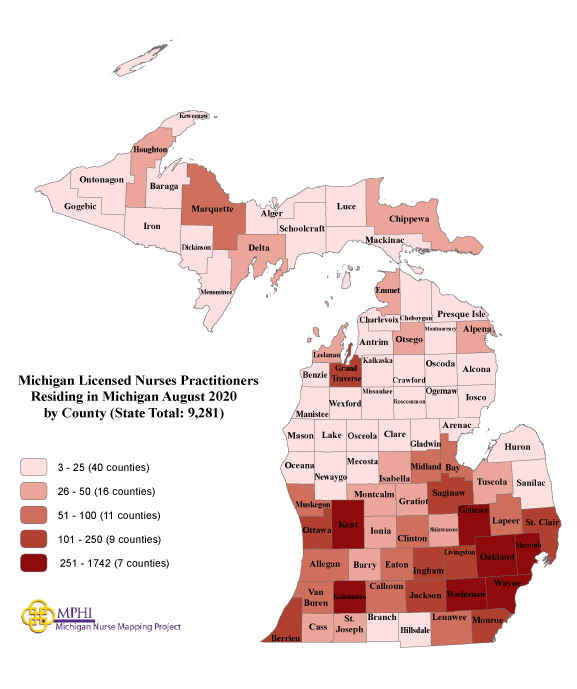
*Population data are based on 2020 census data.Michigan Licensed Nurse Practitioners (NPs)
Region
# of Nurses
Population*
Nurses per 10,000
Michigan*
10,687
9,986,857
10.7
Eastern/Central/Western UP
288
298,851
9.6
Northwest LP
346
306,842
11.3
Northeast LP
170
203,087
8.4
West/West Central
1,379
1,613,924
8.5
East Central
464
558,686
8.3
East
536
845,066
6.3
South Central
353
482,269
7.3
Southwest
618
784,571
7.9
Southeast
1,265
1,012,662
12.5
Detroit Metro
3,862
3,880,899
10.0
Region
County
# of
NPs
Population*
NPs per 10,000
Eastern/ Central/ Western UP
288
298,851
9.6
Alger
*
9,108
*
Baraga
*
8,209
*
Chippewa
39
37,349
10.4
Delta
29
35,784
8.1
Dickinson
24
25,239
9.5
Gogebic
9
13,975
6.4
Houghton
26
35,684
7.3
Iron
11
11,066
9.9
Keweenaw
*
2,116
8.0
Luce
*
6,229
*
Mackinac
9
10,799
8.3
Marquette
98
66,699
14.7
Menominee
11
22,780
4.8
Ontonagon
7
5,720
12.2
Schoolcraft
10
8,094
12.4
Northwest LP
346
306,842
11.3
Antrim
16
23,324
6.9
Benzie
15
17,766
8.4
Charlevoix
19
26,143
7.3
Emmet
50
33,415
15.0
Grand Traverse
147
93,088
15.8
Kalkaska
11
18,038
6.1
Leelanau
44
21,761
20.2
Manistee
18
24,558
7.3
Missaukee
*
15,118
*
Wexford
21
33,631
6.2
Northeast LP
170
203,087
8.4
Alcona
6
10,405
5.8
Alpena
38
28,405
13.4
Cheboygan
16
25,276
6.3
Crawford
7
14,029
5.0
Iosco
18
25,127
7.2
Montmorency
*
9,328
*
Ogemaw
22
20,997
10.5
Oscoda
*
8,241
*
Otsego
30
24,668
12.2
Presque Isle
9
12,592
7.1
Roscommon
17
24,019
7.1
West/West Central
1,379
1,613,924
8.5
Allegan
64
118,081
5.4
Barry
47
61,550
7.6
Ionia
32
64,697
4.9
Kent
775
656,955
11.8
Lake
*
11,853
*
Mason
22
29,144
7.5
Mecosta
21
43,453
4.8
Montcalm
36
63,888
5.6
Muskegon
88
173,566
5.1
Newaygo
19
48,980
3.9
Oceana
13
26,467
4.9
Osceola
9
23,460
3.8
Ottawa
250
291,830
8.6
East Central
464
558,686
8.3
Arenac
11
14,883
7.4
Bay
92
103,126
8.9
Clare
9
30,950
2.9
Gladwin
12
25,449
4.7
Gratiot
29
40,711
7.1
Isabella
31
69,872
4.4
Midland
88
83,156
10.6
Saginaw
192
190,539
10.1
East
536
845,066
6.3
Genesee
260
405,813
6.4
Huron
20
30,981
6.5
Lapeer
63
87,607
7.2
Saint Clair
111
159,128
7.0
Sanilac
20
41,170
4.9
Shiawassee
34
68,122
5.0
Tuscola
28
52,245
5.4
South Central
353
482,269
7.3
Clinton
78
79,595
9.8
Eaton
78
110,268
7.1
Ingham
197
292,406
6.7
Southwest
618
784,571
7.9
Berrien
113
153,401
7.4
Branch
22
43,517
5.1
Calhoun
99
134,159
7.4
Cass
27
51,787
5.2
Kalamazoo
264
265,066
10.0
Saint Joseph
39
60,964
6.4
Van Buren
54
75,677
7.1
Southeast
1,265
1,012,662
12.5
Hillsdale
22
45,605
4.8
Jackson
144
158,510
9.1
Lenawee
62
98,451
6.3
Livingston
250
191,995
13.0
Monroe
147
150,500
9.8
Washtenaw
640
367,601
17.4
Detroit Metro
3,862
3,880,899
10.0
Macomb
831
873,972
9.5
Oakland
1,742
1,257,584
13.9
Wayne
1,289
1,749,343
7.4
Michigan
10,687
9,986,857
10.7
*To see other regions, please press the “Next” button at the bottom of the table.
*Cells with less than 6 nurses were censored.
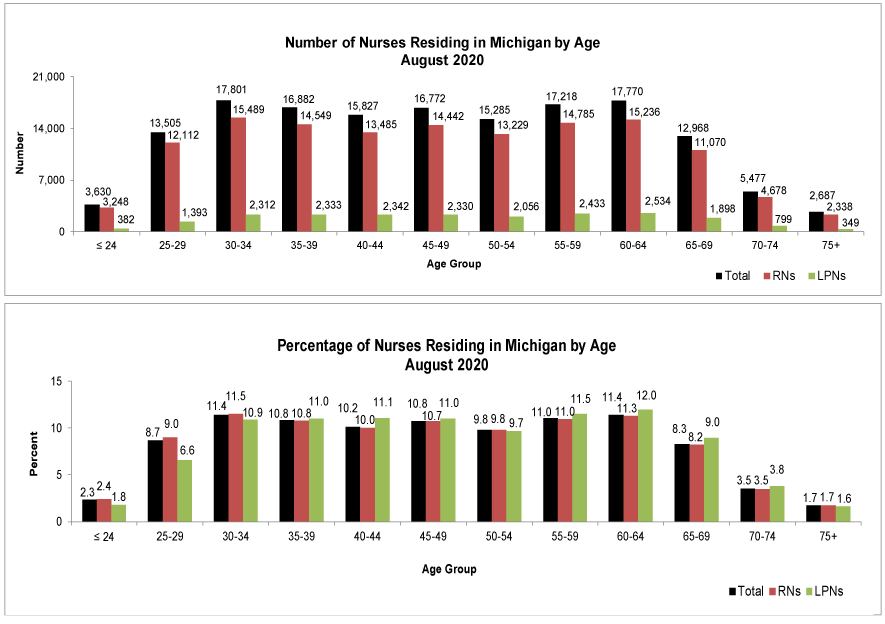
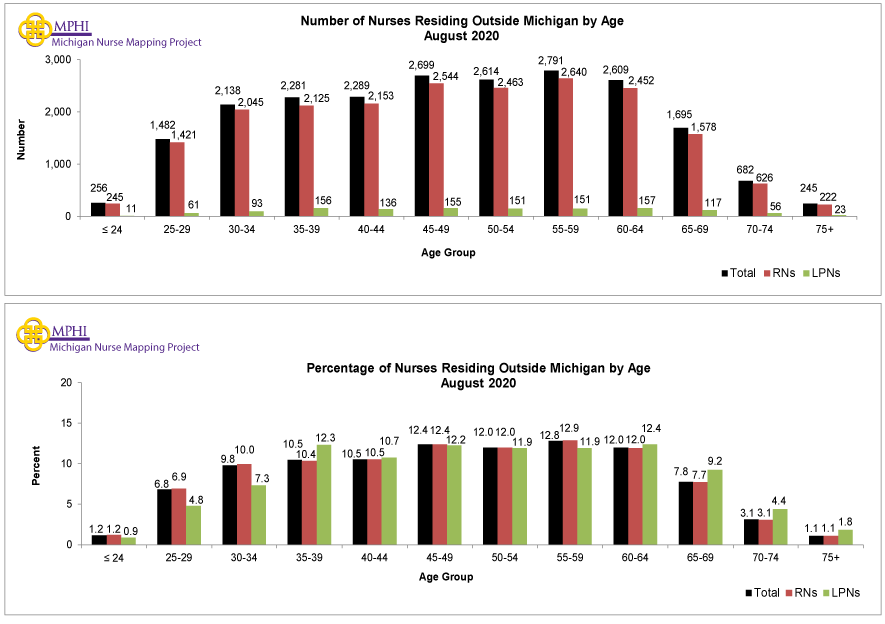
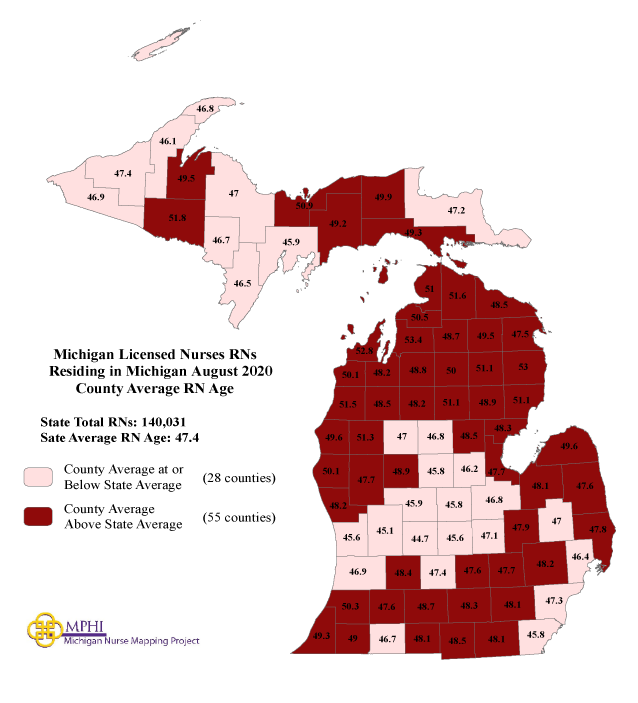
StatewideAge Distribution of Michigan Licensed Nurses Residing in MichiganAge Distribution of Michigan Licensed Nurses Residing Outside of MichiganCounty Michigan Licensed RNs Mean Age by County
Total RN
Average Age
Median Age
Michigan
164,077
47.5
47.0
Eastern/ Central/ Western UP
4,287
47.2
47.0
Alger
96
50.9
52.0
Baraga
102
49.5
52.0
Chippewa
393
47.2
47.0
Delta
538
45.9
45.0
Dickinson
409
46.7
47.0
Gogebic
185
46.9
48.0
Houghton
603
46.1
45.0
Iron
146
51.8
55.0
Keweenaw
44
46.8
46.0
Luce
61
49.9
50.0
Mackinac
117
49.3
50.0
Marquette
1,223
47.0
46.0
Menominee
194
46.5
46.0
Ontonagon
73
47.4
49.0
Schoolcraft
103
49.2
52.5
Northwest LP
5,136
49.8
51.0
Antrim
264
53.4
56.0
Benzie
312
50.1
50.0
Charlevoix
429
50.5
53.0
Emmet
744
51.0
53.0
Grand Traverse
1,963
48.2
48.0
Kalkaska
156
48.8
50.0
Leelanau
439
52.8
56.0
Manistee
281
51.5
52.0
Missaukee
161
48.2
50.0
Wexford
387
48.5
48.0
Northeast LP
2,615
49.7
51.0
Alcona
113
53.0
55.0
Alpena
472
47.5
47.0
Cheboygan
314
51.6
53.0
Crawford
168
50.0
51.0
Iosco
273
51.1
54.0
Montmorency
99
49.5
51.0
Ogemaw
319
48.9
48.0
Oscoda
73
51.1
52.0
Otsego
345
48.7
49.0
Presque Isle
176
48.5
50.0
Roscommon
263
51.1
54.0
West/West Central
21,033
46.1
45.0
Allegan
1,391
46.9
46.0
Barry
897
48.4
47.0
Ionia
624
44.7
43.0
Kent
9,307
45.1
43.0
Lake
69
51.3
53.0
Mason
489
49.6
51.0
Mecosta
395
48.9
49.0
Montcalm
732
45.9
44.0
Muskegon
1,928
48.2
48.0
Newaygo
484
47.7
49.0
Oceana
235
50.1
51.0
Osceola
231
47.0
45.0
Ottawa
4,251
45.6
44.0
East Central
8,106
46.9
46.0
Arenac
210
48.3
48.0
Bay
1,931
47.7
48.0
Clare
331
46.8
46.0
Gladwin
360
48.5
49.0
Gratiot
486
45.8
45.0
Isabella
625
45.8
45.0
Midland
1,384
46.2
45.0
Saginaw
2,779
46.8
46.0
East
12,358
47.7
48.0
Genesee
6,088
47.9
47.0
Huron
376
49.6
51.0
Lapeer
1,390
47.0
48.0
Saint Clair
2,442
47.8
48.0
Sanilac
456
47.6
47.0
Shiawassee
942
47.1
47.0
Tuscola
664
48.1
49.0
South Central
5,727
47.1
46.0
Clinton
1,361
45.6
44.0
Eaton
1,437
47.4
47.0
Ingham
2,929
47.6
47.0
Southwest
10,021
48.4
48.0
Berrien
1,860
49.3
50.0
Branch
438
48.1
47.0
Calhoun
1,665
48.7
48.0
Cass
425
49.0
50.0
Kalamazoo
4,022
47.6
47.0
Saint Joseph
610
46.7
46.0
Van Buren
1,001
50.3
51.0
Southeast
17,171
47.7
48.0
Hillsdale
508
48.5
49.0
Jackson
2,322
48.3
49.0
Lenawee
1,281
48.1
48.0
Livingston
4,130
47.7
49.0
Monroe
2,460
45.8
46.0
Washtenaw
6,470
48.1
48.0
Detroit Metro
53,577
47.4
47.0
Macomb
13,125
46.4
46.0
Oakland
20,013
48.2
48.0
Wayne
20,439
47.3
47.0
Outside Michigan
24,046
48.2
49.0
*To see other regions, please press the “Next” button at the bottom of the table.
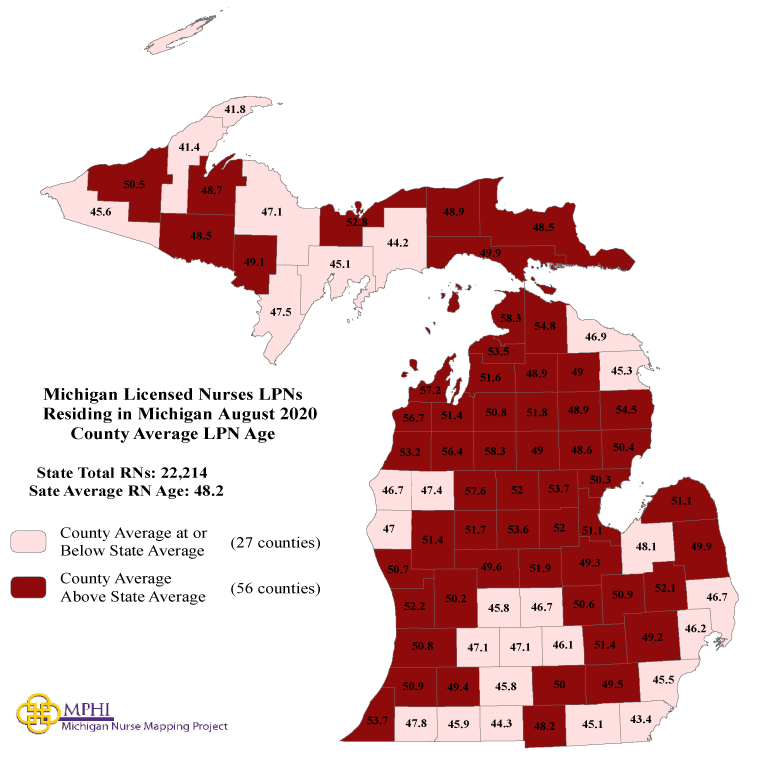
*Population data are based on 2020 census data.Michigan Licensed LPNs Mean Age by County
Total
LPN
Average Age
Median Age
Michigan
23,655
48.2
48.0
Eastern/ Central/ Western UP
1,515
47.0
47.0
Alger
40
52.8
55.0
Baraga
39
48.7
55.0
Chippewa
131
48.5
48.0
Delta
164
45.1
43.0
Dickinson
142
49.1
52.0
Gogebic
78
45.6
42.0
Houghton
112
41.4
37.0
Iron
45
48.5
47.0
Keweenaw
*
*
*
Luce
25
48.9
48.5
Mackinac
39
49.9
52.0
Marquette
540
47.1
47.0
Menominee
91
47.5
51.0
Ontonagon
19
50.5
48.0
Schoolcraft
45
44.2
45.5
Northwest LP
593
53.8
57.0
Antrim
56
51.6
54.0
Benzie
46
56.7
60.5
Charlevoix
35
53.5
56.0
Emmet
37
58.3
62.0
Grand Traverse
203
51.4
56.0
Kalkaska
35
50.8
53.0
Leelanau
38
57.2
62.5
Manistee
48
53.2
57.0
Missaukee
37
58.3
59.0
Wexford
58
56.4
60.5
Northeast LP
698
48.9
49.0
Alcona
34
54.5
56.5
Alpena
173
45.3
45.0
Cheboygan
35
54.8
59.0
Crawford
60
51.8
52.0
Iosco
86
50.4
52.0
Montmorency
22
49.0
47.0
Ogemaw
79
48.6
49.0
Oscoda
22
48.9
48.5
Otsego
66
48.9
47.0
Presque Isle
41
46.9
46.5
Roscommon
80
49.0
47.0
West/West Central
3,479
50.3
50.0
Allegan
217
50.8
51.0
Barry
162
47.1
46.0
Ionia
139
45.8
43.0
Kent
1,383
50.2
50.0
Lake
12
47.4
42.5
Mason
81
46.7
46.0
Mecosta
51
51.7
50.0
Montcalm
187
49.6
49.5
Muskegon
420
50.7
50.0
Newaygo
101
51.4
52.0
Oceana
56
47.0
47.0
Osceola
45
57.6
60.0
Ottawa
625
52.2
54.0
East Central
1,489
51.0
52.0
Arenac
62
50.3
52.0
Bay
337
51.1
52.0
Clare
86
52.0
53.0
Gladwin
71
53.7
53.5
Gratiot
117
51.9
53.5
Isabella
134
53.6
54.0
Midland
175
52.0
53.0
Saginaw
507
49.3
49.0
East
2,104
49.5
50.0
Genesee
711
50.9
53.0
Huron
185
51.1
52.0
Lapeer
172
52.1
52.5
Saint Clair
588
46.7
46.0
Sanilac
148
49.9
48.5
Shiawassee
85
50.6
52.5
Tuscola
215
48.1
48.0
South Central
697
46.5
45.0
Clinton
113
46.7
47.0
Eaton
194
47.1
44.5
Ingham
390
46.1
45.0
Southwest
1,594
48.5
48.0
Berrien
263
53.7
55.0
Branch
125
44.3
44.0
Calhoun
381
45.8
45.0
Cass
71
47.8
47.0
Kalamazoo
458
49.4
49.0
Saint Joseph
190
45.9
45.0
Van Buren
106
50.9
53.0
Southeast
2,183
47.2
47.0
Hillsdale
136
48.2
48.0
Jackson
434
50.0
51.0
Lenawee
308
45.1
45.0
Livingston
256
51.4
55.0
Monroe
697
43.4
42.0
Washtenaw
352
49.5
49.0
Detroit Metro
7,862
46.5
45.0
Macomb
1,657
46.2
45.0
Oakland
1,786
49.2
49.0
Wayne
4,419
45.5
43.0
Outside Michigan
1,441
49.0
49.0
*To see other regions, please press the “Next” button at the bottom of the table.
*Cells with less than 6 nurses were censored
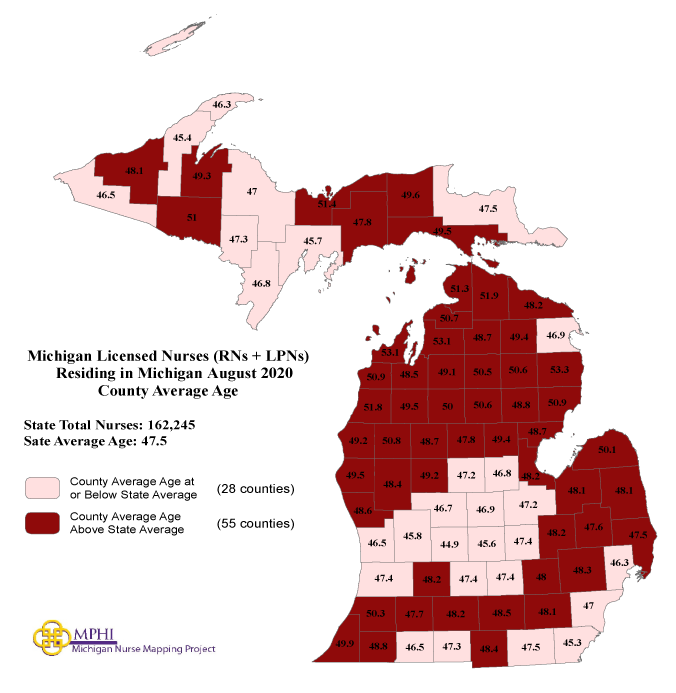
Michigan Nurses Above or Below Mean Age
Total Nurses
Average Age
Median Age
Michigan
187,732
47.6
48.0
Eastern/ Central/ Western UP
5,802
47.1
47.0
Alger
136
51.4
54.0
Baraga
141
49.3
53.0
Chippewa
524
47.5
48.0
Delta
702
45.7
45.0
Dickinson
551
47.3
48.0
Gogebic
263
46.5
47.5
Houghton
715
45.4
44.0
Iron
191
51.0
54.5
Keweenaw
49
46.3
46.0
Luce
86
49.6
50.0
Mackinac
156
49.5
51.0
Marquette
1,763
47.0
47.0
Menominee
285
46.8
47.0
Ontonagon
92
48.1
49.0
Schoolcraft
148
47.8
47.0
Northwest LP
5,729
50.2
52.0
Antrim
320
53.1
55.0
Benzie
358
50.9
52.0
Charlevoix
464
50.7
53.0
Emmet
781
51.3
53.0
Grand Traverse
2,166
48.5
48.0
Kalkaska
191
49.1
50.0
Leelanau
477
53.1
57.0
Manistee
329
51.8
54.0
Missaukee
198
50.0
53.5
Wexford
445
49.5
49.0
Northeast LP
3,313
49.5
50.0
Alcona
147
53.3
55.0
Alpena
645
46.9
47.0
Cheboygan
349
51.9
53.0
Crawford
228
50.5
51.0
Iosco
359
50.9
53.0
Montmorency
121
49.4
51.0
Ogemaw
398
48.8
49.0
Oscoda
95
50.6
52.0
Otsego
411
48.7
48.5
Presque Isle
217
48.2
50.0
Roscommon
343
50.6
52.0
West/West Central
24,512
46.7
46.0
Allegan
1,608
47.4
47.0
Barry
1,059
48.2
47.0
Ionia
763
44.9
43.0
Kent
10,690
45.8
44.0
Lake
81
50.8
52.0
Mason
570
49.2
50.0
Mecosta
446
49.2
49.0
Montcalm
919
46.7
45.0
Muskegon
2,348
48.6
48.0
Newaygo
585
48.4
50.0
Oceana
291
49.5
50.5
Osceola
276
48.7
48.0
Ottawa
4,876
46.5
45.0
East Central
9,595
47.5
47.0
Arenac
272
48.7
49.0
Bay
2,268
48.2
49.0
Clare
417
47.8
47.0
Gladwin
431
49.4
50.0
Gratiot
603
46.9
47.0
Isabella
759
47.2
47.0
Midland
1,559
46.8
46.0
Saginaw
3,286
47.2
46.0
East
14,462
48.0
48.0
Genesee
6,799
48.2
48.0
Huron
561
50.1
52.0
Lapeer
1,562
47.6
48.0
Saint Clair
3,030
47.5
48.0
Sanilac
604
48.1
48.0
Shiawassee
1,027
47.4
47.0
Tuscola
879
48.1
48.0
South Central
6,424
47.0
46.0
Clinton
1,474
45.6
44.0
Eaton
1,631
47.4
47.0
Ingham
3,319
47.4
46.0
Southwest
11,615
48.4
48.0
Berrien
2,123
49.9
51.0
Branch
563
47.3
46.0
Calhoun
2,046
48.2
48.0
Cass
496
48.8
50.0
Kalamazoo
4,480
47.7
47.0
Saint Joseph
800
46.5
46.0
Van Buren
1,107
50.3
51.0
Southeast
19,354
47.6
48.0
Hillsdale
644
48.4
49.0
Jackson
2,756
48.5
49.0
Lenawee
1,589
47.5
48.0
Livingston
4,386
48.0
49.0
Monroe
3,157
45.3
44.0
Washtenaw
6,822
48.1
48.0
Detroit Metro
61,439
47.3
47.0
Macomb
14,782
46.3
46.0
Oakland
21,799
48.3
48.0
Wayne
24,858
47.0
46.0
Outside Michigan
25,487
48.2
49.0
*To see other regions, please press the “Next” button at the bottom of the table.
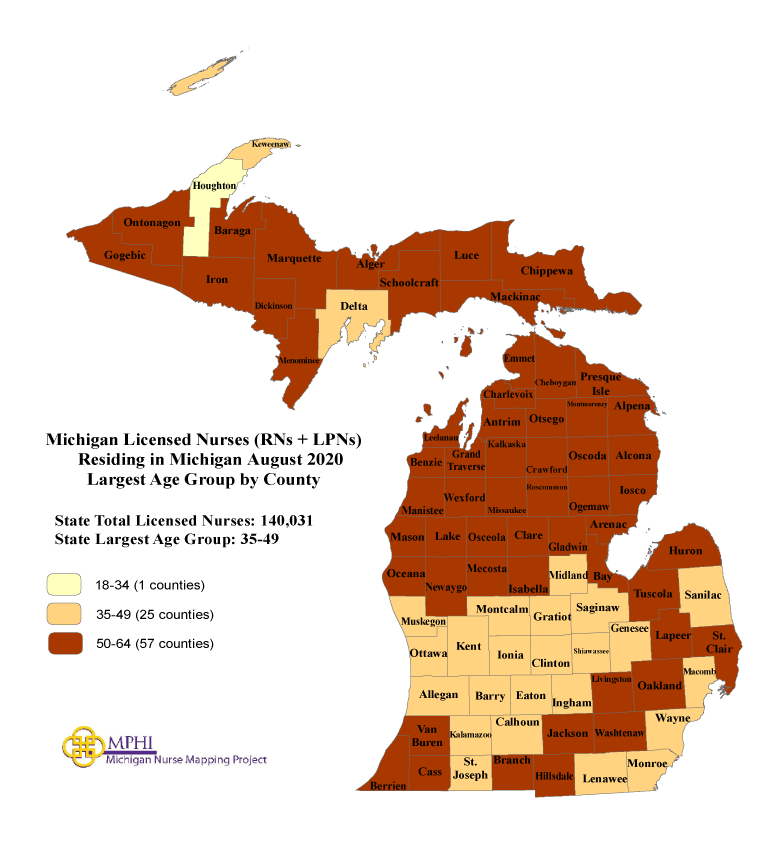
*Population data are based on 2020 census data.Largest Age Group of Michigan Licensed Nurses by County